. 2024 Jan 12:11:1324158.
doi: 10.3389/fcell.2023.1324158. eCollection 2023.

Impact of platelet-derived mitochondria transfer in the metabolic profiling and progression of metastatic MDA-MB-231 human triple-negative breast cancer cells

Affiliations

Impact of platelet-derived mitochondria transfer in the metabolic profiling and progression of metastatic MDA-MB-231 human triple-negative breast cancer cells

Lucas Cereceda et al. Front Cell Dev Biol. .

Abstract

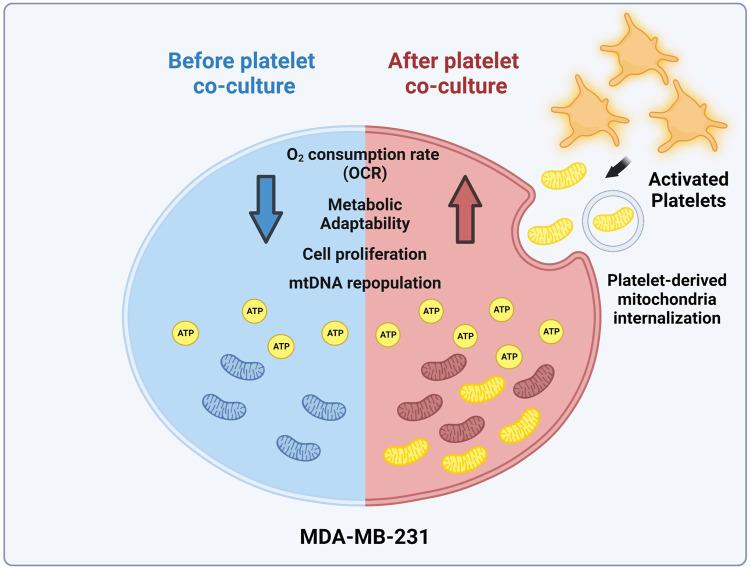
Introduction: An active role of platelets in the progression of triple-negative breast cancer (TNBC) cells has been described. Even the role of platelet-derived extracellular vesicles on the migration of MDA-MB-231 cells has been reported. Interestingly, upon activation, platelets release functional mitochondria into the extracellular environment. However, the impact of these platelet-derived mitochondria on the metabolic properties of MDA-MB-231 cells remains unclear. Methods: MDA-MB-231 and MDA-MB-231-Rho-0 cells were co-cultured with platelets, which were isolated from donor blood. Mitochondrial transfer was assessed through confocal microscopy and flow cytometry, while metabolic analyses were conducted using a Seahorse XF HS Mini Analyzer. The mito-chondrial DNA (mtDNA) copy number was determined via quantitative PCR (qPCR) following platelet co-culture. Finally, cell proliferation and colony formation assay were performed using crystal violet staining. Results and Discussion: We have shown that platelet-derived mitochondria are internalized by MDA-MB-231 cells in co-culture with platelets, increasing ATP production, oxygen (O2) consumption rate (OCR), cell proliferation, and metabolic adaptability. Additionally, we observed that MDA-MB-231 cells depleted from mtDNA restore cell proliferation in uridine/pyruvate-free cell culture medium and mitochondrial O2 consumption after co-culture with platelets, indicating a reconstitution of mtDNA facilitated by platelet-derived mitochondria. In conclusion, our study provides new insights into the role of platelet-derived mitochondria in the metabolic adaptability and progression of metastatic MDA-MB-231 TNBC cells.

Keywords: cancer; metabolic adaptability; mitochondria transfer; platelet-derived mitochondria; platelets.


Conflict of interest statement

MK is the chief scientific officer of Cells for Cells and Regenero, the Chilean Consortium for Regenerative Medicine. The remaining authors declare that the research was conducted without commercial or financial relationships that could be construed as a potential conflict of interest. The author(s) declared that they were an editorial board member of Frontiers, at the time of submission. This had no impact on the peer review process and the final decision.

Figures

FIGURE 1
FIGURE 1
MDA-MB-231 cells acquire platelet-derived mitochondria. (A) Flow cytometry histograms of CD62p expression in platelets after isolation or after 24 h co-culture with MDA-MB-231 cells. (B) Frequency of platelet activation after isolation or after 24 h co-culture with MDA-MB-231 cells. (C) Venn diagram of mitochondrial proteins from three samples: PEVs-THR, PEVs-BCC, and EVs-MDA-MB-231. (D) Amount of total and unique mitochondrial proteins for PEVs-THR and PEVs-BCC. Common mitochondrial proteins between PEVs-BCC and EVs-MDA-MB-231 were discarded to avoid possible contamination with proteins from EVs released by MDA-MB-231 cells. (E) Flow cytometry histograms of MitoTracker Green (MTG) signal on MDA-MB-231 cells after 24 h co-culture. MDA-MB-231 cells were cultured with buffer or platelets previously stained with MTG. (F) MTG MFI on MDA-MB-231 cells cultured with buffer or MTG platelets. (G) Flow cytometry histograms of FSC-H for MDA-MB-231 cells cultured with buffer or platelets for 24 h. (H) FSC-H MFI for MDA-MB-231 cells cultured with buffer or platelets for 24 h. (I) Flow cytometry histograms of SSC-H for MDA-MB-231 cells cultured with buffer or platelets for 24 h. (J) SSC-H MFI for MDA-MB-231 cells cultured with buffer or platelets 24 h. (K) Confocal microscopy images of platelet-derived mitochondria internalization by MDA-MB-231 cells. These cells were previously stained with MitoTracker Deep Red (MTDR) and co-cultured with MTG platelets for 24 h. Scale bar = 10 µm. A t-student statistical test was performed. *p < 0.05; **p < 0.01; ****p < 0.0001; ns = not significant.
FIGURE 2
FIGURE 2
Effect of platelet-derived mitochondria on the bioenergetic properties of MDA-MB-231 cells. (A) Gene ontology results of enriched biological process identified for mitochondrial proteins related to PEVs-BCC. GO-annotation analysis was performed using STRING V11.5 gene ontology tools. Biological processes with strength >1 and false discovery rate (FDR) < 0.05 were selected. (B) Analysis of ATP content of MDA-MB-231 cells cultured with buffer or platelets for 24 h. Results were expressed as relative light units (RLU) normalized by a total number of cells. (C) Seahorse assay results of OCR for MDA-MB-231 cells cultured with buffer or platelets. MDA-MB-231 cells were co-cultured with platelets for 24 h. After that, cells were washed, reseeded, and cultured for 48 h before performing the seahorse assay. Results were normalized to µg of a total protein of each well. (D) Basal OCR of MDA-MB-231 cells cultured with buffer or platelets. (E) ATP-linked OCR of MDA-MB-231 cells cultured with buffer or platelets. (F) Flow cytometry histograms of TMRE signal in MDA-MB-231 cells after 24 h co-culture. MDA-MB-231 cells were cultured with buffer or platelets, and mitochondrial membrane potential (ΔΨm) was analyzed using TMRE dye. (G) TMRE MFI in MDA-MB-231 cells cultured with buffer or platelets. (H) Analysis of ATP content of sorted MDA-MB-231 cells cultured with buffer or platelets for 24 h. MDA-MB-231 cells were cultured with platelets previously stained with MTG. MDA-MB-231 cells positive for MTG signal were separated according to MTG intensity, retrieving two populations. Those with low MTG intensity are named MITO-Low, and those with high MTG intensity are named MITO-High. Results are expressed as RLU normalized by the total number of cells. (I) Analysis of relative mitochondrial DNA (mtDNA) levels of sorted MDA-MB-231 cells. Relative mtDNA levels were determined using quantitative PCR (qPCR) by amplifying mtDNA and nuclear DNA (ncDNA). A t-student statistical test was performed. *p < 0.05; **p < 0.01; ns = not significant.
FIGURE 3
FIGURE 3
MDA-MB-231-Rho-0 cells restore impaired mitochondrial function by acquiring platelet-derived mitochondria. (A) Frequency of platelet activation after isolation or after 24 h co-culture with Rho-0 cells. (B) Microscopic (left panel) and macroscopic (right panel) images of colonies formed by platelet-rescued Rho-0 cells in pyruvate/uridine-free cell culture medium. Rho-0 cells were cultured with buffer or platelets for 24 h. After that, cells were washed, reseeded, and cultured for 48 h in medium with pyruvate/uridine. Next, cells were maintained in pyruvate/uridine-free medium to evidence mitochondrial function recovery and colony isolation was performed. Colonies were visualized by 0.5% crystal violet staining. (C) Analysis of relative mtDNA levels of platelet-rescued Rho-0 cells by three different donors (Rho-1, Rho-2, and Rho-3). Relative mtDNA levels were determined using quantitative PCR (qPCR) by simultaneous amplification of mtDNA and ncDNA. (D) Gel agarose electrophoresis for amplified products of mitochondrial encoded NADH dehydrogenase 1 (MT-ND1) gene and ribosomal protein lateral stalk subunit P0 (RPLP0) gene. Products of qPCR were loaded into a 2% agarose gel, and electrophoresis was performed. Gel was visualized using UV light to confirm the expected amplicon for each primer pair. (E) ATP production analysis of platelet-rescued Rho-1, Rho-2, and Rho-3 cells. ATP production was modulated with 5 µM oligomycin (Oligo) for 20 h. Results were expressed as RLU normalized to µg of total protein. (F) Seahorse assay results of OCR for platelet-rescued Rho-3 cells. Results were normalized to µg of the protein of each well. (G) Basal OCR of platelet-rescued Rho-3 cells. (H) ATP production linked to OCR of platelet-rescued Rho-3 cells. (I) Cell viability assay of MDA-MB-231 WT, Rho-0, and platelet-rescued Rho-3. Cells were treated with BAY-876 or BAY 87–2243 for 72 h as control cells were treated with vehicle (DMSO). Cell viability was determined by 0.5% crystal violet stained. Results were normalized to control. A t-student statistical test was performed. *p < 0.05; **p < 0.01; ****p < 0.0001; ns = not significant.
FIGURE 4
FIGURE 4
Platelet-derived mitochondria promote proliferation and increase clonogenic potential by augmenting the metabolic adaptability of MDA-MB-231 cells. Proliferation analysis of MDA-MB-231 cells cultured with buffer or platelets for 24 h. MDA-MB-231 cells were co-cultured with platelets. After that, cells were washed, reseeded, and proliferation was evaluated at 24 (A), 48 (B), and 72 h (C) by 0.5% crystal violet staining. Cell proliferation assay of sorted MDA-MB-231 cells cultured with buffer or platelets for 24 h. MDA-MB-231 cells were cultured with platelets previously stained with MTG. MDA-MB-231 cells positive for MTG signal were separated according to MTG intensity, retrieving two populations. Those with low MTG intensity are named MITO-Low, and those with high MTG intensity are named MITO-High. Sorted cells were seeded, and proliferation was evaluated at 24 (D), 48 (E), and 72 h (F) by 0.5% crystal violet staining. (G) Macroscopic images of colonies formed by sorted MDA-MB-231 cells in a glucose-free culture medium with 10 mM galactose and 4 mM glutamine. Sorted cells were cultured in a glucose-free cell culture medium to evidence metabolic adaptability, and colony visualization was performed by 0.5% crystal violet staining. (H) Quantification of the area covered by colonies formed in a glucose-free culture medium with 10 mM galactose and 4 mM glutamine. Results were expressed as fold change relative to PLT- (without platelets). A t-student statistical test was performed. *p < 0.05; ns = not significant.
FIGURE 5
FIGURE 5
Model of mitochondrial transfer from platelets to MDA-MB-231 cells. Activation of platelets by MDA-MB-231 human triple-negative breast cancer (TNBC) cells triggers the release of platelet-derived mitochondria. These cells then internalize these mitochondria, leading to the reconstitution of mitochondrial DNA (mtDNA), increasing ATP production, oxygen (O2) consumption rate (OCR), and cell proliferation. Interestingly, MDA-MB-231 cells with high levels of platelet-derived mitochondria exhibit superior metabolic adaptability. This highlights the significant influence of platelet-derived mitochondria on the progression of MDA-MB-231 TNBC cells (Created with BioRender.com).

Similar articles

Cited by

References

    1. Agnello M., Morici G., Rinaldi A. M. (2008). A method for measuring mitochondrial mass and activity. Cytotechnology 56, 145–149. 10.1007/s10616-008-9143-2 - DOI - PMC - PubMed
    1. Bambace N. M., Holmes C. E. (2011). The platelet contribution to cancer progression. J. Thromb. Haemost. 9, 237–249. 10.1111/j.1538-7836.2010.04131.x - DOI - PubMed
    1. Boudreau L. H., Duchez A. C., Cloutier N., Soulet D., Martin N., Bollinger J., et al. (2014). Platelets release mitochondria serving as substrate for bactericidal group IIA-secreted phospholipase A2 to promote inflammation. Blood 124, 2173–2183. 10.1182/blood-2014-05-573543 - DOI - PMC - PubMed
    1. Chen L., Zhu C., Pan F., Chen Y., Xiong L., Li Y., et al. (2023). Platelets in the tumor microenvironment and their biological effects on cancer hallmarks. Front. Oncol. 13, 1121401–1121412. 10.3389/fonc.2023.1121401 - DOI - PMC - PubMed
    1. Cottet-Rousselle C., Ronot X., Leverve X., Mayol J. F. (2011). Cytometric assessment of mitochondria using fluorescent probes. Cytom. Part A 79 A, 405–425. 10.1002/cyto.a.21061 - DOI - PubMed