. 2024 Jan 26;16(3):2410-2437.
doi: 10.18632/aging.205488. Epub 2024 Jan 26.

A novel PANoptosis-related long non-coding RNA index to predict prognosis, immune microenvironment and personalised treatment in hepatocellular carcinoma

Affiliations

A novel PANoptosis-related long non-coding RNA index to predict prognosis, immune microenvironment and personalised treatment in hepatocellular carcinoma

Liangliang Wang et al. Aging (Albany NY). .

Abstract

Background: PANoptosis is involved in the interaction of apoptosis, necroptosis and pyroptosis, playing a role in programmed cell death. Moreover, long non-coding RNAs (lncRNAs) regulate the PCD. This work aims to explore the role of PANoptosis-associated lncRNAs in hepatocellular carcinoma (HCC).

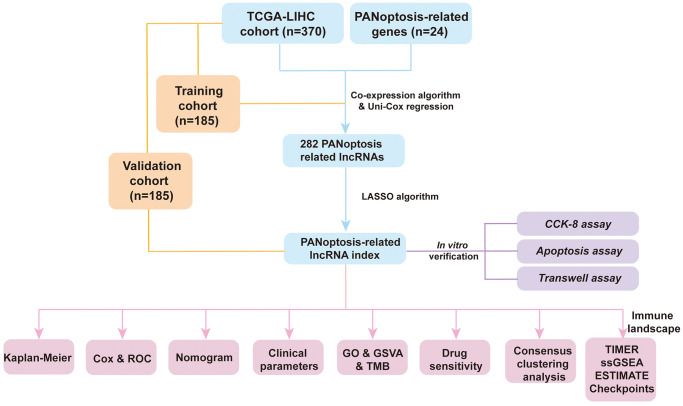
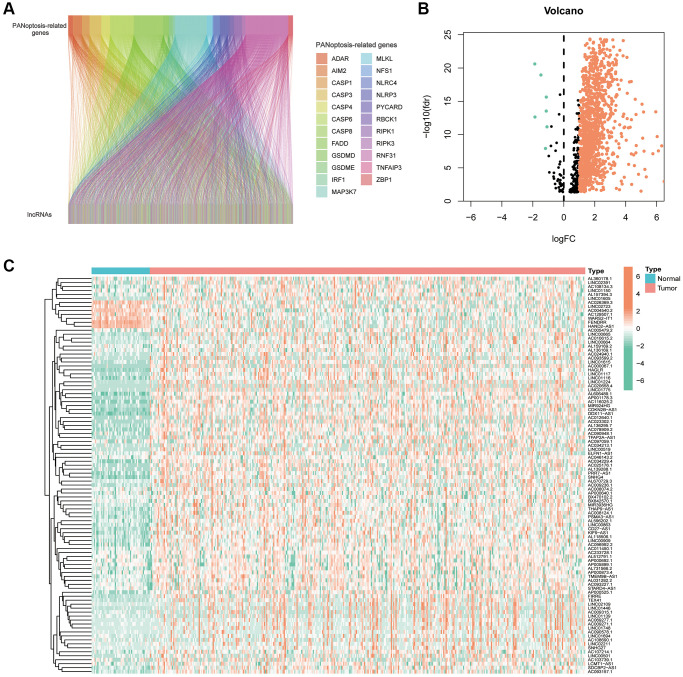
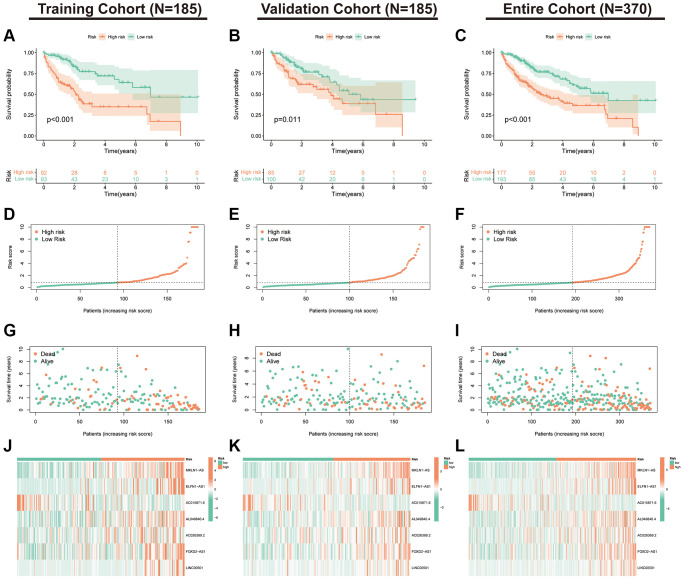
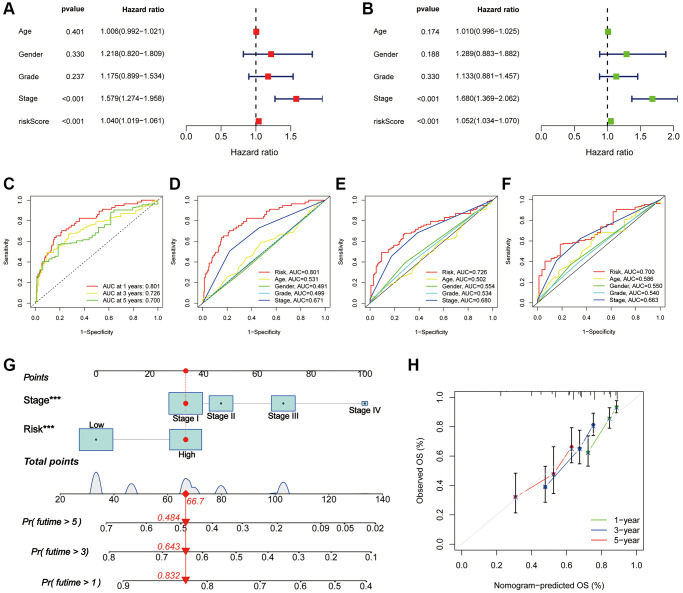
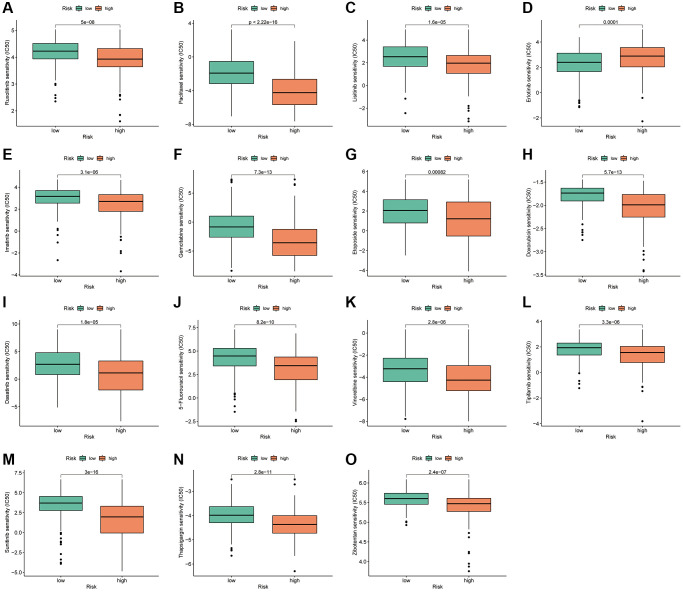
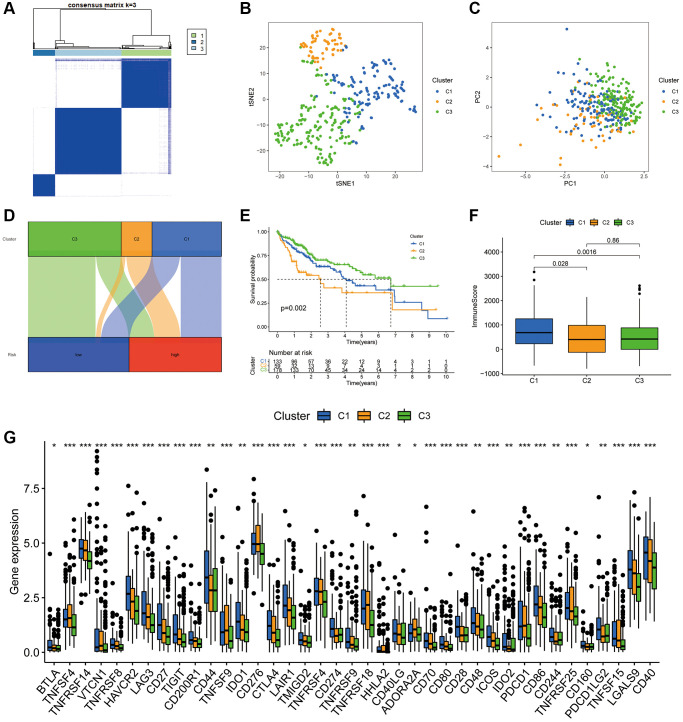
Methods: Co-expression analysis identified PANoptosis-associated lncRNAs in HCC. Cox and Least Absolute Shrinkage and Selection Operator (LASSO) algorithms were utilised to filter lncRNAs and establish a PANoptosis-related lncRNA index (PANRI). Additionally, Cox, Kaplan-Meier and receiver operating characteristic (ROC) curves were utilised to systematically evaluate the PANRI. Furthermore, Estimation of STromal and Immune cells in MAlignant Tumor tissues using Expression data (ESTIMATE), single sample gene set enrichment analysis (ssGSEA) and immune checkpoints were performed to analyse the potential of the PANRI in differentiating different tumour immune microenvironment (TIME) populations. The consensus clustering algorithm was used to distinguish individuals with HCC having different TIME subtypes. Finally, HCC cell lines HepG2 were utilised for further validation in in vitro experiments.

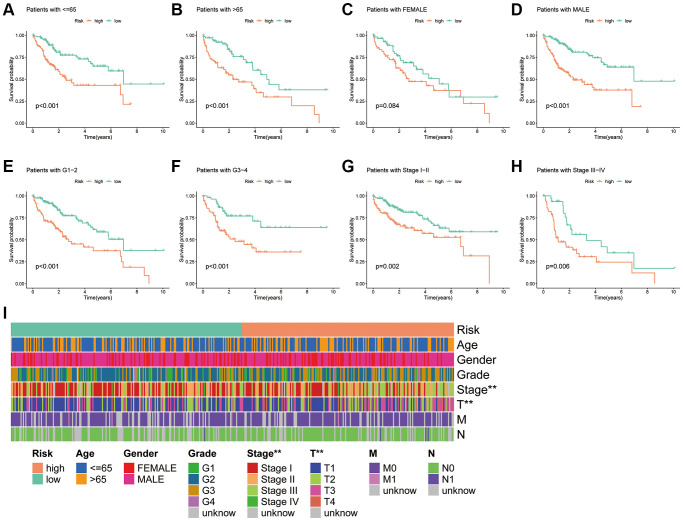
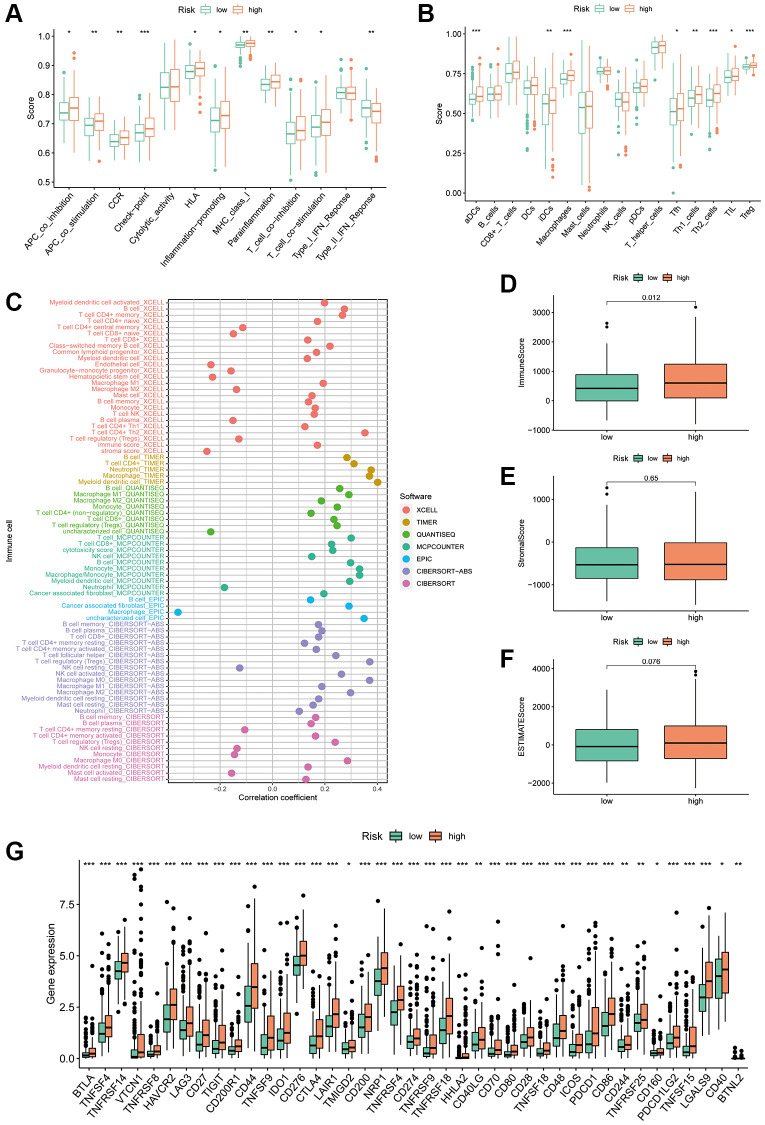
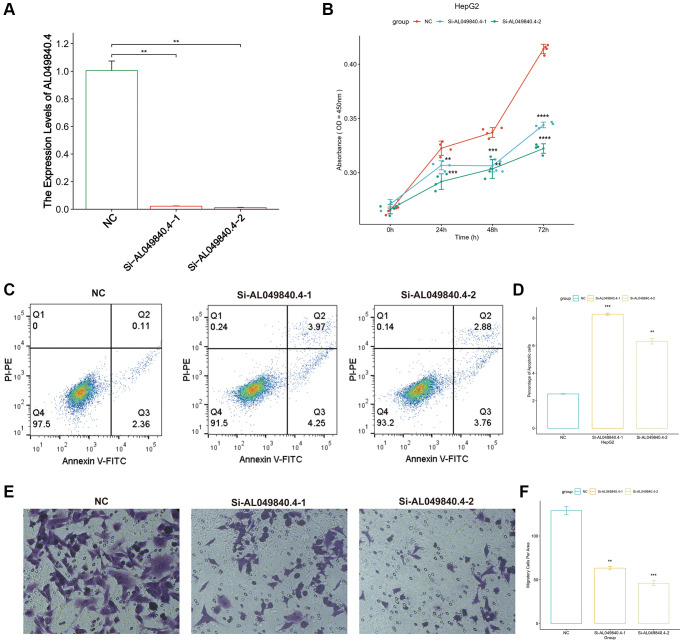
Results: The PANRI differentiates patients according to risk. Notably, ESTIMATE and ssGSEA algorithms revealed a high immune infiltration status in high-risk patients. Additionally, consensus clustering divided the patients into three clusters to identify different subtypes of TIME. Moreover, in vitro results showed that siRNA-mediated silencing of AL049840.4 inhibited the viability and migration of HepG2 cells and promoted apoptosis.

Conclusions: This is the first PANoptosis-related, lncRNA-based risk index in HCC to assess patient prognosis, TIME and response to immunotherapy. This study offers novel perspectives on the role of PANoptosis-associated lncRNAs in HCC.

Keywords: PANoptosis; hepatocellular carcinoma; lncRNA; prognosis; tumour immune microenvironment.


Conflict of interest statement

CONFLICTS OF INTEREST: All authors declare that the research was conducted in the absence of any commercial or financial relationships that could be construed as a potential conflict of interest.

Figures

Figure 1
Figure 1
Flowchart of the present research.
Figure 2
Figure 2
PANoptosis-related lncRNAs in hepatocellular carcinoma. (A) Sankey plots of the correlation between PANoptosis-related lncRNAs and PANoptosis-related genes. (B) Volcano plot showing 7 down-regulated and 1192 up-regulated expressed lncRNAs. (C) Heat map showing PANoptosis-related lncRNAs expressed in normal and tumour tissues.
Figure 3
Figure 3
Development of a PANRI in hepatocellular carcinoma. (A, B) The LASSO coefficient and partial likelihood deviance of the PANRI. (C) A risk forest plot of the seven lncRNAs used to construct the PANRI. (D) Expression heat map of 7 lncRNAs used to construct PANRI. (E) Heat map of correlations between the expression of PANoptosis-related genes and the seven lncRNAs used to construct the PANRI.
Figure 4
Figure 4
Validation of the PANRI in hepatocellular carcinoma. (AC) Kaplan–Meier curves for overall survival in the training (N = 185), validation (N = 185) and entire (N = 370) cohorts. (DF) Risk score distribution in the three cohorts. (GI) Survival status in the three cohorts. (JL) Heatmap of the expression of the seven PANoptosis-related lncRNAs in the three cohorts.
Figure 5
Figure 5
Assessment of the PANRI in hepatocellular carcinoma. (A, B) Risk forest plots for multivariate and univariate Cox regression. (C) ROC curves of the 1-, 3- and 5-year survival in the TCGA cohort. (DF) Comparison of risk score ROC curves with clinicopathological parameter ROC curves. (G) Tumour stage and risk status were used to construct a nomogram for predicting patient survival. (H) Calibration curves for the nomogram. *p < 0.05, **p < 0.01 and ***p < 0.001.
Figure 6
Figure 6
Association of the PANRI with clinicopathological features in hepatocellular carcinoma. (AH) Kaplan–Meier curves stratified by age, gender, tumour grade and tumour stage. (I) Heat map of the distribution of clinical parameters in different risk groups. *p < 0.05, **p < 0.01 and ***p < 0.001.
Figure 7
Figure 7
PANRI-based GO and KEGG analysis. (A) GO analysis shows the enrichment of DEGs between the risk groups. (B) Heat map of functional pathway enrichment differences between the risk groups. (C) Heat map of the spearman correlation analysis between the expression of the seven lncRNAs involved in the model construction and tumour-related pathways.
Figure 8
Figure 8
Association of the PANRI with TMB in hepatocellular carcinoma. (A) Mutation waterfall map showing the 20 genes with the highest mutation frequency in the high-risk group. (B) Mutation waterfall map showing the 20 genes with the highest mutation frequency in the low-risk group. (C) Comparison of TMB between the two risk groups. (D) Kaplan–Meier curves for the TMB subgroups combined with the risk subgroups.
Figure 9
Figure 9
Correlation of the PANRI with TIME in hepatocellular carcinoma. (A) Box plots of differences in immune-related functions between the high- and low-risk subgroups. (B) Box plots of differences in immune cell scores between the high- and low-risk subgroups. (C) Bubble plots illustrate the correlation between immune cells and risk scores. (DF) Box plots of the differences in the immune cell, stromal cell scores and ESTIMATE scores in the different risk cohorts. (G) Heat map of the differences in immune checkpoints between the two risk subgroups. *p < 0.05, **p < 0.01 and ***p < 0.001.
Figure 10
Figure 10
PANRI-based drug sensitivity analysis. (AO) Box plots show that the IC50 for certain clinical therapeutics differed significantly between the two risk subgroups (p < 0.001).
Figure 11
Figure 11
Hepatocellular carcinoma classification based on the PANRI. (A) Patients were divided into three clusters based on the consensus clustering matrix. (BC) tSNE and PCA analyses of the three clusters. (D) Sankey plot for the risk cohorts and three clusters. (E) Kaplan–Meier curves of the three clusters. (F) Box plots of the differences in immune cell scores in the three clusters. (G) Expression of immune checkpoints in the three clusters. *p < 0.05, **p < 0.01 and ***p < 0.001.
Figure 12
Figure 12
Unfavorable impact of AL049840.4 on HCC in vitro. (A) Validation of knockdown efficiency of AL049840.4 expression in HepG2 cells by qRT-PCR. (B) Cell viability of HepG2 cells after silencing AL049840.4 was detected by CCK-8 assay. (C, D) Cell apoptosis assay revealed that knockdown of AL049840.4 promoted apoptosis in HepG2 cells. (E, F) Transwell assay showed a statistically significant decrease in the HepG2 cells migration after AL049840.4 knockdown.

Similar articles

Cited by

References

    1. Sung H, Ferlay J, Siegel RL, Laversanne M, Soerjomataram I, Jemal A, Bray F. Global Cancer Statistics 2020: GLOBOCAN Estimates of Incidence and Mortality Worldwide for 36 Cancers in 185 Countries. CA Cancer J Clin. 2021; 71:209–49. 10.3322/caac.21660 - DOI - PubMed
    1. Llovet JM, Kelley RK, Villanueva A, Singal AG, Pikarsky E, Roayaie S, Lencioni R, Koike K, Zucman-Rossi J, Finn RS. Hepatocellular carcinoma. Nat Rev Dis Primers. 2021; 7:6. 10.1038/s41572-020-00240-3 - DOI - PubMed
    1. Singal AG, Lampertico P, Nahon P. Epidemiology and surveillance for hepatocellular carcinoma: New trends. J Hepatol. 2020; 72:250–61. 10.1016/j.jhep.2019.08.025 - DOI - PMC - PubMed
    1. Craig AJ, von Felden J, Garcia-Lezana T, Sarcognato S, Villanueva A. Tumour evolution in hepatocellular carcinoma. Nat Rev Gastroenterol Hepatol. 2020; 17:139–52. 10.1038/s41575-019-0229-4 - DOI - PubMed
    1. Liu PH, Hsu CY, Hsia CY, Lee YH, Su CW, Huang YH, Lee FY, Lin HC, Huo TI. Prognosis of hepatocellular carcinoma: Assessment of eleven staging systems. J Hepatol. 2016; 64:601–8. 10.1016/j.jhep.2015.10.029 - DOI - PubMed

Publication types

Substances