. 2024 Mar 4;223(3):e202308083.
doi: 10.1083/jcb.202308083. Epub 2024 Jan 29.

Identification of small molecule inhibitors of G3BP-driven stress granule formation

Affiliations

Identification of small molecule inhibitors of G3BP-driven stress granule formation

Brian D Freibaum et al. J Cell Biol. .

Abstract

Stress granule formation is triggered by the release of mRNAs from polysomes and is promoted by the action of the RNA-binding proteins G3BP1/2. Stress granules have been implicated in several disease states, including cancer and neurodegeneration. Consequently, compounds that limit stress granule formation or promote their dissolution have potential as both experimental tools and novel therapeutics. Herein, we describe two small molecules, G3BP inhibitor a and b (G3Ia and G3Ib), designed to bind to a specific pocket in G3BP1/2 that is targeted by viral inhibitors of G3BP1/2 function. In addition to disrupting the co-condensation of RNA, G3BP1, and caprin 1 in vitro, these compounds inhibit stress granule formation in cells treated prior to or concurrent with stress and dissolve pre-existing stress granules. These effects are consistent across multiple cell types and a variety of initiating stressors. Thus, these compounds represent powerful tools to probe the biology of stress granules and hold promise for therapeutic interventions designed to modulate stress granule formation.


Conflict of interest statement

Disclosures: All authors have completed and submitted the ICMJE Form for Disclosure of Potential Conflicts of Interest. J. Hixon reported “other” from Faze Medicines outside the submitted work and “Employee and shareholder of Faze Medicines” at the time work was done. W. Huynh reported personal fees from Faze Medicines during the conduct of the study and “I was an employee and stockholder of Faze Medicines” at the time that the experiments were done. K. Wong reported “Employee of Faze Medicines.” No other disclosures were reported.

Figures
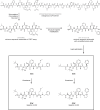
Figure S1.
Figure S1.
Identification of lead compounds that interact with the nsP3 binding pocket of the NTF2L domain of G3BP1. Schematic showing the lead optimization and compound discovery process that led to the identification of G3Ia and G3Ib as lead compounds.
Figure 1.
Figure 1.
Lead compounds G3Ia and G3Ib bind with high affinity to the NTF2L nsP3 binding pocket of G3BP1. (A) Lead compounds FAZ-3532 (G3Ia) and FAZ-3780 (G3Ib) along with respective enantiomer controls FAZ-3861 (G3Ia′) and FAZ-3852 (G3Ib′). (B) Representative double-reference subtracted sensorgrams of compounds binding to sensor-immobilized human G3BP1. Compounds were tested by 1/2 dilution with top concentrations of 50 μM (G3Ia′), 50 μM (G3Ib′), 10 μM (G3Ia), and 2 μM (G3Ib). Marks on each curve indicate the time span at which equilibrium binding was measured to estimate the equilibrium dissociation constant using a 1:1 Langmuir binding model. (C) Percent inhibition calculated using a peptide displacement assay at indicated doses of G3I compounds. Error bars represent mean ± SD, n = 2 replicates per dose. (D) Crystal structure showing the interaction of G3Ia with the nsP3 binding pocket in the NTF2L domain of G3BP1. The NTF2L domain of G3BP1 (light green cartoon model) crystallized in the presence of G3Ia (yellow sticks), with six copies in the asymmetric unit and copy A shown above. All copies were compound bound, although only half had full compound density. The other three were incomplete in either the ether group (1) or terminal phenylalanine (2), highlighting their flexibility. Tert-butyl (3) functions as a space-filling moiety, maximizing the hydrophobicity of the subpocket lined by V11 and F124. An indirect water-mediated backbone interaction with Q18 is present in four of six copies, including copy A above (large red ball). Modified phenylalanine (4) extends the pi-stacking network formed by F15 and F33. (E) Summary characteristics of the four G3I compounds compared with the nsP3 25-mer peptide. MW, molecular weight; PSA, polar surface area; SPR, surface plasmon resonance; Pep-FRET, peptide-fluorescence resonance energy transfer.
Figure 2.
Figure 2.
G3Ia and G3Ib disrupt in vitro condensation of RNA, G3BP1, and caprin 1. (A–D) Lysates from U2OS cells stably expressing G3BP1-GFP were collected, incubated with increasing concentrations of G3I compound, immunoprecipitated for GFP, and separated by SDS-PAGE. Blots were probed for GFP and endogenous caprin 1 (A and B) or endogenous USP10 (C and D). GAPDH was used as a loading control. Densitometry from n = 3 blots was used to generate graphs (B and D); error bars represent mean ± SD. *P = 0.0495, **P = 0.0011, ***P = 0.0002 by one-way ANOVA with Dunnett’s multiple comparisons test. (E) Lysates from HEK293T cells expressing GFP-NTF2L were collected, incubated with increasing concentrations of G3I compounds or nsP3, immunoprecipitated for GFP, and separated by SDS-PAGE. Blots were probed for GFP, endogenous caprin 1, and endogenous USP10. Actin was used as a loading control. A representative blot is shown from n = 3 experiments. (F) Quantification of densitometry from n = 3 blots as shown in E. Error bars represent mean ± SD. ***P = 0.0006 and ****P < 0.0001 for caprin 1, **P = 0.0087 (25 μM G3Ib), **P = 0.0050 (50 μM G3Ib), **P = 0.0015 (25 μM nsP3), ***P = 0.0001 (50 μM nsP3) for USP10 by one-way ANOVA with Dunnett’s multiple comparisons test. (G) 1.5 μM G3BP1, 1.5 μM caprin 1, and 20 ng/μl total RNA were coincubated in a three-component system and co-condensation was assessed in the presence of increasing concentrations of G3I compounds. The percent inhibition of G3BP1-GFP in vitro phase separation is shown. Tables show the highest (top) and lowest (bottom) values of an individual curve, LogIC50, the slope at the steepest part of the curve (HillSlope), and IC50. Error bars represent mean ± SD, N = 3 replicates per condition. (H) 20 μM purified G3BP1 and 100 ng genomic RNA were coincubated in a two-component system and condensation was assessed in the presence of indicated doses of G3Ib or vehicle control. Condensate formation by G3BP1 and RNA was unaffected by the addition of G3Ib. Scale bar, 30 μm. (I) Cytotoxicity assay in U2OS cells treated with indicated concentrations of compounds for 24 h; inhibition of growth was measured by monitoring ATP levels read out through a luciferase signal. N = 2, both replicates are plotted. Source data are available for this figure: SourceData F2.
Figure 3.
Figure 3.
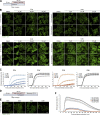
Preincubation with G3Ia or G3Ib prevents the formation of stress granules in living cells. (A) Schematic showing the preincubation paradigm used in B and C. Indicated doses of the compound were added to cells for 20 min, followed by exposure to 500 μM NaAsO2 stress and live cell imaging to monitor stress granule formation. (B) Representative images of G3BP1-GFP signal in U2OS cells after 10 or 20 min of oxidative stress. Scale bars, 40 μm. (C) Quantification of cells as in B showing the percentage of stress granule area per cell. (D) Schematic showing the preincubation paradigm used in E and F. 50 μM of indicated compounds was added to cells for 20 min, followed by exposure to 43°C heat shock for 30 min. Live-cell imaging was used to monitor stress granule formation. (E) Representative images of G3BP1-GFP signal in U2OS cells 15 min after heat shock. Scale bar, 40 μm. (F) Quantification of cells as in E showing the percentage of stress granule area per cell throughout heat shock (43°C, 30 min) and recovery (37°C, 43 min). Error bars represent mean ± SEM in all graphs.
Figure S2.
Figure S2.
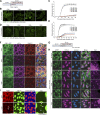
Preincubation with G3Ia or G3Ib prevents the formation of stress granules and inhibits the accumulation of TDP-43 into stress granules. (A) Schematic showing the preincubation paradigm used in B–E and I. 50 μM of indicated compounds was added to cells for 20 min, followed by exposure to 250 μM NaAsO2 stress and live cell imaging to monitor stress granule formation. (B) Representative images of G3BP1-GFP signal in U2OS cells after 20 min 250 μM NaAsO2. Scale bar, 40 μm. (C) Quantification of cells as in B showing the percentage of stress granule area per cell. (D) Representative images of G3BP1-GFP signal in HeLa cells after 20 min of 250 μM NaAsO2. Scale bar, 40 μm. (E) Quantification of cells in D showing the percentage of stress granule area per cell. (F) Representative images of immunofluorescent staining of additional stress granule markers (eIF3η, PABPC1) in cells pre-treated with 50 μM G3I compounds and then exposed to 250 μM NaAsO2 for 30 min. Scale bar, 20 μm. (G) Schematic showing the preincubation paradigm used in H. 50 μM of indicated compounds was added to U2OS cells for 20 min, followed by exposure to 250 μM NaAsO2 stress, followed by fixation and immunofluorescence for G3BP1 and TDP-43. Vehicle and unstressed cells were used as controls. (H) Representative images of immunofluorescence in U2OS cells after 30 min 250 μM NaAsO2. Scale bars, 20 and 3 μm (inset). (I) Representative images of mRuby3-G3BP1 and GFP-TDP-43 signal in U2OS cells after pretreatment with compound followed by 30 min 250 μM NaAsO2. Arrowheads indicate puncta positive for G3BP1 and TDP-43; scale bars, 20 and 3 μm (inset). Error bars represent mean ± SEM in all graphs.
Figure S3.
Figure S3.
G3Ia and G3Ib continue to inhibit the formation of stress granules after 24 h of exposure to compounds. (A) Schematic showing the preincubation paradigm used in B. Indicated doses of the compound were added to cells for 24 h, followed by exposure to 500 μM NaAsO2 stress for 30 min to monitor stress granule formation. (B) Shown are representative images of immunofluorescence staining of additional stress granule markers (eIF3η, PABPC1). Scale bars, 20 μm.
Figure 4.
Figure 4.
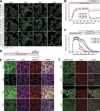
Treatment with G3Ia and G3Ib rapidly dissolves pre-formed stress granules. (A) Representative images of G3BP1-GFP signal in U2OS cells following induction of stress by 250 μM NaAsO2. Images are shown 30 min after induction of stress (immediately before the addition of compound), 32 min after induction of stress (2 min after addition of 50 μM G3I compound), and 40 min after induction of stress (10 min after addition of 50 μM G3I compound). Scale bar, 40 μm. (B) Quantification of cells as in A showing the percentage of stress granule area per cell. (C) Quantification of the percentage of stress granule area per cell throughout heat shock (43°C, 30 min) and recovery (37°C) from U2OS cells stably expressing G3BP1-GFP. Cells were treated with 50 μM G3I compound 25 min after the induction of heat shock. (D) Schematic showing the experimental paradigm used in E and F. U2OS cells stably expressing G3BP1-GFP were exposed to 250 μM NaAsO2 for 30 min followed by the addition of 50 μM G3I compound. Cells were fixed and stained 5 min after compound was added. (E and F) Shown are representative images of immunofluorescence staining of additional stress granule markers (eIF3η, PABPC1, FXR1). Scale bars, 20 μm. Error bars represent mean ± SEM in all graphs.
Figure S4.
Figure S4.
G3I compounds do not alter translation under basal conditions or following sodium arsenite stress. (A) Schematic showing the preincubation paradigm used for pretreatment with 50 μM of indicated G3I compound or vehicle control. Indicated doses of the compound were added to HeLa cells for 15 min, followed by exposure to 500 μM NaAsO2 stress for 30 min. Puromycin (500 μM) was added to the media 15 min following the addition of NaAsO2. Unstressed cells were used to quantify the basal translation rate. (B) Cells were collected and lysed with RIPA buffer followed by SDS-PAGE. Newly synthesized transcripts were visualized by Western blot using an antibody targeting puromycin. Actin was used a loading control. Densitometry from n = 4 blots was used to generate a graph representing puromycin labeling of newly synthesized proteins. Error bars represent mean ± SD. *P < 0.1 and **P = 0.05 by one-way ANOVA with Dunnett’s multiple comparisons test. Source data are available for this figure: SourceData FS4.
Figure S5.
Figure S5.
Treatment with G3Ia prevents the formation of stress granules and dissolves pre-formed stress granules in human iPSC-derived neurons. (A) Schematic showing the paradigm used in B and C. iPSC-derived cortical neurons were treated with 50 μM G3Ia or G3Ia′ in the presence or absence of 500 μM NaAsO2 for 60 min followed by fixation and imaging. (B) Representative images showing stress granules via staining of G3BP1 in cortical neurons in the presence or absence of G3I compounds under baseline or stressed conditions. Scale bars, 20 and 5 μm (inset). (C) Quantification of cells as in B showing the percentage of cells with stress granules under each condition. Error bars represent mean ± SEM. (D) Schematic showing G3BP1-mNeonGreen iPSC-derived neurons exposed to 500 μM NaAsO2 for 30 min, at which point indicated 50 μM G3I compounds were added. Shown are representative images showing live cell imaging of stress granules via mNeonGreen-tagged G3BP1. Scale bars, 10 μm.
Figure 5.
Figure 5.
Treatment with G3I compounds modifies stress granules formed in response to expression of disease-causing mutant proteins. (A) U2OS cells with TdTomato-tagged endogenous G3BP1 (red) were transfected with VCP A232E (green) for 24 h, then treated with 50 μM G3I compound for 30 min. Shown are representative images of cells before (left) and after (right) addition of G3Ia or G3Ia′. Arrows indicate G3BP1-positive puncta. Scale bar, 10 μm. (B) Quantification of cells as in A showing the percentage of stress granule dissolution as assessed by TdTomato imaging. Automated puncta tracking was used for G3Ia; manual blinded cell tracking was used for G3Ib. (C) U2OS cells with TdTomato-tagged endogenous G3BP1 (red) were transfected with FUS R495X (green) for 24 h, then treated with 50 μM G3I compound for 30 min. Shown are representative images of cells before (left) and after (right) the addition of G3Ia or G3Ia′. Arrows indicate G3BP1- or FUS R495X-positive puncta. Scale bar, 10 μm. (D) Quantification of cells as in C showing the percentage of puncta dissolution for G3BP1-positive and FUS R495X-positive puncta. (E and F) U2OS cells with TdTomato-tagged endogenous G3BP1 were pretreated with 50 μM G3I compound or vehicle for 20 min prior to transfection with FUS R495X for 24 h. Using automated analysis pooled from 10 transfected wells per treatment group, the percentage of cytoplasm containing G3BP1 puncta (E) and FUS R495X puncta (F) was quantified in transfected cells. Error bars represent the mean cytoplasmic puncta area per cell ± SEM. *P < 0.1, **P < 0.001 by one-way ANOVA with Dunnett’s multiple comparisons test.

Update of

References

    1. Banani, S.F., Lee H.O., Hyman A.A., and Rosen M.K.. 2017. Biomolecular condensates: Organizers of cellular biochemistry. Nat. Rev. Mol. Cell Biol. 18:285–298. 10.1038/nrm.2017.7 - DOI - PMC - PubMed
    1. Buchan, J.R., Kolaitis R.M., Taylor J.P., and Parker R.. 2013. Eukaryotic stress granules are cleared by autophagy and Cdc48/VCP function. Cell. 153:1461–1474. 10.1016/j.cell.2013.05.037 - DOI - PMC - PubMed
    1. Colombrita, C., Zennaro E., Fallini C., Weber M., Sommacal A., Buratti E., Silani V., and Ratti A.. 2009. TDP-43 is recruited to stress granules in conditions of oxidative insult. J. Neurochem. 111:1051–1061. 10.1111/j.1471-4159.2009.06383.x - DOI - PubMed
    1. Dormann, D., Rodde R., Edbauer D., Bentmann E., Fischer I., Hruscha A., Than M.E., Mackenzie I.R., Capell A., Schmid B., et al. . 2010. ALS-associated fused in sarcoma (FUS) mutations disrupt Transportin-mediated nuclear import. EMBO J. 29:2841–2857. 10.1038/emboj.2010.143 - DOI - PMC - PubMed
    1. Emsley, P., and Cowtan K.. 2004. Coot: Model-building tools for molecular graphics. Acta Crystallogr. D Biol. Crystallogr. 60:2126–2132. 10.1107/S0907444904019158 - DOI - PubMed

Publication types

MeSH terms

LinkOut - more resources