. 2024 Mar;119(3):275-290.
doi: 10.1007/s12185-023-03692-x. Epub 2024 Jan 29.

STAT6 mutations enriched at diffuse large B-cell lymphoma relapse reshape the tumor microenvironment

Affiliations

STAT6 mutations enriched at diffuse large B-cell lymphoma relapse reshape the tumor microenvironment

Alexandre Benoit et al. Int J Hematol. 2024 Mar.

Abstract

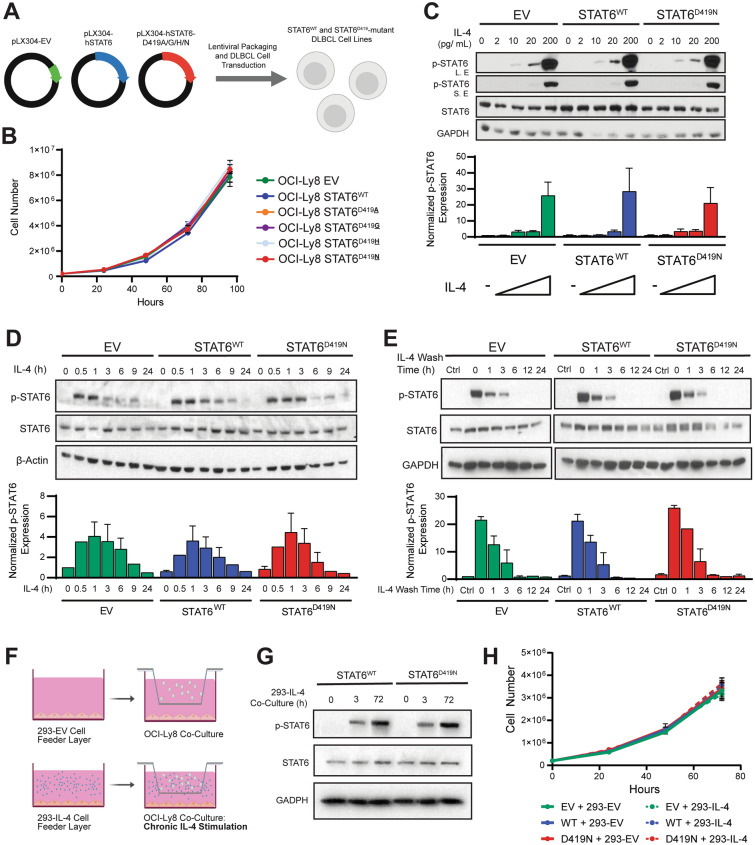
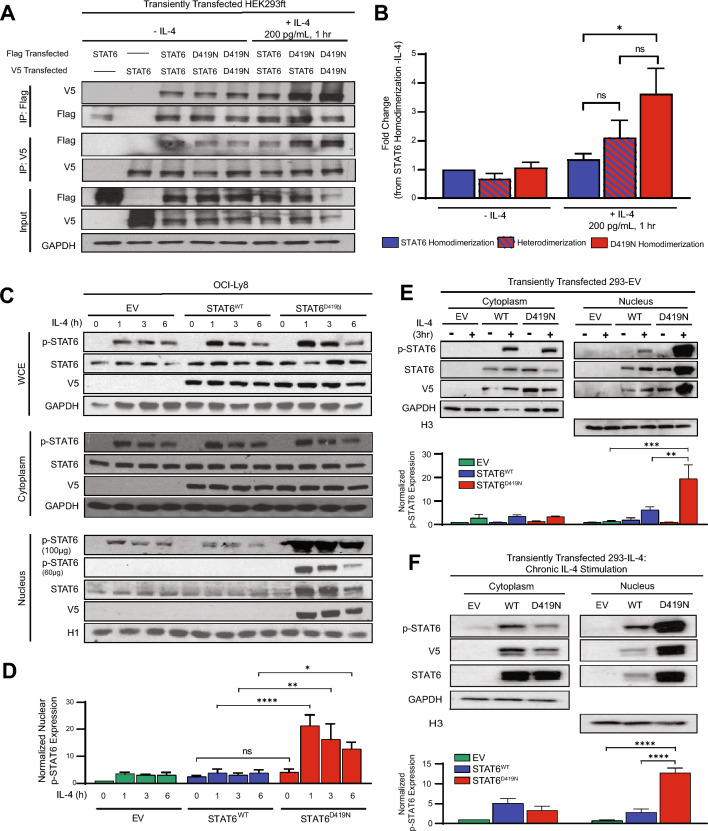
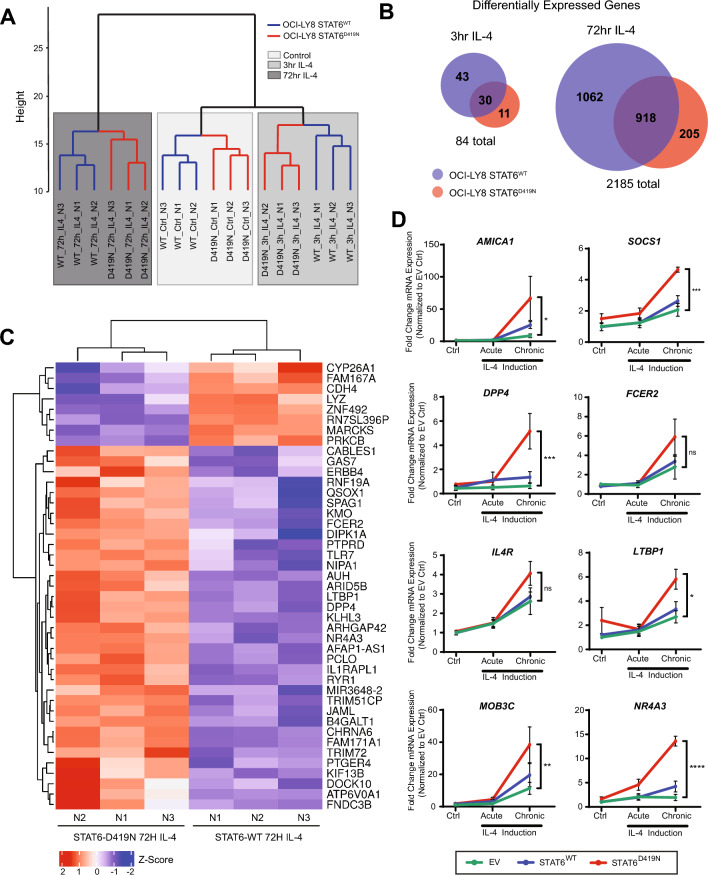
Diffuse large B-cell lymphoma (DLBCL) relapses in approximately 40% of patients following frontline therapy. We reported that STAT6D419 mutations are enriched in relapsed/refractory DLBCL (rrDLBCL) samples, suggesting that JAK/STAT signaling plays a role in therapeutic resistance. We hypothesized that STAT6D419 mutations can improve DLBCL cell survival by reprogramming the microenvironment to sustain STAT6 activation. Thus, we investigated the role of STAT6D419 mutations on DLBCL cell growth and its microenvironment. We found that phospho-STAT6D419N was retained in the nucleus longer than phospho-STAT6WT following IL-4 stimulation, and STAT6D419N recognized a more restricted DNA-consensus sequence than STAT6WT. Upon IL-4 induction, STAT6D419N expression led to a higher magnitude of gene expression changes, but in a more selective list of gene targets compared with STATWT. The most significantly expressed genes induced by STAT6D419N were those implicated in survival, proliferation, migration, and chemotaxis, in particular CCL17. This chemokine, also known as TARC, attracts helper T-cells to the tumor microenvironment, especially in Hodgkin's lymphoma. To this end, in DLBCL, phospho-STAT6+ rrDLBCL cells had a greater proportion of infiltrating CD4+ T-cells than phospho-STAT6- tumors. Our findings suggest that STAT6D419 mutations in DLBCL lead to cell autonomous changes, enhanced signaling, and altered composition of the tumor microenvironment.

Keywords: DLBCL; STAT6; Tumor microenvironment.


Conflict of interest statement

The authors declare no potential conflicts of interest.

Figures

Fig. 1
Fig. 1
STAT6D419 cells have similar response to IL-4 as STAT6WT cells. A Schematic demonstrating the generation of STAT6 mutant DLBCL cell lines. B Growth curve of OCI-Ly8-pLX304 cell lines, expressing empty vector, STAT6WT, or STAT6D419A/G/H/N. Cells were counted once every 24 h for 96 h using a haemocytometer and trypan blue exclusion. Data shown are 4 biological replicates, consisting of 3 technical replicates each. C Representative western blot of 3 biological replicates demonstrating OCI-Ly8 sensitivity to increasing concentrations of IL-4 for 30 min. (S.E: Short exposure; L.E: Long exposure). D Representative western blot of 3 biological replicates demonstrating OCI-Ly8 time course of 200 pg/mL IL-4 stimulation. E Representative western blot of 3 biological replicates demonstrating OCI-Ly8 200 pg/mL IL-4 wash off time course. F Schematic illustrating the OCI-Ly8 and 293-EV/IL-4 co-culture system. G Western blot demonstrating that co-culture with 293-IL-4 induces sustained STAT6 phosphorylation. H Growth curve of OCI-Ly8 cell lines co-cultured with 293-EV or 293-IL-4 for 72 h. Data shown are 4 biological replicates, consisting of 2 technical replicates each. In all cases, bar graphs show densitometry of phospho-STAT6 expression, normalized to GAPDH or β-actin loading control expression
Fig. 2
Fig. 2
Increased presence of STAT6D419N hetero- and homodimers in the nucleus upon IL-4 stimulation. A Representative western blot of 3 biological replicates from co-IP experiments. Lysates used for co-IP were from nuclear fractions. Labelling indicates transfection conditions. “Input” immunoblots are from whole cell extracts, to confirm equal transfection conditions. B Densitometry of Flag IP. Band intensity was normalized to input control, and then represented as fold change in intensity from the STAT6WT homodimerization -IL-4 condition. C Representative western blot of 3 biological replicates from OCI-Ly8-EV, OCI-Ly8-STAT6WT, and OCI-Ly8-STAT6D419N cellular fractions stimulated with 200 pg/mL IL-4 over 6 h. The nuclear fraction shows phospho-STAT6 nuclear accumulation with D419N mutation. D Densitometry of nuclear phospho-STAT6 expression, normalized to H1 loading control expression and expressed as fold change from the EV without IL-4. E, F Representative western blots of 3 biological replicates from cytoplasmic and nuclear cell fractions of transfected 293-EV cells stimulated with IL-4 for 3 h (acute stimulation; E) and transfected 293-IL-4 cells (chronic stimulation; F). Labelling indicates transfection conditions. Bar graphs show densitometry of p-STAT6 expression, normalized to GAPDH or H3 loading control. Bars in the graph are presented corresponding to western blot loading. Statistics on all bar graphs are 2-way ANOVA with multiple comparison (*p < 0.05, ** = p < 0.01, *** = p < 0.005, **** = p < 0.001)
Fig. 3
Fig. 3
STAT6D419N upregulates a restricted set of genes with increased magnitude. A Dendrogram demonstrating that OCI-Ly8-STAT6WT and OCI-Ly8-STAT6D419N groups cluster by IL-4 treatment time. B Venn diagram showing the number of DEGs upon 3 h and 72 h IL-4 treatment. Upon IL-4 treatment, STAT6WT has more unique DEGs than STAT6D419N. C Heatmap showing gene expression differences between STAT6WT and STAT6D419N cells, upon 72 h IL-4 treatment. Blue or red intensity represents Z-score. D qPCR validations of RNAseq data demonstrate that STAT6D419N upregulates transcription of gene targets with increased magnitude. Data consist of 4 biological replicates, with 3 technical replicates each (2way ANOVA; *p < 0.05, ** = p < 0.01, *** = p < 0.005, **** = p < 0.001)
Fig. 4
Fig. 4
STAT6D419N recognizes an altered DNA-consensus motif. A, B Ribbon diagrams showing the DNA-bound conformation of STAT6WT and STAT6D419N. C Molecular dynamic simulations showing STAT6 DNA-binding dynamics. SH2-SH2 shows the distance between SH2 domains measured between their centre of mass, A-DNA shows the distance between one of the D419 residues and the DNA centre of mass (chain A, resID 291), and B-DNA shows the distance between the other D419 residue and the DNA centre of mass (chain B, resID 814), during the process of STAT6WT or STAT6D419N binding to DNA. D Evolution of the number of DNA intermolecular hydrogen bonds and the paired bases ratio along the MD simulation. When purple and orange lines jump from one limit to the other, it denotes a higher ratio of frames without H-bonds and a lower BP-ratio. E Graphical representation of the umbrella sampling study, and Potential of Mean Force (PMF) obtained after umbrella sampling simulations. The distance between SH2-SH2 and DNA was considered as the collective variable under study. Fifty independent simulations were conducted for each STAT6 DNA complex to explore all the molecular states when changing the collective variable from 30 to 80 Å. The overlap in density plots along the coordinate assure the thermodynamic reliability of the study. PMF approximates the free energy landscape when following a coordinate of interest (a.k.a. collective variable). On the right, the PMF involving the DNA unbinding process is shown. F Venn diagram showing the number of identified STAT6-binding sequences identified within proximity of genes upregulated by STAT6WT or STAT6D419N upon 3 h IL-4 treatment. G STAT6WT and STAT6D419N novel consensus motifs, as identified with MEME using STAT6 DNA-binding sequences obtained from GTRD
Fig. 5
Fig. 5
STAT6D419 mutation results in increased CCL17 secretion and increased invasion of CD4 T-Cells. A IPA analysis of RNAseq data showing STAT6D419N cells have enrichment in pathways related to Cell Viability and Cell Migration and Chemotaxis. B qPCR showing CCL17 transcription is increased in STAT6D419N cells upon IL-4 stimulation. Data consist of 4 biological replicates in technical triplicate (2-way ANOVA; ****p < 0.001). C ELISA showing CCL17 secretion is increased in STAT6D419N cells compared to STAT6WT cells upon IL-4 stimulation. Data consists of 3 biological replicates in technical triplicate (2-way ANOVA; **p < 0.01). D CCL17-reporter luciferase assay showing CCL17 transcription is increased 30-fold when STAT6D419N is expressed in 293-IL-4 cells. (RLU: relative luminescence units). E CCL17 expression obtained from gene microarray in GCB rrDLBCL patients who had negative or positive phospho-STAT6 staining (two-tailed unpaired t test; *p < 0.05). Stars indicate the presence of a STAT6D419 mutation. F CCL17 expression obtained from a compendium of RNA sequencing of 598 de novo DLBCL patients and 1 transformed lymphoma patient, comparing CCL17 expression in GCB STAT6WT patients with CCL17 expression in STAT6 non-D419 mutant patients (STAT6Mut) and STAT6D419 mutant patients (1-way ANOVA; **p < 0.01). Of the STAT6Mut patients, 4 were GCB and 2 were ABC. Of the STAT6D419 mutant patients, 9 were GCB and 1 was unclassified GI CD3, CD4, and CD8 staining in GCB rrDLBCL patient biopsies. CD3, CD4, or CD8 staining intensity score was compared between phospho-STAT6 negative and phospho-STAT6 positive patients (scored by a blinded pathologist; 1 = negative staining, 2 = weak staining, 3 = moderate staining, 4 = strong staining). Scale bars below each image indicate 100 µm. Stars indicate the presence of a STAT6D419 mutation. J CCL17 expression obtained from gene microarray in GCB rrDLBCL patients who had low CD4 staining (score 1–2), or high CD4 staining (score 3–4; unpaired t test; ***p < 0.005). Stars indicate the presence of a STAT6D419 mutation
Fig. 6
Fig. 6
Schematic Summary of Data. 1. In STAT6WT and STAT6D419N cells, IL-4 is required for STAT6 activation. 2. Upon activation with IL-4, both STAT6WT and STAT6D419N will dimerize and translocate to the nucleus. 3. However, STAT6D419N has increased nuclear retention as compared to STAT6WT and recognizes an altered DNA-consensus sequence. 4. STAT6D419N has increased transcription of select gene targets, such as CCL17. 5. Increased transcription of CCL17 by STAT6D419N leads to increased production and secretion of CCL17, which functions to recruit CD4+ T-cells

References

    1. Susanibar-Adaniya S, Barta SK. 2021 Update on diffuse large B cell lymphoma: a review of current data and potential applications on risk stratification and management. Am J Hematol. 2021;96(5):617–629. doi: 10.1002/ajh.26151. - DOI - PMC - PubMed
    1. Alizadeh AA, Eisen MB, Davis RE, Ma C, Lossos IS, Rosenwald A, et al. Distinct types of diffuse large B-cell lymphoma identified by gene expression profiling. Nature. 2000;403(6769):503–511. doi: 10.1038/35000501. - DOI - PubMed
    1. Rosenwald A, Wright G, Chan WC, Connors JM, Campo E, Fisher RI, et al. The use of molecular profiling to predict survival after chemotherapy for diffuse large-B-cell lymphoma. N Engl J Med. 2002;346(25):1937–1947. doi: 10.1056/NEJMoa012914. - DOI - PubMed
    1. Wright GW, Huang DW, Phelan JD, Coulibaly ZA, Roulland S, Young RM, et al. A probabilistic classification tool for genetic subtypes of diffuse large B cell lymphoma with therapeutic implications. Cancer Cell. 2020;37(4):551–68.e14. doi: 10.1016/j.ccell.2020.03.015. - DOI - PMC - PubMed
    1. Schmitz R, Wright GW, Huang DW, Johnson CA, Phelan JD, Wang JQ, et al. Genetics and pathogenesis of diffuse large B-cell lymphoma. N Engl J Med. 2018;378(15):1396–1407. doi: 10.1056/NEJMoa1801445. - DOI - PMC - PubMed

MeSH terms