. 2024 Jan 29;44(1):17.
doi: 10.1007/s10571-023-01439-0.

Treadmill Running Regulates Adult Neurogenesis, Spatial and Non-spatial Learning, Parvalbumin Neuron Activity by ErbB4 Signaling

Affiliations

Treadmill Running Regulates Adult Neurogenesis, Spatial and Non-spatial Learning, Parvalbumin Neuron Activity by ErbB4 Signaling

Yandong Yi et al. Cell Mol Neurobiol. .

Abstract

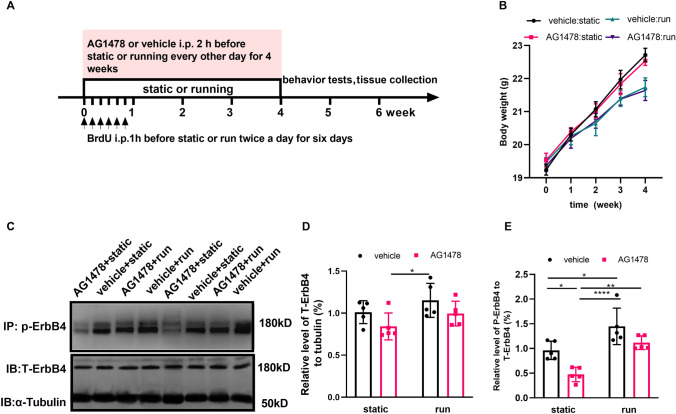
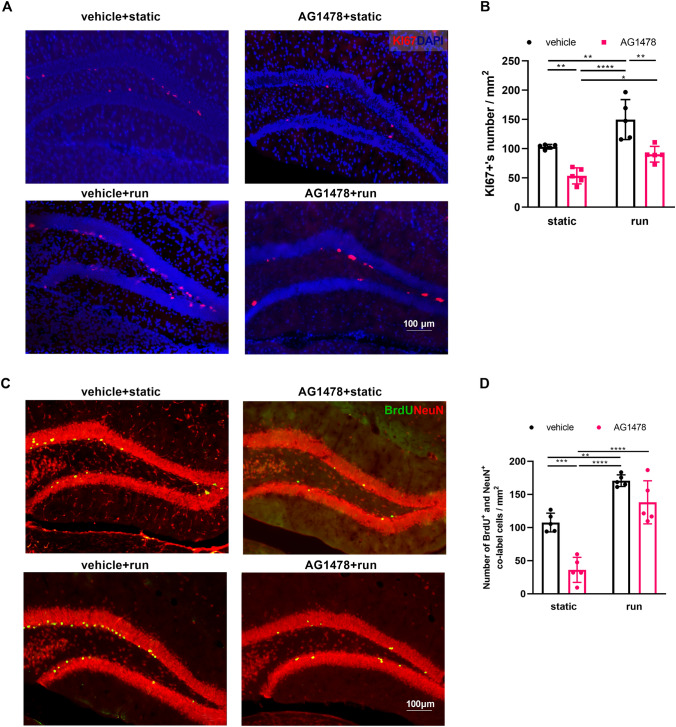
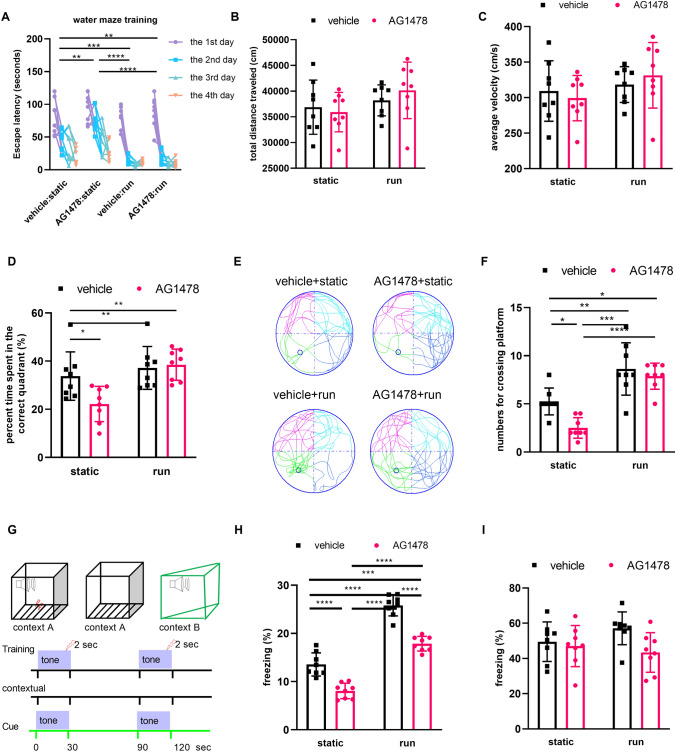
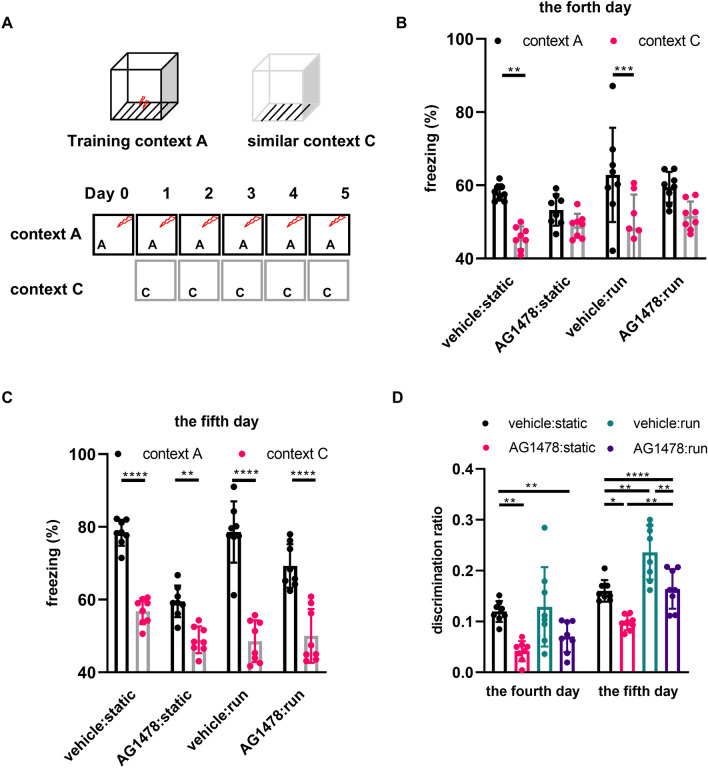
Exercise can promote adult neurogenesis and improve symptoms associated with schizophrenia and other mental disorders via parvalbumin (PV)-positive GABAergic interneurons in the dentate gyrus ErbB4 is the receptor of neurotrophic factor neuregulin 1, expressed mostly in PV-positive interneurons. Whether ErbB4 in PV-positive neurons mediates the beneficial effect of exercise and adult neurogenesis on mental disorder needs to be further investigation. Here, we first conducted a four-week study on the effects of AG1478, an ErbB4 inhibitor, on memory and neurogenesis. AG1478 significantly impaired the performance in several memory tasks, including the T-maze, Morris water maze, and contextual fear conditioning, downregulated the expression of total ErbB4 (T-ErbB4) and the ratio of phosphate-ErbB4 (p-ErbB4) to T-ErbB4, and associated with neurogenesis impairment. Interestingly, AG1478 also appeared to decrease intracellular calcium levels in PV neurons, which could be reversed by exercise. These results suggest exercise may regulate adult neurogenesis and PV neuron activity through ErbB4 signaling. Overall, these findings provide further evidence of the importance of exercise for neurogenesis and suggest that targeting ErbB4 may be a promising strategy for improving memory and other cognitive functions in individuals with mental disorders.

Keywords: AG1478; ErbB4; Fear conditioning; Neurogenesis; Spatial memory; Treadmill running.


Conflict of interest statement

The authors declare that the research was conducted in without any commercial or financial relationships that could be construed as a potential conflict of interest.

Figures

Fig. 1
Fig. 1
AG1478 neutralized treadmill running effect on ErbB4 phosphorylation in the hippocampus. A Schematic experimental design. B The body weight of both the vehicle:run group and AG1478: run group weighs less than the relevant control group (vehicle: static group and AG1478: static group), while AG1478 does not affect it. Data are expressed as mean ± SEM, Three way ANOVA: F (4, 180) = 862.7, p < 0.0001; Tukey’s multiple comparisons test: in the 2nd week: vehilce: static vs. vehicle:run: p = 0.0096, AG1478: static vs. vehicle: run: p = 0.0477, in the 3rd week: vehilce: static vs. vehicle: run: p < 0.0001, AG1478: static vs. AG1478: run: p = 0.0038, AG1478: static vs. vehicle: run: p = 0.0070, in the 4th week: AG1478: static vs. AG1478: run: p < 0.0001, AG1478: static vs. vehicle: run: p < 0.0001, vehicle: static vs. AG1478: run: p < 0.0001, vehicle: static vs. vehicle: run: p < 0.0001, *p < 0.05, ****p < 0.0001. n = 8. C Representative western blots of total ErbB4 and phosphate-ErbB4 in the hippocampus. a-Tubulin was used for normalization. n = 5. D Quantitative analysis of the expression of total ErbB4 in the hippocampus. Two way ANOVA: F (1, 16) = 0.008286, P = 0.9286, Tukey’s multiple comparisons test: AG1478: static vs. vehicle: run: p = 0.0385. E Quantitative analysis of the relative phosphate-ErbB4 level to total ErbB4 in the hippocampus. n = 5, Two way ANOVA: F (1,16) = 0.5757, p = 0.4590, Tukey’s multiple comparisons test: vehicle: static vs. AG1478:static: p = 0.0242, vehicle:static vs. vehicle: run: p = 0.0245, vehicle:run vs. AG1478: static: p < 0.0001, AG1478:static vs. AG1478:run: p = 0.0026
Fig. 2
Fig. 2
AG1478 neutralized treadmill running effect on NSCs survival and proliferation in the DG. A Representative images of Ki67+ cells and DAPI in the DG. Scale bar, 100 μm. B Quantification of Ki67+ cells reveals a significant decrease in their total number in the AG1478: static mice when compared to vehicle: static mice, which are increased by running. Two way ANOVA: F (1, 16) = 0.2847, p = 0.6009, Tukey’s multiple comparisons test: vehicle: static AG1478: static vs. AG1478: static p = 0.0051, vehicle: static vs. vehicle: run: p = 0.0090, AG1478: static vehicle: run vs. AG1478: static: p < 0.0001, AG1478: static vs. AG1478: run: p = 0.0407, AG1478: run vs. vehicle: run: p = 0.0011, **p < 0.01, ****p < 0.0001. n = 5 mice in each group, 5 section per mice. C Representative images of BrdU+ cells and their colocalization with NeuN in the DG. Scale bar, 100 μm. D Quantification of BrdU +NeuN+ cells reveals a significant decrease in the AG1478: static mice when compared to vehicle: static mice, which are increased by running. Two way ANOVA: F (1, 16) = 4.446, p = 0.0511, Tukey’s multiple comparisons test: vehicle:static vs. AG1478: static: p = 0.0003, vehicle: static vs. vehicle: run: p = 0.001, AG1478: static vs. AG1478: run: p < 0.0001, AG1478: static vs. vehicle: run: p < 0.0001, **p < 0.01, ****p < 0.0001. n = 5 mice in each group, 3 section per mice
Fig. 3
Fig. 3
Treadmill running beneficial effect on hyperactivity, but not anxiety neutralized by AG1478. A Representative traces of mice movement during the open field test. Test duration: 5 min. B The total movement distance traveled. Three way ANOVA: F (12, 140) = 0.2786, p = 0.9918, Tukey’s multiple comparisons test: vehicle: static vs. AG1478: static: p = 0.0001, vehicle: static vs. vehicle: run: p = 0.0058, AG1478: static vs. vehicle: run: p < 0.0201, AG1478: static vs. AG1478: run: p < 0.0001. *p < 0.05, ***p < 0.001, ****p < 0.0001. n = 8. C The total movement time travelled. Three way ANOVA: F (1, 28) = 0.08744, p = 0.7696, Tukey’s multiple comparisons test: vehicle: static vs. vehicle: run: p = 0.0010, vehicle: static vs. AG1478: run: p = 0.0001, AG1478: static vs. vehicle: run: p = 0.0201, AG1478: static vs. AG1478: run: p = 0.0031. *p < 0.05, ***p < 0.001, ****p < 0.0001. n = 8. D The percentage of time spent in the center of the field. n = 8. Two way ANOVA: F (1, 28) = 38.61, p < 0.0001, Tukey’s multiple comparisons test: vehicle: static vs. vehicle: run: p < 0.0001, AG1478: static vs. vehicle: run: p < 0.0001, AG1478: static vs. AG1478: run: p < 0.0001. ****p < 0.0001. n = 8. E Schematic illustration of the T-maze test. F The correct percentage of the right arm in the T-maze test. Two way ANOVA: F (1, 28) = 0.6000, p = 0.4451, Tukey’s multiple comparisons test: vehicle: static vs. vehicle: run: p = 0.0022, vehicle: static vs. vehicle: run: p = 0.0003, AG1478: static vs. vehicle: run, p < 0.0001, AG1478: static vs. AG1478: run: p < 0.0001, vehicle: run vs. AG1478: run: p = 0.0326. ***p < 0.001, ****p < 0.0001. n = 8
Fig. 4
Fig. 4
AG1478 partially compromised movement-dependent effect on spatial memory. A The escape latency to find platform of the Morris water maze in the acquisition trial. Three way ANOVA, F (3, 112) = 26.37, p < 0.0001, Tukey’s multiple comparisons test: vehicle: static vs. AG1478: static: p = 0.0038, vehicle: static vs. vehicle: run: p = 0.0002, vehicle: static vs. vehicle: run: p = 0.0020, AG1478: static vs. vehicle: run, p < 0.0001, AG1478: static vs. AG1478: run: p < 0.0001. ***p < 0.001, ****p < 0.0001. n = 8. BD No significantly difference among the four groups of total distance travelled, average velocity for total distance travelled, F (1, 28) = 0.8334, p = 0.3691, for average velocity, F (1, 28) = 0.8334, p = 0.3691, p = 0.411; for the percent time spent in the correct quadrant, n = 8. D The percent time spent in the correct quadrant in the probe trial. Two way ANOVA: F (1, 28) = 4.851, p = 0.0360, vehicle:static vs. AG1478:static: p = 0.0436, AG1478: static vs, vehicle: run: p = 0.0062, AG1478: static vs. AG1478: run: p = 0.0027. *p < 0.05, ***p < 0.001. n = 8. E Swimming trajectory images of the mice in the probe trial. F The number of times crossed the platform in the probe trial. Two way ANOVA: F (1, 28) = 2.597, p = 0.1183, Tukey’s multiple comparisons test: vehicle:static vs. AG1478: static: p = 0.0198, vehicle: static vs. vehicle: run: p = 0.0034, vehicle: static vs. vehicle: run, p = 0.0277, AG1478: static vs.vehicle,: run: p < 0.0001, AG1478: static vs. AG1478: run: p < 0.0001. *p < 0.05, **p < 0.01, ****p < 0.0001. n = 8. G. Schematic experimental design of contextual and cued fear conditioning test. H Freezing levels of the contextual fear conditioning test. n = 8. Two way ANOVA: F (1, 28) = 3.189, p = 0.0850, Tukey’s multiple comparisons test: vehicle: run: p < 0.0001, vehicle: static vs. vehicle: run: p < 0.0001, vehicle: static vs. AG1478: run: p = 0.0008, vehicle: static vs. AG1478: static vs. vehicle: run, p < 0.0001, AG1478: static vs. AG1478: run: p < 0.0001, vehicle: run vs. AG1478: run: p < 0.0001. ****p < 0.0001. n = 8. I Freezing levels of the cued fear conditioning test. Two way ANOVA: F (1, 28) = 2.127, p = 0.1558
Fig. 5
Fig. 5
AG1478 compromised movement-dependent effect on pattern separation. A Mice were tested in a contextual fear discrimination learning paradigm. Briefly, in two similar contexts, foot shook was only present in context A After several trials training in context A and C, mice could discriminate context A but not C as the cue of foot shook tested by freezing. B The fourth day of contextual fear discrimination learning. All mice without AG1478 treatment could discriminate between the context A and context C Two way ANOVA: F (3, 56) = 2.065, p = 0.1152. Tukey’s multiple comparisons test: vehicle:static: p = 0.0011, vehicle: run: p = 0.0001. *p < 0.05, ****p < 0.0001. n = 8. C The fifth day of contextual fear discrimination learning. All mice could discriminate between the context A and context C. Two way ANOVA: F (3, 56) = 8.104, p = 0.0001, Tukey’s multiple comparisons test: vehicle: static: p < 0.0001, AG1478: static: p = 0.0016, vehicle: run: p < 0.0001, AG1478: run: p < 0.0001. ***p < 0.001, ****p < 0.0001. n = 8. D The discrimination ratio indicates that the learning ability of the mice changed along the learning period, AG1478 significantly decrease the discrimination ratio in the AG1478: static group compared to those in the vehicle: static group, which are enhanced by running in the fifth day. TWO way ANOVA: F (3, 56) = 2.439, p = 0.074, Tukey’s multiple comparisons test: in the fourth day: vehicle: static vs. AG1478: static: p = 0.0016, AG1478: static vs. vehicle: run: p = 0.0004, vehicle: run vs. AG1478: run: p = 0.03205 in the fifth day: vehicle: static vs. AG1478: static: p = 0.0172, vehicle: static vs. vehicle: run: p = 0.0023, AG1478: static vs. vehicle: run: p < 0.0001, AG1478: static vs. AG1478: run: p = 0.00908, vehicle: run vs. AG1478: run: p = 0.0042. *p < 0.05, ***p < 0.001, ****p < 0.0001. n = 8
Fig. 6
Fig. 6
Treadmill running effect on pattern separation compromised by AG1478. A Schematic diagram of virus injection into the DG of PV-Cre mice. B Schematic diagram of calcium imaging of brain slices in vitro. The fluorescence intensity of calcium ion signals in the DG region of brain slices was recorded by upright fluorescence microscopy under a patch-clamp perfusion system. C The representative calcium signal of PV neurons changed with time, the upper four cells changed the calcium ion signal under perfusion ACSF condition, and the lower four were under perfusion AG1478 condition. Each horizontal strip corresponds to the time course of the Ca 2+ signal in each cell. D Traces of Ca2+ signals from PV neurons in brain slices from PV-Cre mice with injecting AAV-EF1α-DIO-GCaMP6m-WPRE-hGH-pA, n = 11 - 36 cells from 3 mice. Asterisks in black denote the significance between the ACSF-treated control and AG1478-treated brain slice. E Schematic of in vivo calcium imaging. Embed a GRIN lens onto the mouse head to DG and record real-time calcium signal fluorescence intensity by a head-mounted microscope. F Traces of Ca2+ signals from PV neurons in the DG of PV-Cre mice from the four groups. n = 6-11 cells from 4 mice. G Quantification of ΔF/F. Asterisks in black denote the significance between the control and AG1478-treated brain slice. Data are presented as means ± SEM. *p < 0.05, ****p < 0.0001, 2-tailed Student’s t test (C), Two way ANOVA with Bonferroni’s post hoc test

Similar articles

Cited by

References

    1. Abe Y, Namba H, Zheng Y, Nawa H (2009) In situ hybridization reveals developmental regulation of ErbB1-4 mRNA expression in mouse midbrain: implication of ErbB receptors for dopaminergic neurons. Neuroscience 161:95–110 - PubMed
    1. Albarran-Zeckler RG, Brantley AF, Smith RG (2012) Growth hormone secretagogue receptor (GHS-R1a) knockout mice exhibit improved spatial memory and deficits in contextual memory. Behav Brain Res 232:13–19 - PMC - PubMed
    1. Anacker C, Hen R (2017) Adult hippocampal neurogenesis and cognitive flexibility - linking memory and mood. Nat Rev Neurosci 18:335–346 - PMC - PubMed
    1. Bean JC, Lin TW, Sathyamurthy A, Liu F, Yin DM, Xiong WC, Mei L (2014) Genetic labeling reveals novel cellular targets of schizophrenia susceptibility gene: distribution of GABA and non-GABA ErbB4-positive cells in adult mouse brain. J Neurosci 34:13549–13566 - PMC - PubMed
    1. Berridge MJ, Bootman MD, Roderick HL (2003) Calcium signalling: dynamics, homeostasis and remodelling. Nat Rev Mol Cell Biol 4:517–529 - PubMed

LinkOut - more resources