Position Weight Matrix or Acyclic Probabilistic Finite Automaton: Which model to use? A decision rule inferred for the prediction of transcription factor binding sites
- PMID: 38285430
- PMCID: PMC10945726
- DOI: 10.1590/1678-4685-GMB-2023-0048
Position Weight Matrix or Acyclic Probabilistic Finite Automaton: Which model to use? A decision rule inferred for the prediction of transcription factor binding sites
Abstract
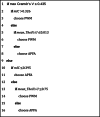
Prediction of transcription factor binding sites (TFBS) is an example of application of Bioinformatics where DNA molecules are represented as sequences of A, C, G and T symbols. The most used model in this problem is Position Weight Matrix (PWM). Notwithstanding the advantage of being simple, PWMs cannot capture dependency between nucleotide positions, which may affect prediction performance. Acyclic Probabilistic Finite Automata (APFA) is an alternative model able to accommodate position dependencies. However, APFA is a more complex model, which means more parameters have to be learned. In this paper, we propose an innovative method to identify when position dependencies influence preference for PWMs or APFAs. This implied using position dependency features extracted from 1106 sets of TFBS to infer a decision tree able to predict which is the best model - PWM or APFA - for a given set of TFBSs. According to our results, as few as three pinpointed features are able to choose the best model, providing a balance of performance (average precision) and model simplicity.
Conflict of interest statement
Figures


Similar articles
-
Jaccard index based similarity measure to compare transcription factor binding site models.Algorithms Mol Biol. 2013 Sep 30;8(1):23. doi: 10.1186/1748-7188-8-23. Algorithms Mol Biol. 2013. PMID: 24074225 Free PMC article.
-
Transcription factor binding sites prediction based on modified nucleosomes.PLoS One. 2014 Feb 21;9(2):e89226. doi: 10.1371/journal.pone.0089226. eCollection 2014. PLoS One. 2014. PMID: 24586611 Free PMC article.
-
Evaluating tools for transcription factor binding site prediction.BMC Bioinformatics. 2016 Nov 2;17(1):547. doi: 10.1186/s12859-016-1298-9. BMC Bioinformatics. 2016. PMID: 27806697 Free PMC article.
-
Position weight matrix, gibbs sampler, and the associated significance tests in motif characterization and prediction.Scientifica (Cairo). 2012;2012:917540. doi: 10.6064/2012/917540. Epub 2012 Oct 23. Scientifica (Cairo). 2012. PMID: 24278755 Free PMC article. Review.
-
[Advances on bioinformatic research in transcription factor binding sites].Yi Chuan. 2009 Apr;31(4):365-73. doi: 10.3724/sp.j.1005.2009.00365. Yi Chuan. 2009. PMID: 19586888 Review. Chinese.
References
-
- Andersson R, Sandelin A. Determinants of enhancer and promoter activities of regulatory elements. Nat Rev Genet. 2019;21:71–87. - PubMed
Internet Resources
-
- [1 July 2020];ENCODE database. ENCODE database , https://www.encodeproject.org .
-
- [1 July 2020];JASPAR database. JASPAR database, https://jaspar.genereg.net/
-
- [27 July 2021];PBM dataset. PBM dataset, https://hugheslab.ccbr.utoronto.ca/supplementary-data/DREAM5/
-
- [10 June 2020];R package ENCODExplorer: A compilation of ENCODE metadata. R package ENCODExplorer: A compilation of ENCODE metadata, https://rdrr.io/bioc/ENCODExplorer/
LinkOut - more resources
Full Text Sources

