. 2024 Jan 29:12:RP88122.
doi: 10.7554/eLife.88122.

Ebola virus sequesters IRF3 in viral inclusion bodies to evade host antiviral immunity

Affiliations

Ebola virus sequesters IRF3 in viral inclusion bodies to evade host antiviral immunity

Lin Zhu et al. Elife. .

Abstract

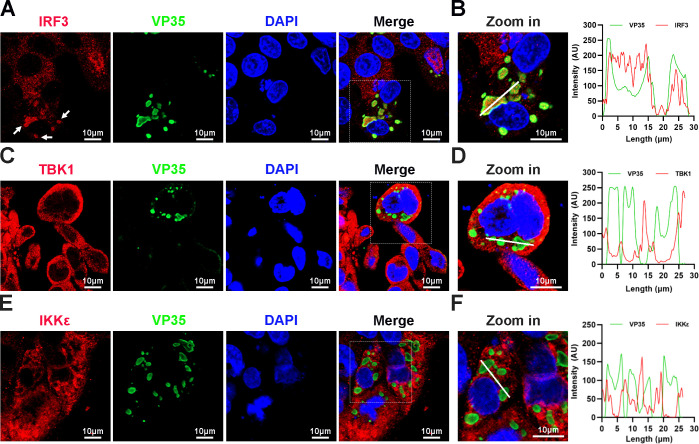
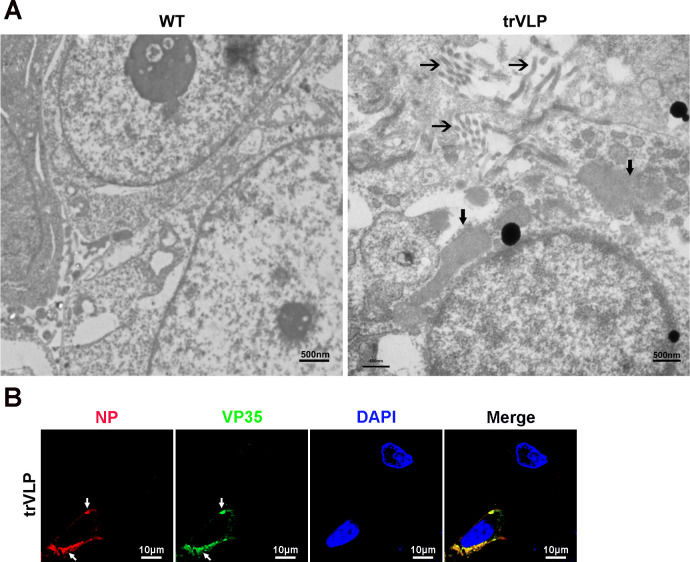
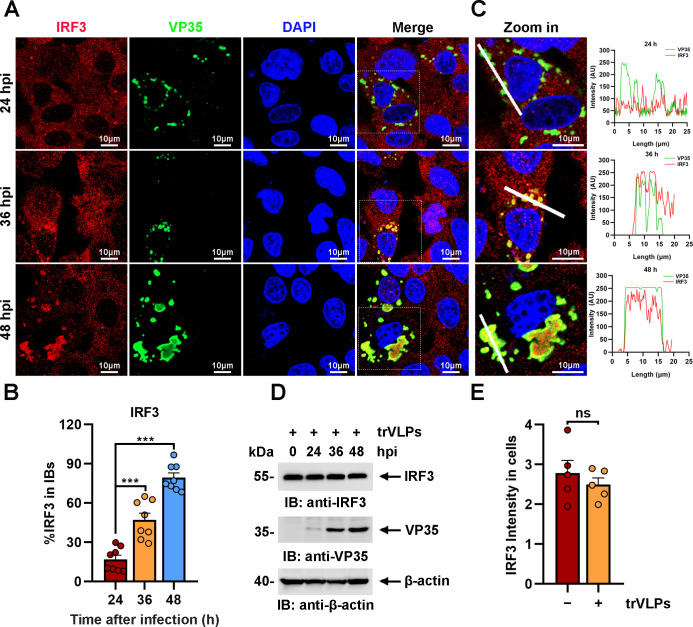
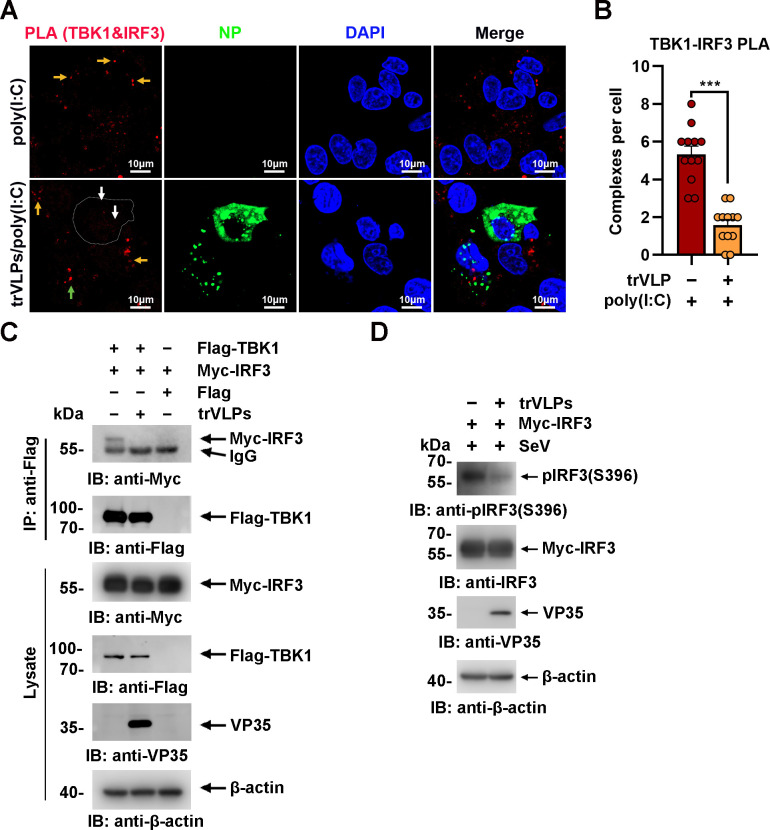
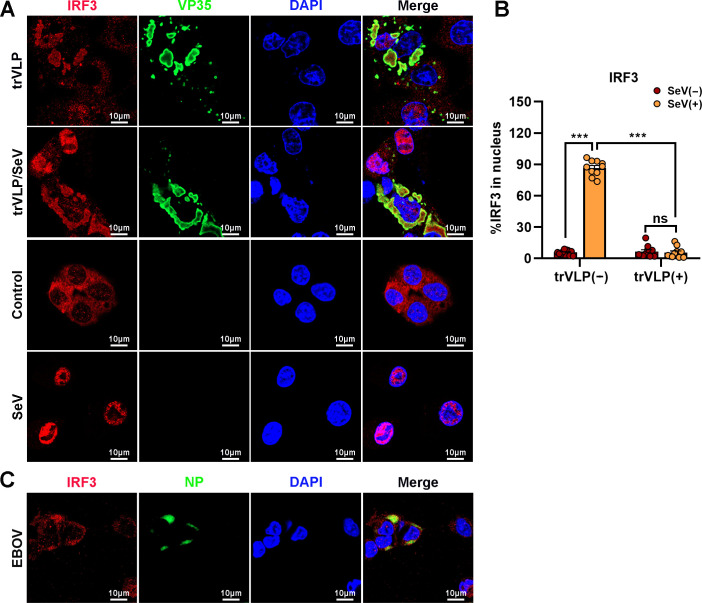
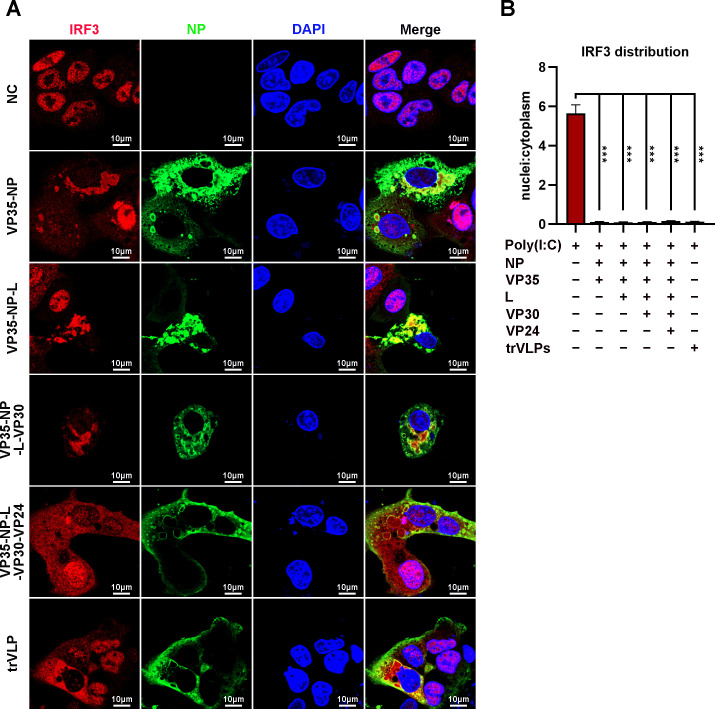
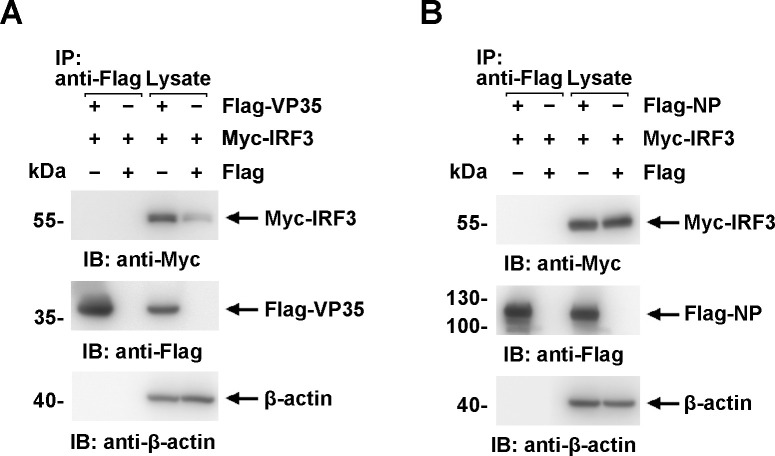
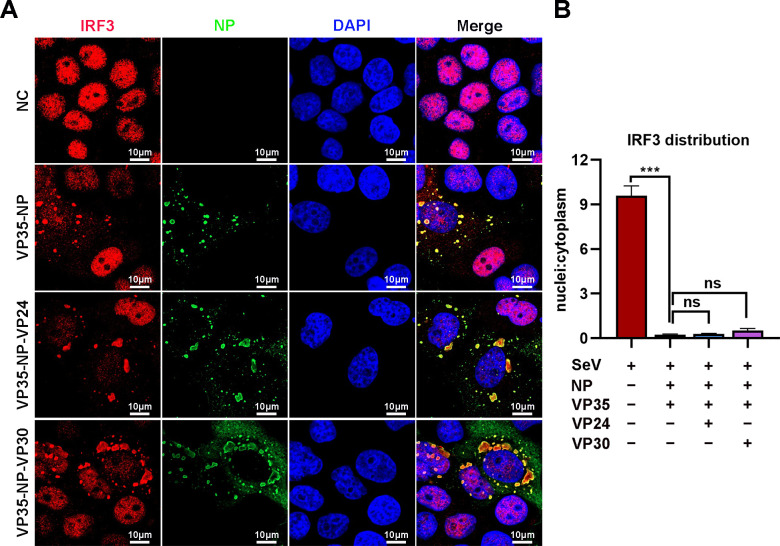
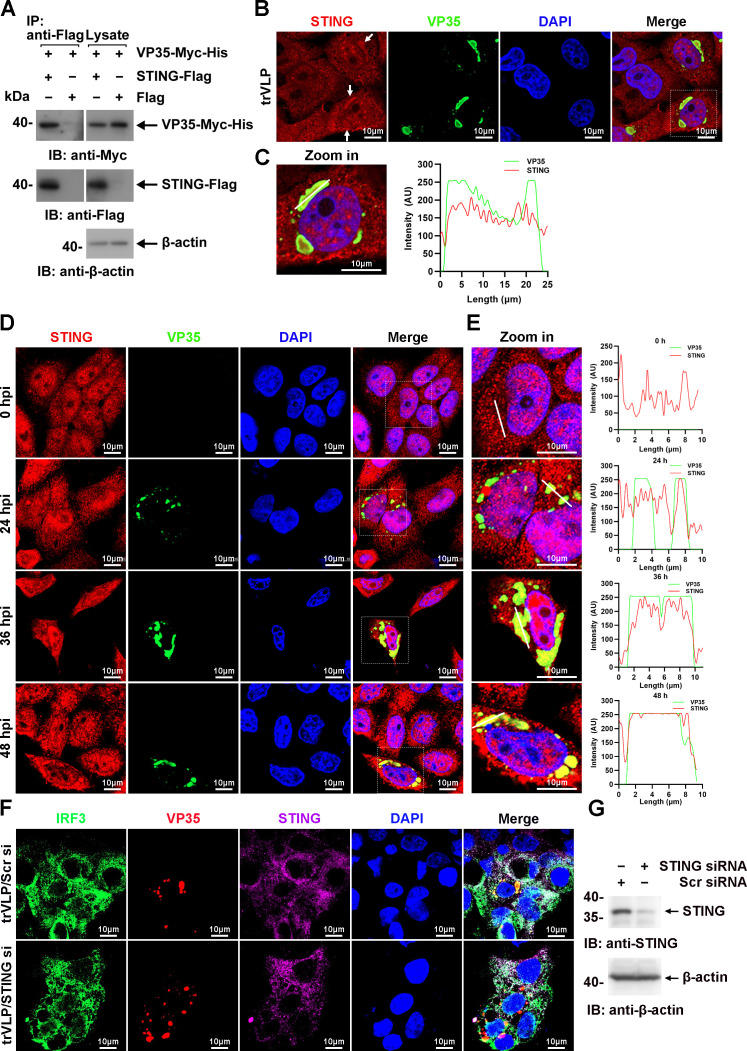
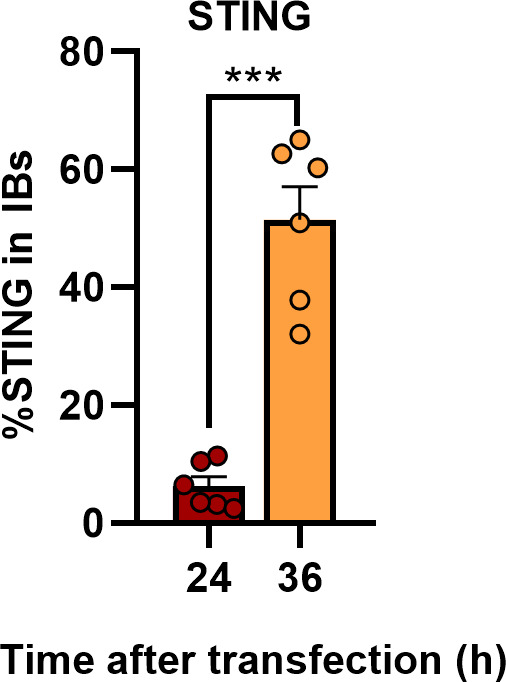
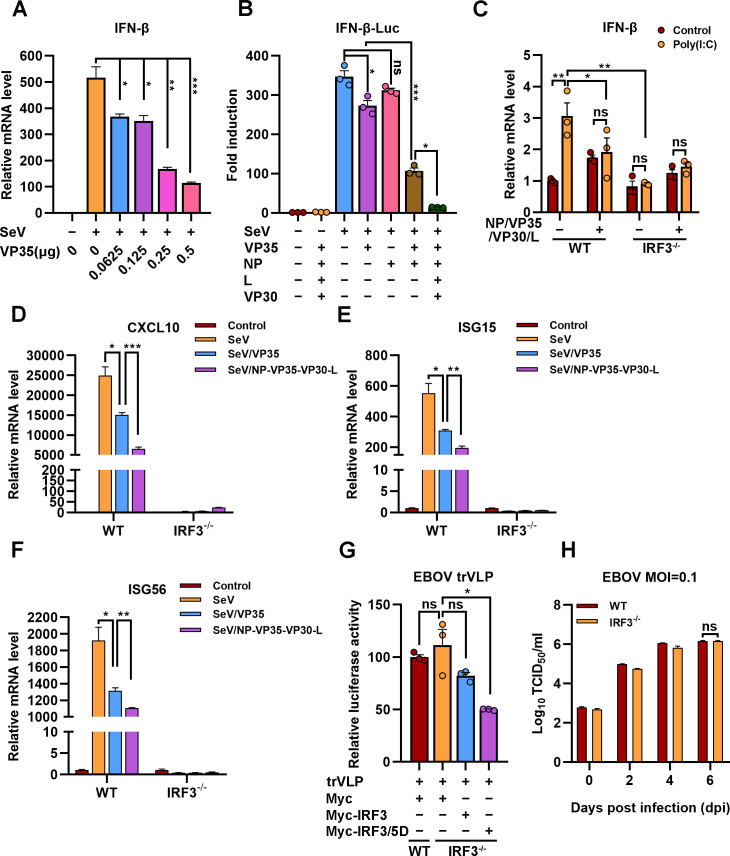
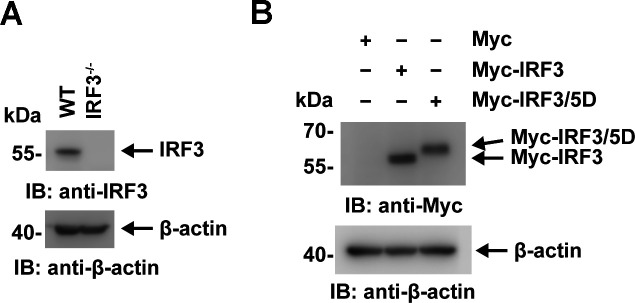
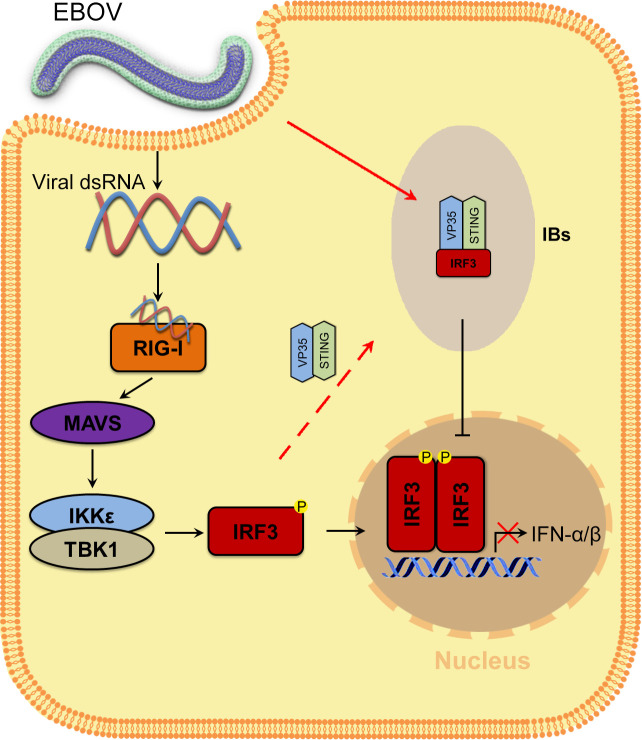
Viral inclusion bodies (IBs) commonly form during the replication of Ebola virus (EBOV) in infected cells, but their role in viral immune evasion has rarely been explored. Here, we found that interferon regulatory factor 3 (IRF3), but not TANK-binding kinase 1 (TBK1) or IκB kinase epsilon (IKKε), was recruited and sequestered in viral IBs when the cells were infected by EBOV transcription- and replication-competent virus-like particles (trVLPs). Nucleoprotein/virion protein 35 (VP35)-induced IBs formation was critical for IRF3 recruitment and sequestration, probably through interaction with STING. Consequently, the association of TBK1 and IRF3, which plays a vital role in type I interferon (IFN-I) induction, was blocked by EBOV trVLPs infection. Additionally, IRF3 phosphorylation and nuclear translocation induced by Sendai virus or poly(I:C) stimulation were suppressed by EBOV trVLPs. Furthermore, downregulation of STING significantly attenuated VP35-induced IRF3 accumulation in IBs. Coexpression of the viral proteins by which IB-like structures formed was much more potent in antagonizing IFN-I than expression of the IFN-I antagonist VP35 alone. These results suggested a novel immune evasion mechanism by which EBOV evades host innate immunity.

Keywords: Ebola virus; VP24; VP35; immunology; infectious disease; inflammation; microbiology; virus inclusion bodies; virus infection; viruses.


Conflict of interest statement

LZ, JJ, TW, YH, HL, TG, QD, YJ, PL, ZL, YH, XL, CC No competing interests declared

Figures

Figure 1.
Figure 1.. Interferon regulatory factor 3 (IRF3), but not TANK-binding kinase 1 (TBK1) and IκB kinase epsilon (IKKε), is sequestered into viral inclusion bodies (IBs) upon Ebola virus (EBOV) transcription- and replication-competent virus-like particles (trVLPs) infection.
(A) HepG2 cells infected with the EBOV trVLPs were immunostained with anti-IRF3 (red) and anti-VP35 (green) antibodies. Nuclei were stained with DAPI (4’,6-diamidino-2phenylindole; blue), and images were obtained using a Zeiss LSM 800 Meta confocal microscope. White arrows: IRF3 in IBs. (B) The left panel shows a magnified image of the IBs boxed in the merged panel of (A). The graphs (right panel) show the fluorescent intensity profiles along the indicated white lines drawn across one or more IBs. (C, E) HepG2 cells infected with the EBOV trVLPs were immunostained with anti-TBK1 (red in (C)) or anti-IKKε (red in (E)) and anti-VP35 (green in (C, E)) antibodies. Nuclei were stained with DAPI (blue), and images were obtained using a Zeiss LSM 800 Meta confocal microscope. Scale bar, 10 μm. (D, F) The left panel shows a magnified image of the IBs boxed in the merged panel shown in (C) and (E). The graphs (right panel) show the fluorescent intensity profiles along the indicated white lines drawn across one or more IBs.
Figure 1—figure supplement 1.
Figure 1—figure supplement 1.. Transmission electron microscopy and immunofluorescence detection of Ebola virus (EBOV) transcription- and replication-competent virus-like particles (trVLPs) and inclusion bodies (IBs).
(A) HepG2 cells infected with or without EBOV trVLPs were fixed and observed with a HITACHI H-7650 transmission electron microscope at an accelerating voltage of 80 kV. The IBs and viral particles (right panel) are marked with bold arrows and regular arrows, respectively. Scale bar, 500 nm. (B) HepG2 cells infected with the EBOV trVLPs were immunostained with anti-NP (red) and anti-VP35 (green) antibodies. Nuclei were stained with DAPI (blue), and images were obtained using a Zeiss LSM 800 Meta confocal microscope. Scale bar, 10 μm.
Figure 2.
Figure 2.. Ebola virus (EBOV) transcription- and replication-competent virus-like particles (trVLPs) induce the recruitment of interferon regulatory factor 3 (IRF3) into intracytoplasmic inclusion bodies (IBs).
(A) HepG2 cells were infected with EBOV trVLPs. At the indicated time points after infection, cells were fixed and immunostained with anti-IRF3 (red) and anti-VP35 (green) antibodies. Nuclei were stained with DAPI (blue), and images were obtained using a Zeiss LSM 800 Meta confocal microscope. Scale bar, 10 μm. The data from two independent replicates are presented. (B) The percentage of IRF3 distribution in IBs at different time points in cells infected with EBOV trVLPs (A) was analyzed using the R programming language. The intensity of IRF3 in eight cells from two independent assays is presented as the mean ± standard error of the mean (SEM; n = 8; ***p < 0.001). (C) The left panel shows a magnified image of the IBs boxed in the merged panel shown in (A). The graphs (right panel) show the fluorescent intensity profiles along the indicated white lines drawn across one or more IBs. (D) IRF3 levels in HepG2 cells infected with EBOV trVLPs were analyzed by immunoblotting with an anti-IRF3 antibody at the indicated hours post infection (hpi). (E) The IRF3 intensity in cells infected with or without EBOV trVLPs for 48 hr (the lower panel of (A)) was analyzed using ImageJ software. Differences between the two groups were evaluated using a two-sided unpaired Student’s t-test. The intensity of IRF3 in five cells from two independent assays is presented as the mean ± SEM (n = 5; ns, not significant).
Figure 3.
Figure 3.. Ebola virus (EBOV) transcription- and replication-competent virus-like particles (trVLPs) inhibit interferon regulatory factor 3 (IRF3) activation.
(A) HepG2 cells were infected with or without the EBOV trVLPs. Thirty-six hours after infection, the cells were treated with or without 5 μg/ml poly(I:C) for 12 hr and then subjected to in situ proximity ligation assay (PLA) with anti-TANK-binding kinase 1 (TBK1) and anti-IRF3 antibodies and immunostaining with an anti-NP antibody (green). Nuclei were stained with DAPI (blue), and images were obtained using a Zeiss LSM 800 Meta confocal microscope. Arrows: white arrows indicate TBK1–IRF3 complexes in trVLP-infected cells, and yellow and green arrows indicate TBK1–IRF3 complexes in uninfected and infected cells with small inclusion bodies (IBs), respectively. Scale bar, 10 μm. (B) The signal for the PLA complex in each cell in (A) was counted from at least 12 cells and is presented as the mean ± standard error of the mean (SEM, ***p<0.001). (C) Lysates of HEK293 cells cotransfected with or without the EBOV minigenome (p0) and the indicated plasmids were subjected to anti-Flag immunoprecipitation and analyzed by immunoblotting. (D) HEK293 cells were cotransfected with or without the EBOV minigenome (p0) and Myc-IRF3 plasmids. Thirty-six hours after transfection, the cells were infected with Sendai virus (SeV) at an MOI (multiplicity of infection) of 2 for 12 hr, and the phosphorylation of IRF3 was analyzed by immunoblotting with an anti-IRF3-S396 antibody.
Figure 4.
Figure 4.. Ebola virus (EBOV) transcription- and replication-competent virus-like particles (trVLPs) inhibit nuclear translocation of interferon regulatory factor 3 (IRF3).
(A) HepG2 cells were infected with or without the EBOV trVLPs for 36 hr, and the cells were infected with or without Sendai virus (SeV) at an MOI of 2 for another 12 hr. The cells were then fixed and immunostained with anti-IRF3 (red) and anti-VP35 (green) antibodies. Nuclei were stained with DAPI (blue), and images were obtained using a Zeiss LSM 800 Meta confocal microscope. Scale bar, 10 μm. (B) The percentage of IRF3 nuclear distribution in (A) was analyzed using ImageJ software. The ratio of IRF3 distribution in ten cells from two independent assays is presented as the mean ± standard error of the mean (SEM; ns, not significant, ***p < 0.001). (C) HepG2 cells infected with live EBOV (MOI = 10) for 72 hr were immunostained with anti-IRF3 (red) and anti-NP (green) antibodies. Nuclei were stained with DAPI (blue), and images were obtained using a Zeiss LSM 800 Meta confocal microscope. Scale bar, 10 μm.
Figure 5.
Figure 5.. Ebola virus (EBOV) nucleoprotein (NP) and virion protein 35 (VP35) play an important role in sequestering interferon regulatory factor 3 (IRF3) into inclusion bodies (IBs).
(A) HepG2 cells were transfected with the indicated plasmids for 36 hr, and the cells were treated with 5 μg/ml poly(I:C) for another 12 hr. Then, the cells were fixed and immunostained with anti-IRF3 (red) and anti-NP (green) antibodies. Nuclei were stained with DAPI (blue), and images were obtained using a Zeiss LSM 800 Meta confocal microscope. Scale bar, 10 μm. (B) The nuclear/cytoplasmic distribution of IRF3 in (A) was analyzed by ImageJ software. Differences between the two groups were evaluated using a two-sided unpaired Student’s t-test. The ratio of IRF3 distribution in at least five cells from two independent assays is presented as the mean ± standard error of the mean (SEM; n = 5; ***p < 0.001).
Figure 5—figure supplement 1.
Figure 5—figure supplement 1.. Neither virion protein 35 (VP35) nor nucleoprotein (NP) interacts directly with interferon regulatory factor 3 (IRF3) in cells.
(A, B) Lysates of HEK293 cells transfected with the indicated plasmids were subjected to anti-Flag immunoprecipitation and analyzed by immunoblotting. The data from two independent replicates are presented.
Figure 5—figure supplement 2.
Figure 5—figure supplement 2.. Neither VP24 nor VP30 plays an important role in sequestering interferon regulatory factor 3 (IRF3) into inclusion bodies (IBs).
(A) HepG2 cells were transfected with the indicated plasmids for 36 hr, and the cells were infected with Sendai virus (SeV) at an MOI of 2 for another 12 hr. The cells were then fixed and immunostained with anti-IRF3 (red) and anti-NP (green) antibodies. Nuclei were stained with DAPI (blue), and images were obtained using a Zeiss LSM 800 Meta confocal microscope. Scale bar, 10 μm. (B) The nuclear/cytoplasmic distribution of IRF3 in (A) was analyzed using ImageJ software. Differences between the two groups were evaluated using a two-sided unpaired Student’s t-test. The ratio of IRF3 distribution in at least five cells from two independent assays is presented as the mean ± standard error of the mean (SEM; n = 5; ns, not significant, ***p < 0.001).
Figure 6.
Figure 6.. Ebola virus (EBOV) transcription- and replication-competent virus-like particles (trVLPs) recruit interferon regulatory factor 3 (IRF3) into viral inclusion bodies (IBs) via STING.
(A) Lysates of HEK293 cells transfected with the indicated plasmids were subjected to anti-Flag immunoprecipitation and analyzed by immunoblotting. (B) HepG2 cells were transfected with the EBOV minigenome (p0). Forty-eight hours after infection, the cells were fixed and immunostained with anti-STING (red) and anti-VP35 (green) antibodies. White arrows: STING in IBs. Nuclei were stained with DAPI (blue), and images were obtained using a Zeiss LSM 800 Meta confocal microscope. Scale bar, 10 μm. (C) The left panel shows a magnified image of the IBs boxed in the merged panel of (B). The graphs (right panel) show the fluorescent intensity profiles along the indicated white lines drawn across one or more IBs. (D) HepG2 cells were infected with the EBOV trVLPs. At the indicated hours post infection (hpi), cells were fixed and immunostained with anti-STING (red) and anti-VP35 (green) antibodies. Nuclei were stained with DAPI (blue), and images were obtained using a Zeiss LSM 800 Meta confocal microscope. Scale bar, 10 μm. The data from two independent replicates are presented. (E) The left panel shows a magnified image of the IBs boxed in the merged panel of (D). The graphs (right panel) show fluorescent intensity profiles along the indicated white lines drawn across one or more IBs. (F, G) HepG2 cells were transfected with STING siRNA (STING si) or scrambled siRNA (Scr si) for 6 hr. The cells were then infected with the EBOV trVLPs for 36 hr and then immunostained with Fluor 488-conjugated-anti-IRF3 (green), anti-VP35 (red), and anti-STING (purple) antibodies. Nuclei were stained with DAPI (blue), and images were obtained using a Zeiss LSM 800 Meta confocal microscope. Scale bar, 10 μm. The silencing efficiency of STING siRNA was determined by immunoblotting (G).
Figure 6—figure supplement 1.
Figure 6—figure supplement 1.. Ebola virus (EBOV) transcription- and replication-competent virus-like particles (trVLPs) recruit STING into viral inclusion bodies (IBs).
The percentage of STING distribution in IBs at different time points in cells infected with EBOV trVLPs in Figure 6D was analyzed with R programming language. The intensity of STING in six cells from two independent assays is presented as the mean ± standard error of the mean (SEM; n = 6; ***p < 0.001).
Figure 7.
Figure 7.. The hijacking of interferon regulatory factor 3 (IRF3) by viral inclusion bodies (IBs) inhibits IFN-β production.
(A) HEK293 cells were transfected with the indicated plasmids for 24 hr, and the cells were infected with or without Sendai virus (SeV) at an MOI of 2 for another 12 hr. The mRNA level of IFN-β was quantified by quantitative RT-PCR (qRT-PCR). Differences between the two groups were evaluated by a two-sided unpaired Student’s t-test. The data are presented as the means  ± standard error of the mean (SEM; n=3; *p < 0.05, **p < 0.01, ***p < 0.001). (B) HEK293 cells were cotransfected with the firefly luciferase reporter plasmid pGL3-IFN-β-Luc, the Renilla luciferase control plasmid pRL-TK, and viral protein expression plasmids (0.0625 μg of pCAGGS-NP, 0.0625 μg of pCAGGS-VP35, 0.0375 μg of pCAGGS-VP30, and 0.5 μg of pCAGGS-L) for 24 hr, and the cells were infected with or without SeV at an MOI of 2 for another 12 hr. The luciferase activities were then analyzed. The data were analyzed to determine the fold induction by normalizing the firefly luciferase activity to the Renilla luciferase activity. Empty plasmid without SeV infection was used as a control, and the corresponding data point was set to 100%. Differences between the two groups were evaluated using a two-sided unpaired Student’s t-test. The data are presented as the means ± SEM (n=3; ns, not significant, *p < 0.05, ***p < 0.001). (C) Wild-type (WT) and IRF3-depleted (IRF3−/−) HeLa cells were transfected with or without pCASSG-NP, pCASSG-VP35, pCASSG-VP30, and pCASSG-L plasmids for 36 hr and then treated with or without 5 μg/ml poly(I:C) for 12 hr. The mRNA level of IFN-β was quantified by qRT-PCR. Differences between the two groups were evaluated using a two-sided unpaired Student’s t-test. The data are presented as the means ± SEM (n=3; ns, not significant, *p < 0.05). (D–F) Wild-type (WT) and IRF3-depleted (IRF3−/−) HeLa cells were transfected with or without pCAGGS-VP35 or pCASSG-NP, pCASSG-VP35, pCASSG-VP30, and pCASSG-L plasmids for 36 hr, and the cells were infected with or without SeV at an MOI of 5 for another 12 hr. The mRNA level of CXCL10 (D), ISG15 (E), and ISG56 (F) was quantified by qRT-PCR. Differences between the two groups were evaluated using a two-sided unpaired Student’s t-test. The data are presented as the means ± SEM (n=3; *p < 0.05, **p < 0.01, ***p < 0.001). (G) Wild-type (WT) and IRF3-knockout (IRF3−/−) HeLa cells were transfected with the Ebola virus (EBOV) minigenome (p0), pGL3-promoter and Myc-vector, Myc-IRF3 or Myc-IRF3/5D plasmids for 96 hr. The amounts of transcription- and replication-competent virus-like particles (trVLPs) were determined by a luciferase activity assay (left panel). Differences between the two groups were evaluated by a two-sided unpaired Student’s t-test. The data are presented as the means ± SEM (n=3; ns, not significant, ***p < 0.001). (H) Wild-type (WT) and IRF3-knockout (IRF3−/−) HeLa cells were infected with live EBOV (MOI = 0.1). The cell culture supernatants were collected on the indicated days post infection (dpi), and the viral titers were quantified as TCID50 by a plaque assay. Differences between the two groups were evaluated using a two-sided unpaired Student’s t-test. The data are presented as the means ± SEM (n=3; ns, not significant).
Figure 7—figure supplement 1.
Figure 7—figure supplement 1.. The expression of interferon regulatory factor 3 (IRF3) and its mutants were detected by immunoblotting.
(A) Lysates of WT and IRF3−/− HeLa cells were analyzed by immunoblotting with an anti-IRF3 antibody. (B) Lysates of HeLa cells transfected with Myc-vector, Myc-IRF3 or Myc-IRF3/5D were analyzed by immunoblotting with the indicated antibodies.
Figure 8.
Figure 8.. Model of the molecular mechanism by which EBOV hijacks IRF3 into viral IBs through VP35-STING to comprehensively disrupt IFN-I production.
VP35 sequesters IRF3 to EBOV IBs, which in turn spatially segregates IRF3 from TANK-binding kinase 1 (TBK1) and IκB kinase epsilon (IKKε), blocks RLR signaling and inhibits IFN-I production.

Update of

  • doi: 10.1101/2023.04.20.537734
  • doi: 10.7554/eLife.88122.1
  • doi: 10.7554/eLife.88122.2

Similar articles

Cited by

References

    1. Audet J, Kobinger GP. Immune evasion in ebolavirus infections. Viral Immunology. 2015;28:10–18. doi: 10.1089/vim.2014.0066. - DOI - PubMed
    1. Basler CF, Wang X, Mühlberger E, Volchkov V, Paragas J, Klenk HD, García-Sastre A, Palese P. The Ebola virus VP35 protein functions as a type I IFN antagonist. PNAS. 2000;97:12289–12294. doi: 10.1073/pnas.220398297. - DOI - PMC - PubMed
    1. Basler CF, Mikulasova A, Martinez-Sobrido L, Paragas J, Mühlberger E, Bray M, Klenk HD, Palese P, García-Sastre A. The Ebola virus VP35 protein inhibits activation of interferon regulatory factor 3. Journal of Virology. 2003;77:7945–7956. doi: 10.1128/jvi.77.14.7945-7956.2003. - DOI - PMC - PubMed
    1. Basler CF. Innate immune evasion by filoviruses. Virology. 2015;479–480:122–130. doi: 10.1016/j.virol.2015.03.030. - DOI - PMC - PubMed
    1. Bhattacharyya S. Mechanisms of immune evasion by Ebola virus. Advances in Experimental Medicine and Biology. 2021;1313:15–22. doi: 10.1007/978-3-030-67452-6_2. - DOI - PubMed