

A Novel Approach for the Early Detection of Medical Resource Demand Surges During Health Care Emergencies: Infodemiology Study of Tweets
- PMID: 38285495
- PMCID: PMC10862249
- DOI: 10.2196/46087
A Novel Approach for the Early Detection of Medical Resource Demand Surges During Health Care Emergencies: Infodemiology Study of Tweets
Abstract
Background: The COVID-19 pandemic has highlighted gaps in the current handling of medical resource demand surges and the need for prioritizing scarce medical resources to mitigate the risk of health care facilities becoming overwhelmed.
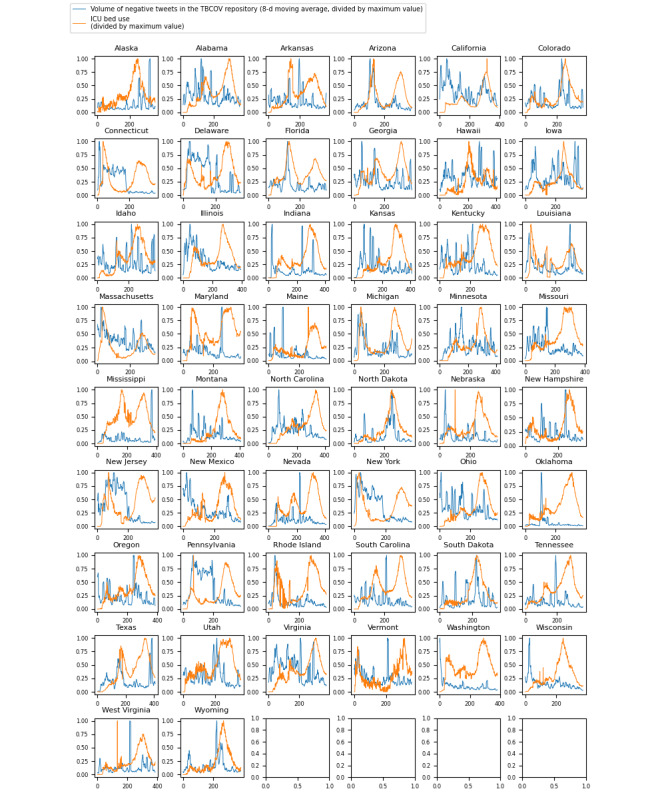
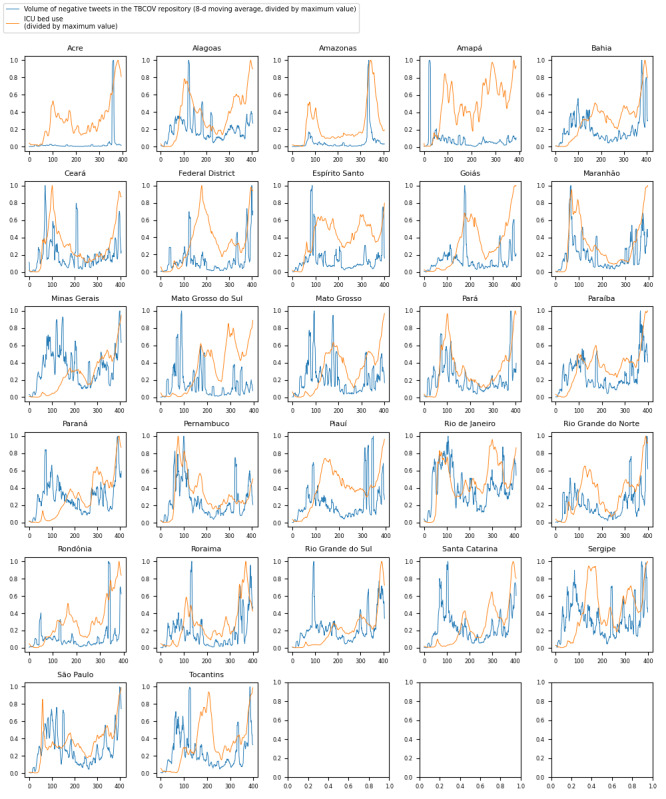
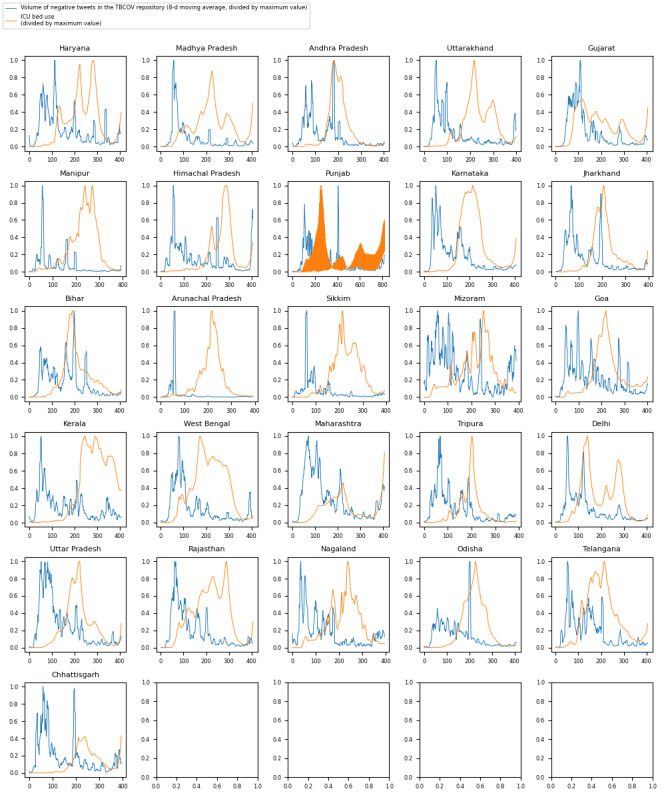
Objective: During a health care emergency, such as the COVID-19 pandemic, the public often uses social media to express negative sentiment (eg, urgency, fear, and frustration) as a real-time response to the evolving crisis. The sentiment expressed in COVID-19 posts may provide valuable real-time information about the relative severity of medical resource demand in different regions of a country. In this study, Twitter (subsequently rebranded as X) sentiment analysis was used to investigate whether an increase in negative sentiment COVID-19 tweets corresponded to a greater demand for hospital intensive care unit (ICU) beds in specific regions of the United States, Brazil, and India.
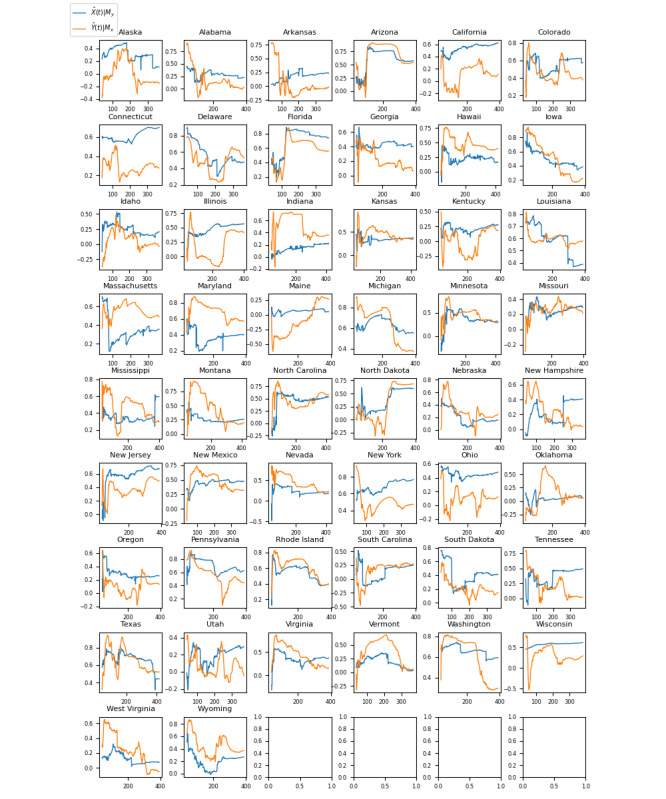
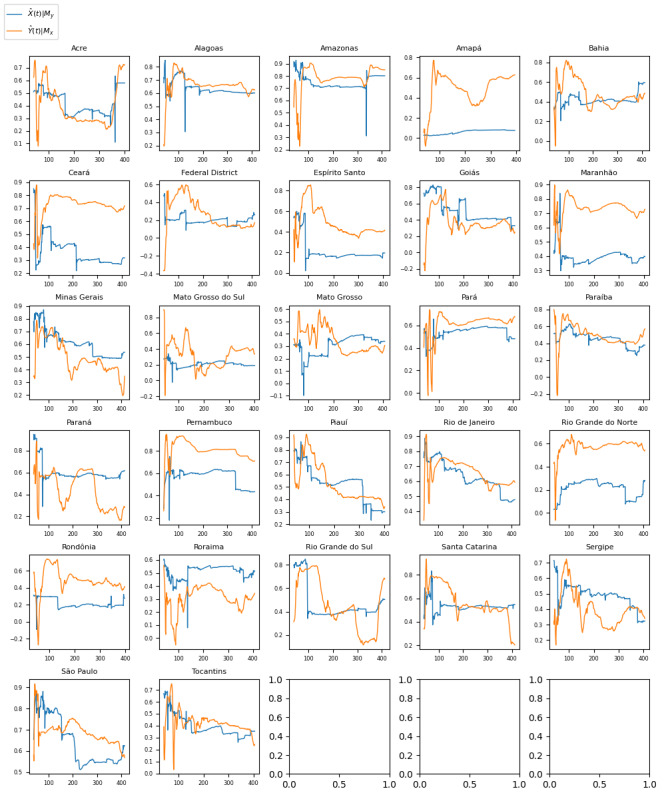
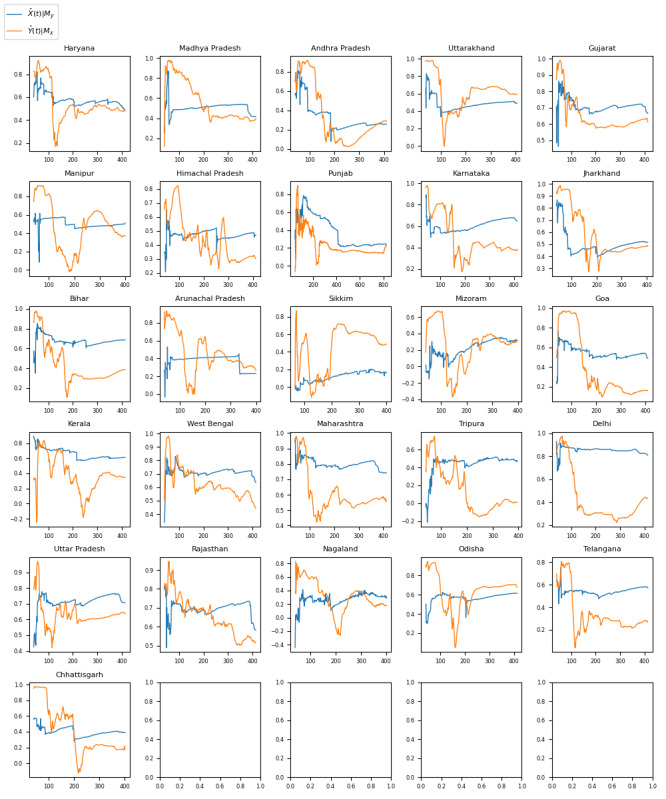
Methods: Tweets were collected from a publicly available data set containing COVID-19 tweets with sentiment labels and geolocation information posted between February 1, 2020, and March 31, 2021. Regional medical resource shortage data were gathered from publicly available data sets reporting a time series of ICU bed demand across each country. Negative sentiment tweets were analyzed using the Granger causality test and convergent cross-mapping (CCM) analysis to assess the utility of the time series of negative sentiment tweets in forecasting ICU bed shortages.
Results: For the United States (30,742,934 negative sentiment tweets), the results of the Granger causality test (for whether negative sentiment COVID-19 tweets forecast ICU bed shortage, assuming a stochastic system) were significant (P<.05) for 14 (28%) of the 50 states that passed the augmented Dickey-Fuller test at lag 2, and the results of the CCM analysis (for whether negative sentiment COVID-19 tweets forecast ICU bed shortage, assuming a dynamic system) were significant (P<.05) for 46 (92%) of the 50 states. For Brazil (3,004,039 negative sentiment tweets), the results of the Granger causality test were significant (P<.05) for 6 (22%) of the 27 federative units, and the results of the CCM analysis were significant (P<.05) for 26 (96%) of the 27 federative units. For India (4,199,151 negative sentiment tweets), the results of the Granger causality test were significant (P<.05) for 6 (23%) of the 26 included regions (25 states and the national capital region of Delhi), and the results of the CCM analysis were significant (P<.05) for 26 (100%) of the 26 included regions.
Conclusions: This study provides a novel approach for identifying the regions of high hospital bed demand during a health care emergency scenario by analyzing Twitter sentiment data. Leveraging analyses that take advantage of natural language processing-driven tweet extraction systems has the potential to be an effective method for the early detection of medical resource demand surges.
Keywords: COVID-19; Granger; ICU bed; Twitter; causal analysis; convergent cross-mapping; global health; intensive care unit bed; medical supply shortage; pandemic; social media.
©Mahakprit Kaur, Taylor Cargill, Kevin Hui, Minh Vu, Nicola Luigi Bragazzi, Jude Dzevela Kong. Originally published in JMIR Formative Research (https://formative.jmir.org), 29.01.2024.
Conflict of interest statement
Conflicts of Interest: None declared.
Figures
Similar articles
-
Using Twitter to Examine Web-Based Patient Experience Sentiments in the United States: Longitudinal Study.J Med Internet Res. 2018 Oct 12;20(10):e10043. doi: 10.2196/10043. J Med Internet Res. 2018. PMID: 30314959 Free PMC article.
-
Pediatric Cancer Communication on Twitter: Natural Language Processing and Qualitative Content Analysis.JMIR Cancer. 2024 May 7;10:e52061. doi: 10.2196/52061. JMIR Cancer. 2024. PMID: 38713506 Free PMC article.
-
Using Natural Language Processing to Explore "Dry January" Posts on Twitter: Longitudinal Infodemiology Study.J Med Internet Res. 2022 Nov 18;24(11):e40160. doi: 10.2196/40160. J Med Internet Res. 2022. PMID: 36343184 Free PMC article.
-
An augmented multilingual Twitter dataset for studying the COVID-19 infodemic.Soc Netw Anal Min. 2021;11(1):102. doi: 10.1007/s13278-021-00825-0. Epub 2021 Oct 20. Soc Netw Anal Min. 2021. PMID: 34697560 Free PMC article. Review.
-
Fast tracking intensive care units and operation rooms during the COVID-19 pandemic in resource limited settings.J Anaesthesiol Clin Pharmacol. 2020 Aug;36(Suppl 1):S7-S14. doi: 10.4103/joacp.JOACP_262_20. Epub 2020 Jul 31. J Anaesthesiol Clin Pharmacol. 2020. PMID: 33100639 Free PMC article. Review.
References
-
- Zhu G, Chou MC, Tsai CW. Lessons learned from the COVID-19 pandemic exposing the shortcomings of current supply chain operations: a long-term prescriptive offering. Sustainability. 2020 Jul 21;12(14):5858. doi: 10.3390/su12145858. - DOI
-
- Srinivas G, Maanasa R, Meenakshi M, Adaikalam JM, Seshayyan S, Muthuvel T. Ethical rationing of healthcare resources during COVID-19 outbreak: review. Ethics Med Public Health. 2021 Mar;16:100633. doi: 10.1016/j.jemep.2021.100633. https://europepmc.org/abstract/MED/33585668 S2352-5525(21)00010-4 - DOI - PMC - PubMed
LinkOut - more resources
Full Text Sources
