. 2024 Jan 26;16(2):1002-1020.
doi: 10.18632/aging.205503. Epub 2024 Jan 26.

Epigenetic drift underlies epigenetic clock signals, but displays distinct responses to lifespan interventions, development, and cellular dedifferentiation

Affiliations

Epigenetic drift underlies epigenetic clock signals, but displays distinct responses to lifespan interventions, development, and cellular dedifferentiation

Emily M Bertucci-Richter et al. Aging (Albany NY). .

Abstract

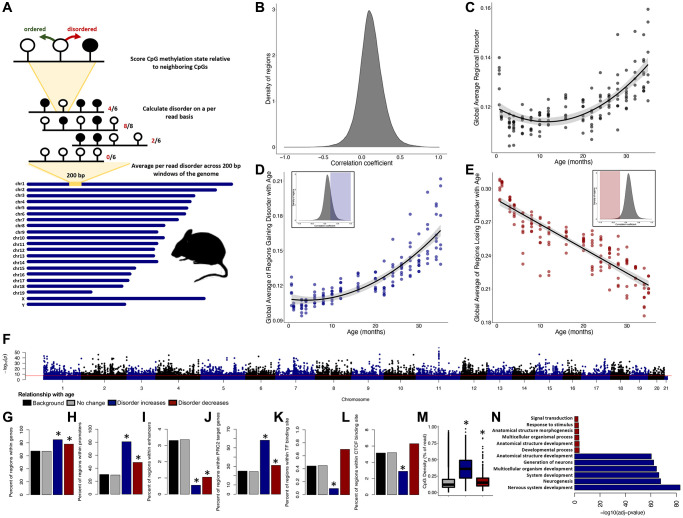
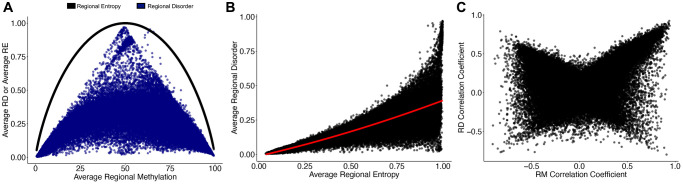
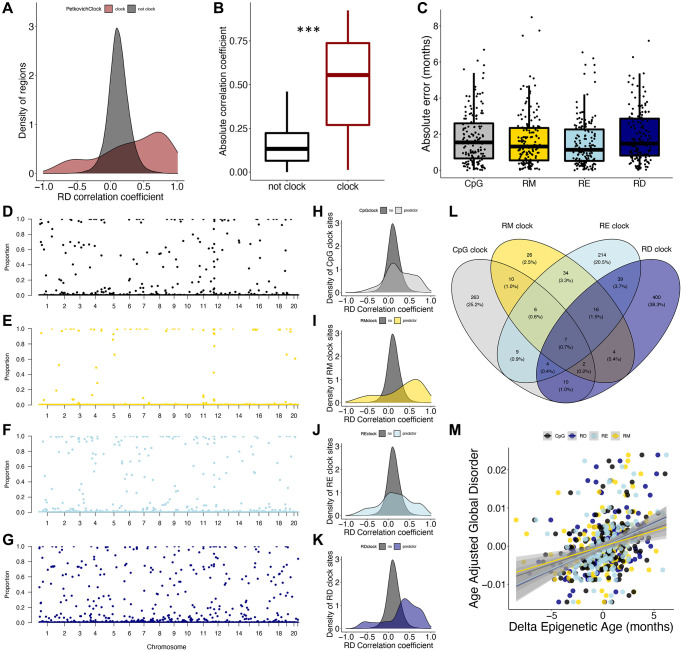
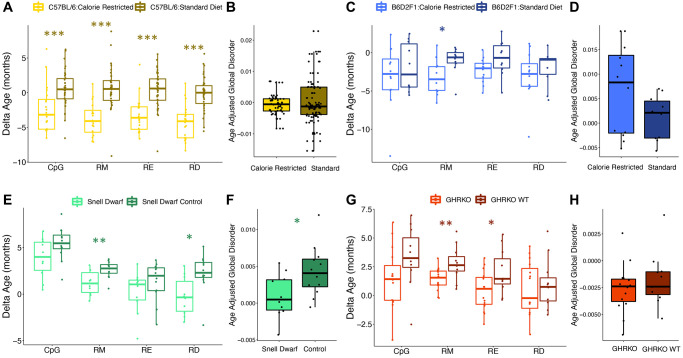
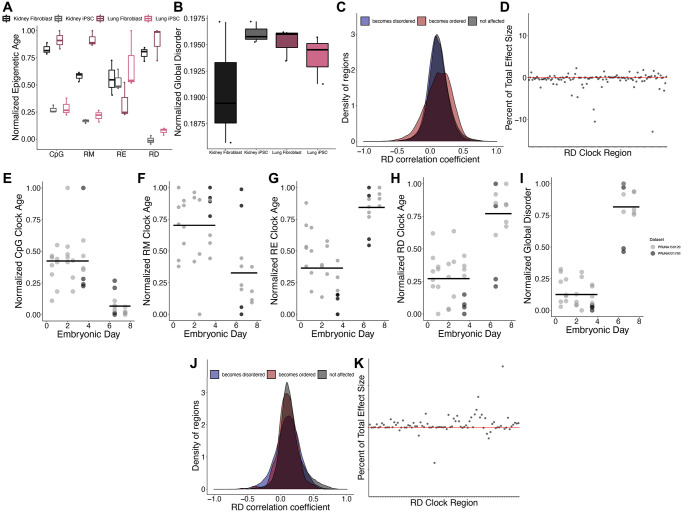
Changes in DNA methylation with age are observed across the tree of life. The stereotypical nature of these changes can be modeled to produce epigenetic clocks capable of predicting chronological age with unprecedented accuracy. Despite the predictive ability of epigenetic clocks and their utility as biomarkers in clinical applications, the underlying processes that produce clock signals are not fully resolved, which limits their interpretability. Here, we develop a computational approach to spatially resolve the within read variability or "disorder" in DNA methylation patterns and test if age-associated changes in DNA methylation disorder underlie signals comprising epigenetic clocks. We find that epigenetic clock loci are enriched in regions that both accumulate and lose disorder with age, suggesting a link between DNA methylation disorder and epigenetic clocks. We then develop epigenetic clocks that are based on regional disorder of DNA methylation patterns and compare their performance to other epigenetic clocks by investigating the influences of development, lifespan interventions, and cellular dedifferentiation. We identify common responses as well as critical differences between canonical epigenetic clocks and those based on regional disorder, demonstrating a fundamental decoupling of epigenetic aging processes. Collectively, we identify key linkages between epigenetic disorder and epigenetic clocks and demonstrate the multifaceted nature of epigenetic aging in which stochastic processes occurring at non-random loci produce predictable outcomes.

Keywords: DNA methylation; epigenetic aging; epigenetic drift; epigenetic rejuvenation; lifespan.


Conflict of interest statement

CONFLICTS OF INTEREST: The authors declare no conflicts of interest related to this study.

Figures

Figure 1
Figure 1
Epigenetic disorder increases across the murine lifespan. (A) Diagram of the approach for measuring regional disorder (RD). (B) Density of all genomic regions assessed with respect to their Spearman correlation coefficients between RD and age. (C) The relationship between global disorder and age in mice. (D) Average RD across all regions that gain disorder with age (correlation coefficient ≥0.25), or (E) lose disorder with age (correlation coefficient ≤−0.25. (F) Manhattan plot of the distribution of FDR corrected p-values of the relationship between RD and age. Red line marks a commonly used genome wide significance value of p = 5 × 10⁻⁸. Enrichment of age associated RD in genes (G), promoters (H), enhancers (I), PRC2 target genes (J), transcription factor binding sites (K), CTCF binding sites (L), and average CpG density (M). (N) The six most significant gene ontology biological processes (GO:BP) for regions gaining or losing disorder with age. Regions which gain disorder with age are shown in blue and regions which lose disorder with age are shown in red.
Figure 2
Figure 2
Regional disorder is distinct from Shannon’s entropy and age-associated changes in mean methylation. (A) The relationship of regional entropy (RE; black line) with regional methylation and regional disorder (RD; blue dots) with regional methylation (RM). Data points show a single region averaged across all samples. (B) Relationship between RD and RE averaged across all samples. (C) Correlation coefficients of RD with age and RM with age across the 153 samples used to build the epigenetic clock. Regions which increase in RM or RD with age have positive correlation coefficients, regions which decrease in RM or RD with age have negative correlation coefficients.
Figure 3
Figure 3
Epigenetic disorder underlies epigenetic clock signals. (A) Distribution of Petkovich epigenetic clock sites (red) across correlation coefficients between regional disorder (RD) and age. (B) Average absolute correlation coefficient between RD and age of regions which are included in the Petkovich epigenetic clock (red) compared to those which are not included. (C) Error of epigenetic age estimates produced by leave-one-out cross validation (LOOCV) for each data type. (DG) Manhattan plots showing the robustness for each region (i.e., the proportion of clocks each region was selected in) across (D) CpG methylation (black), (E) regional methylation (RM; yellow), (F) regional entropy (RE; light blue), and (G) RD (dark blue) contexts. (HK) Density plots showing the distribution of clock sites for each data type across correlation coefficients between RD and age. (L) Overlap between regions included in epigenetic clocks produced from each data type. (M) Relationship between delta epigenetic age (chronological age – predicted age) and age-adjusted global disorder for each data type.
Figure 4
Figure 4
Epigenetic disorder is influenced by lifespan extending manipulations. The effect of caloric restriction in C57BL/6 mice on (A) epigenetic age predictions from each data type and (B) age-adjusted global disorder. The effect of caloric restriction in B6D2F1 mice on (C) epigenetic age predictions from each data type and (D) age-adjusted global disorder. Comparison of Snell dwarf and control mice on (E) epigenetic age predictions from each data type and (F) age-adjusted global disorder. The effect of growth hormone receptor knock-out (GHRKO) on (G) epigenetic age predictions from each data type and (H) age-adjusted global disorder. All plots show median, upper, and lower quartiles, and maximum and minimum. Outliers beyond 1.5 interquartile range are plotted.
Figure 5
Figure 5
Epigenetic disorder during de-differentiation and development. (A) Epigenetic age predictions using each of the representative epigenetic clocks and (B) global disorder of kidney fibroblasts (black), kidney derived iPSCs (grey), lung fibroblasts (dark purple), and lung derived iPSCs (pink). Plot shows median, upper and lower quartiles, maximum, and minimum. Outliers beyond 1.5 interquartile range are plotted. (C) Distribution of regions which gain (blue) or lose (red) disorder after de-differentiation across correlation coefficients between regional disorder (RD) and age. (D) Effect sizes of de-differentiation on the RD epigenetic clock. Stubbs CpG methylation (E), RM (F), RE (G), and RD (H) epigenetic clock predictions of samples during embryonic development. (I) Global disorder of samples during embryonic development. (J) distribution of regions which gain (blue) or lose (red) disorder during early development across correlation coefficients between regional disorder (RD) and age. (K) Effect sizes of development on the RD epigenetic clock.

Similar articles

Cited by

References

    1. Horvath S, Raj K. DNA methylation-based biomarkers and the epigenetic clock theory of ageing. Nat Rev Genet. 2018; 19:371–84. 10.1038/s41576-018-0004-3 - DOI - PubMed
    1. Yang JH, Hayano M, Griffin PT, Amorim JA, Bonkowski MS, Apostolides JK, Salfati EL, Blanchette M, Munding EM, Bhakta M, Chew YC, Guo W, Yang X, et al.. Loss of epigenetic information as a cause of mammalian aging. Cell. 2023; 186:305–26.e27. 10.1016/j.cell.2022.12.027 - DOI - PMC - PubMed
    1. Landau DA, Clement K, Ziller MJ, Boyle P, Fan J, Gu H, Stevenson K, Sougnez C, Wang L, Li S, Kotliar D, Zhang W, Ghandi M, et al.. Locally disordered methylation forms the basis of intratumor methylome variation in chronic lymphocytic leukemia. Cancer Cell. 2014; 26:813–25. 10.1016/j.ccell.2014.10.012 - DOI - PMC - PubMed
    1. Kane AE, Sinclair DA. Epigenetic changes during aging and their reprogramming potential. Crit Rev Biochem Mol Biol. 2019; 54:61–83. 10.1080/10409238.2019.1570075 - DOI - PMC - PubMed
    1. Hannum G, Guinney J, Zhao L, Zhang L, Hughes G, Sadda S, Klotzle B, Bibikova M, Fan JB, Gao Y, Deconde R, Chen M, Rajapakse I, et al.. Genome-wide methylation profiles reveal quantitative views of human aging rates. Mol Cell. 2013; 49:359–67. 10.1016/j.molcel.2012.10.016 - DOI - PMC - PubMed

Publication types

LinkOut - more resources