

Metabolomics responses and tolerance of Pseudomonas aeruginosa under acoustic vibration stress
- PMID: 38285708
- PMCID: PMC10824448
- DOI: 10.1371/journal.pone.0297030
Metabolomics responses and tolerance of Pseudomonas aeruginosa under acoustic vibration stress
Abstract
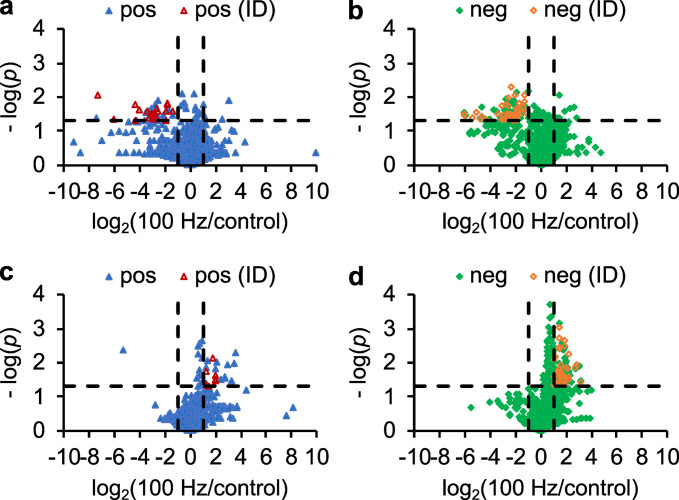
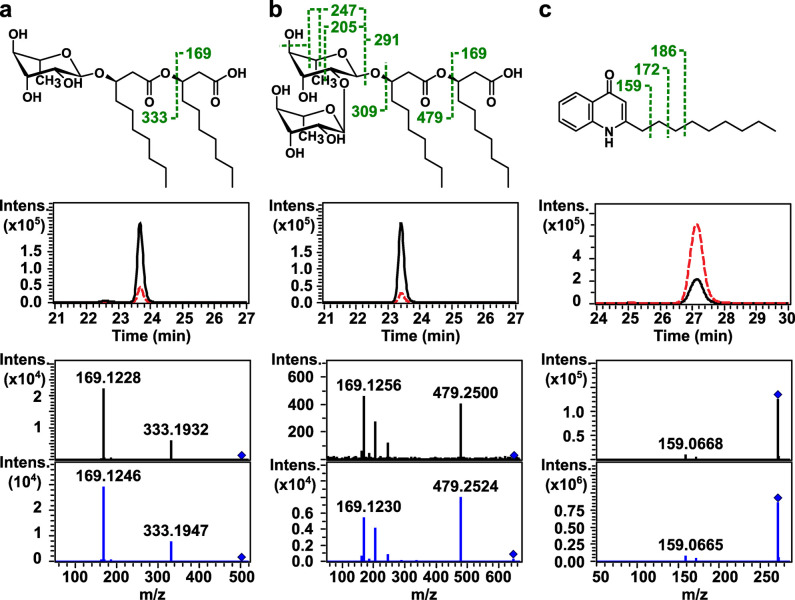
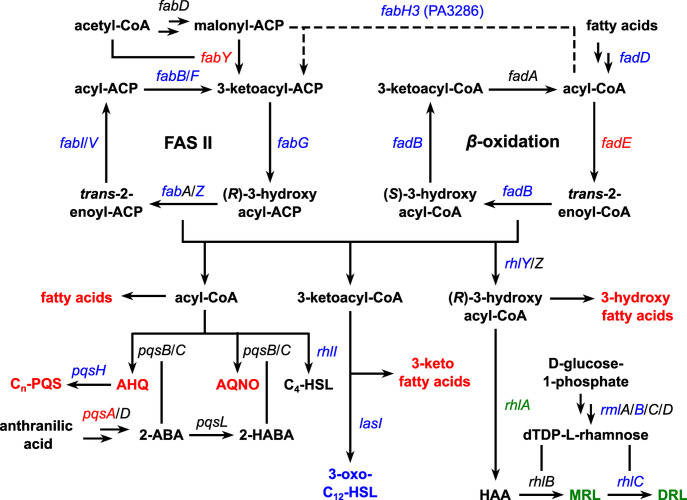
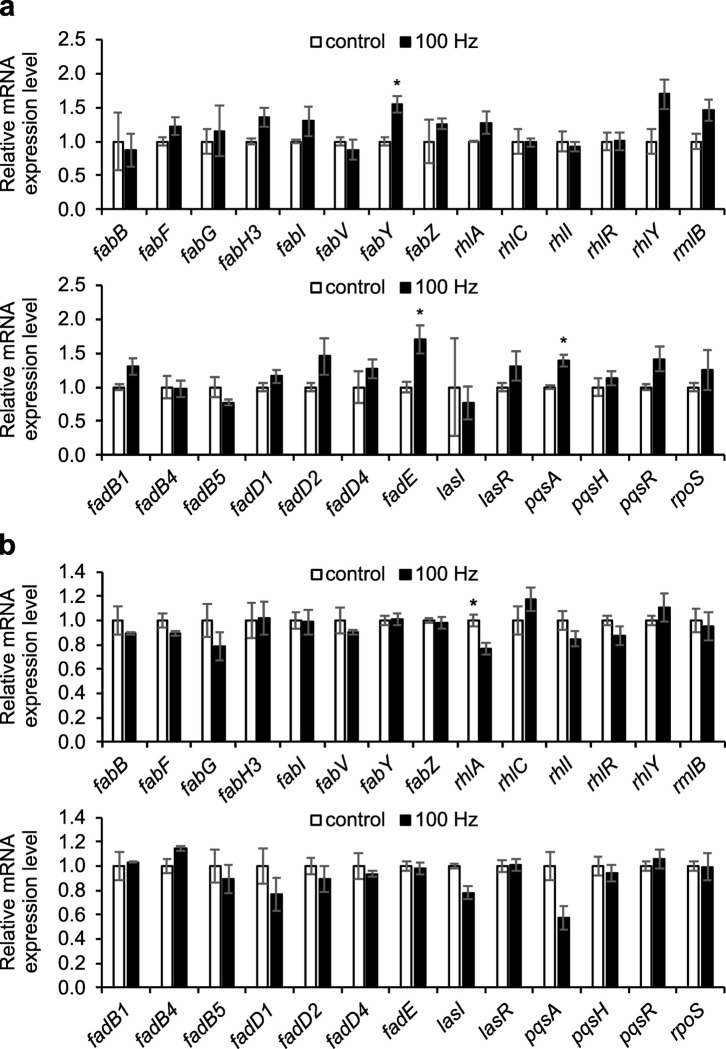
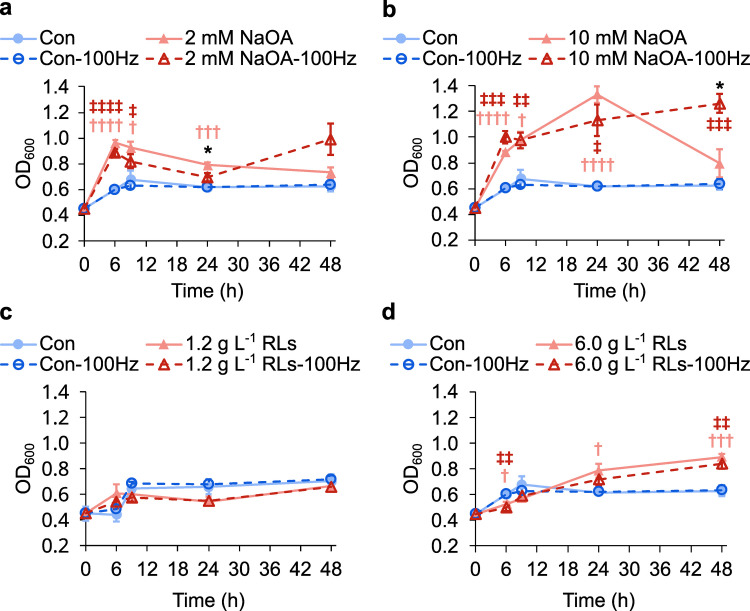
Sound has been shown to impact microbial behaviors. However, our understanding of the chemical and molecular mechanisms underlying these microbial responses to acoustic vibration is limited. In this study, we used untargeted metabolomics analysis to investigate the effects of 100-Hz acoustic vibration on the intra- and extracellular hydrophobic metabolites of P. aeruginosa PAO1. Our findings revealed increased levels of fatty acids and their derivatives, quinolones, and N-acylethanolamines upon sound exposure, while rhamnolipids (RLs) showed decreased levels. Further quantitative real-time polymerase chain reaction experiments showed slight downregulation of the rhlA gene (1.3-fold) and upregulation of fabY (1.5-fold), fadE (1.7-fold), and pqsA (1.4-fold) genes, which are associated with RL, fatty acid, and quinolone biosynthesis. However, no alterations in the genes related to the rpoS regulators or quorum-sensing networks were observed. Supplementing sodium oleate to P. aeruginosa cultures to simulate the effects of sound resulted in increased tolerance of P. aeruginosa in the presence of sound at 48 h, suggesting a potential novel response-tolerance correlation. In contrast, adding RL, which went against the response direction, did not affect its growth. Overall, these findings provide potential implications for the control and manipulation of virulence and bacterial characteristics for medical and industrial applications.
Copyright: © 2024 Vinayavekhin et al. This is an open access article distributed under the terms of the Creative Commons Attribution License, which permits unrestricted use, distribution, and reproduction in any medium, provided the original author and source are credited.
Conflict of interest statement
The authors have declared that no competing interests exist.
Figures
Similar articles
-
Interference with Pseudomonas aeruginosa Quorum Sensing and Virulence by the Mycobacterial Pseudomonas Quinolone Signal Dioxygenase AqdC in Combination with the N-Acylhomoserine Lactone Lactonase QsdA.Infect Immun. 2019 Sep 19;87(10):e00278-19. doi: 10.1128/IAI.00278-19. Print 2019 Oct. Infect Immun. 2019. PMID: 31308081 Free PMC article.
-
Diallyl disulfide from garlic oil inhibits Pseudomonas aeruginosa virulence factors by inactivating key quorum sensing genes.Appl Microbiol Biotechnol. 2018 Sep;102(17):7555-7564. doi: 10.1007/s00253-018-9175-2. Epub 2018 Jun 27. Appl Microbiol Biotechnol. 2018. PMID: 29951860
-
Quenching of quorum sensing in multi-drug resistant Pseudomonas aeruginosa: insights on halo-bacterial metabolites and gamma irradiation as channels inhibitors.Ann Clin Microbiol Antimicrob. 2024 Apr 10;23(1):31. doi: 10.1186/s12941-024-00684-5. Ann Clin Microbiol Antimicrob. 2024. PMID: 38600513 Free PMC article.
-
The third quorum-sensing system of Pseudomonas aeruginosa: Pseudomonas quinolone signal and the enigmatic PqsE protein.J Med Microbiol. 2020 Jan;69(1):25-34. doi: 10.1099/jmm.0.001116. J Med Microbiol. 2020. PMID: 31794380 Review.
-
The Molecular Architecture of Pseudomonas aeruginosa Quorum-Sensing Inhibitors.Mar Drugs. 2022 Jul 28;20(8):488. doi: 10.3390/md20080488. Mar Drugs. 2022. PMID: 36005489 Free PMC article. Review.
Cited by
-
Ralstonia solanacearum Secretions Induce Shifts in Macrolactin Composition and Reduction in Antimicrobial Activity of Bacillus amyloliquefaciens BNC5.J Agric Food Chem. 2025 May 21;73(20):12525-12536. doi: 10.1021/acs.jafc.5c03489. Epub 2025 May 12. J Agric Food Chem. 2025. PMID: 40353476 Free PMC article.
-
ACSL3 is an unfavorable prognostic marker in cholangiocarcinoma patients and confers ferroptosis resistance in cholangiocarcinoma cells.NPJ Precis Oncol. 2024 Dec 20;8(1):284. doi: 10.1038/s41698-024-00783-8. NPJ Precis Oncol. 2024. PMID: 39706856 Free PMC article.
-
Physical communication pathways in bacteria: an extra layer to quorum sensing.Biophys Rev. 2025 Mar 4;17(2):667-685. doi: 10.1007/s12551-025-01290-1. eCollection 2025 Apr. Biophys Rev. 2025. PMID: 40376406 Free PMC article. Review.
-
Examining Sound, Light, and Vibrations as Tools to Manage Microbes and Support Holobionts, Ecosystems, and Technologies.Microorganisms. 2024 Apr 30;12(5):905. doi: 10.3390/microorganisms12050905. Microorganisms. 2024. PMID: 38792734 Free PMC article. Review.
References
MeSH terms
Substances
LinkOut - more resources
Full Text Sources
