. 2024 Jan 29;8(2):e0378.
doi: 10.1097/HC9.0000000000000378. eCollection 2024 Feb 1.

Targeting G9a/DNMT1 methyltransferase activity impedes IGF2-mediated survival in hepatoblastoma

Affiliations

Targeting G9a/DNMT1 methyltransferase activity impedes IGF2-mediated survival in hepatoblastoma

Salih Demir et al. Hepatol Commun. .

Abstract

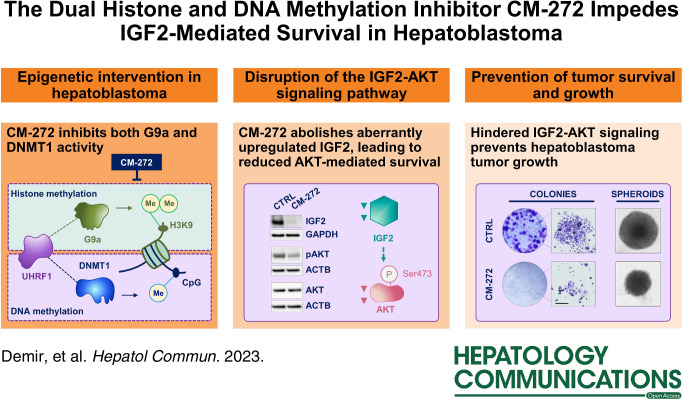
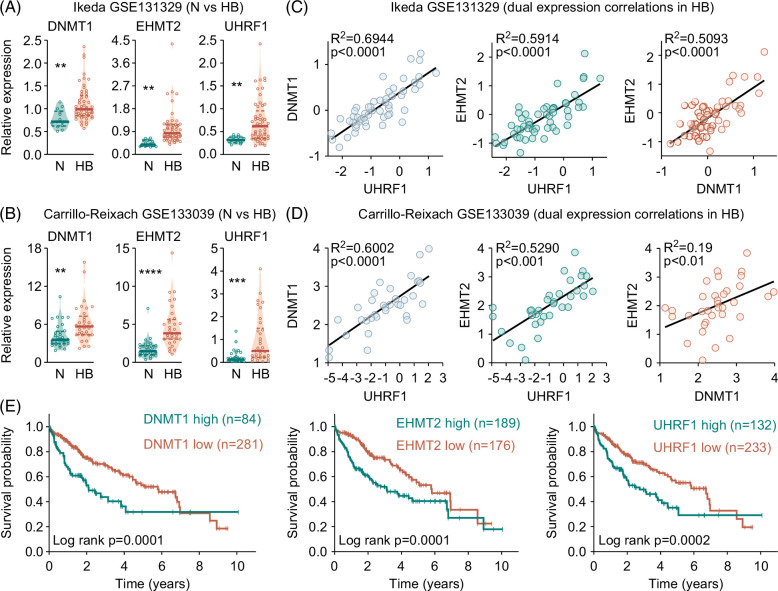
Background: As the variable clinical outcome of patients with hepatoblastoma (HB) cannot be explained by genetics alone, the identification of drugs with the potential to effectively reverse epigenetic alterations is a promising approach to overcome poor therapy response. The gene ubiquitin like with PHD and ring finger domains 1 (UHRF1) represents an encouraging epigenetic target due to its regulatory function in both DNA methylation and histone modifications and its clinical relevance in HB.

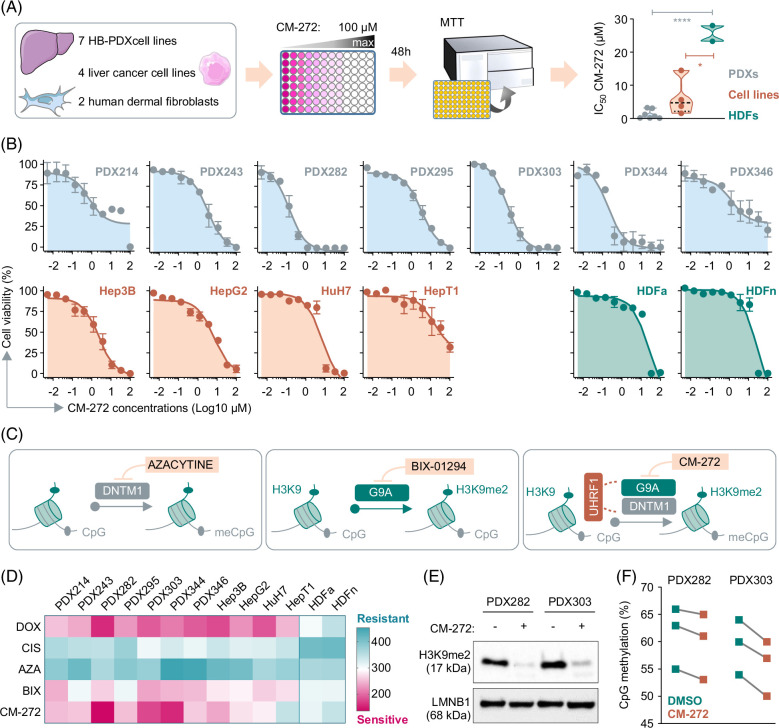
Methods: Patient-derived xenograft in vitro and in vivo models were used to study drug response. The mechanistic basis of CM-272 treatment was elucidated using RNA sequencing and western blot experiments.

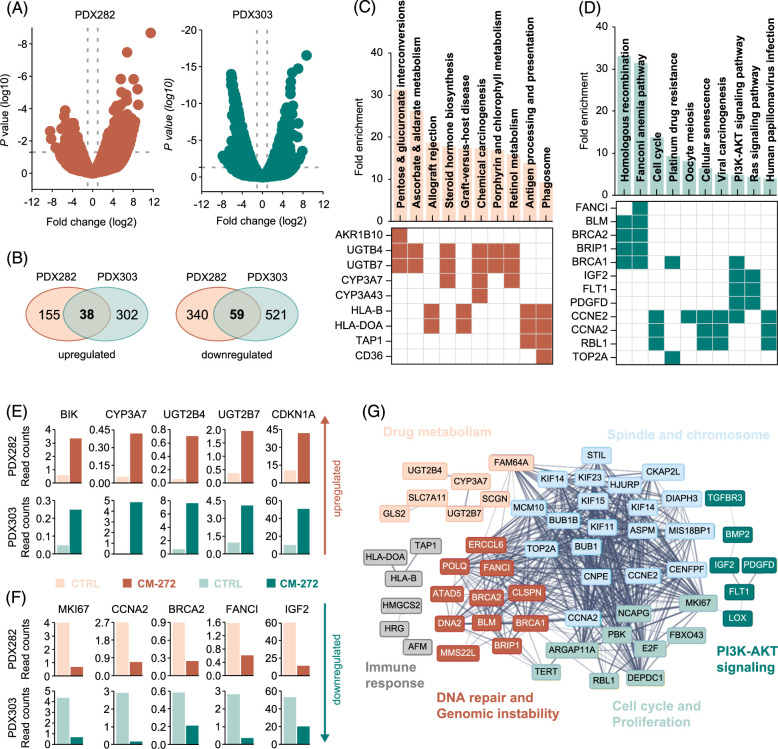
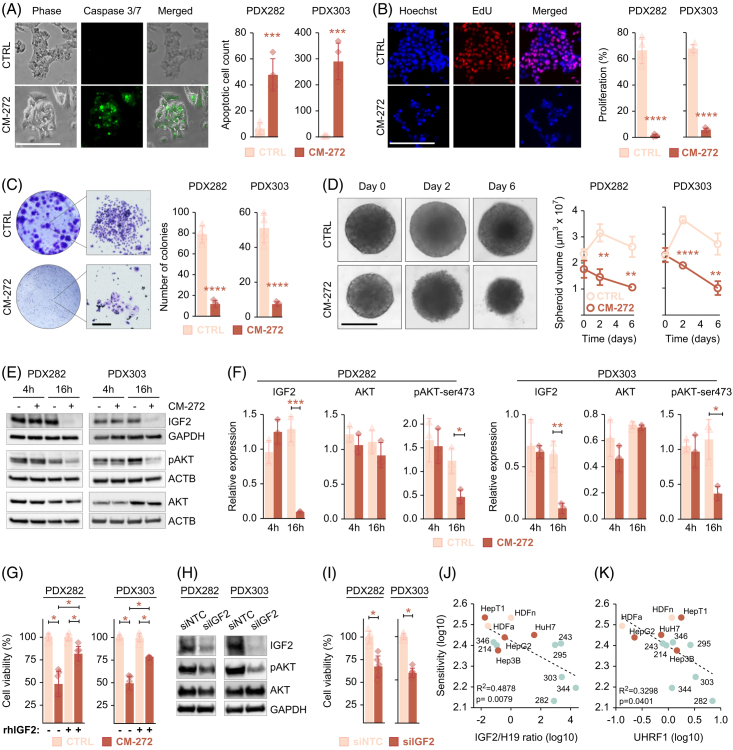
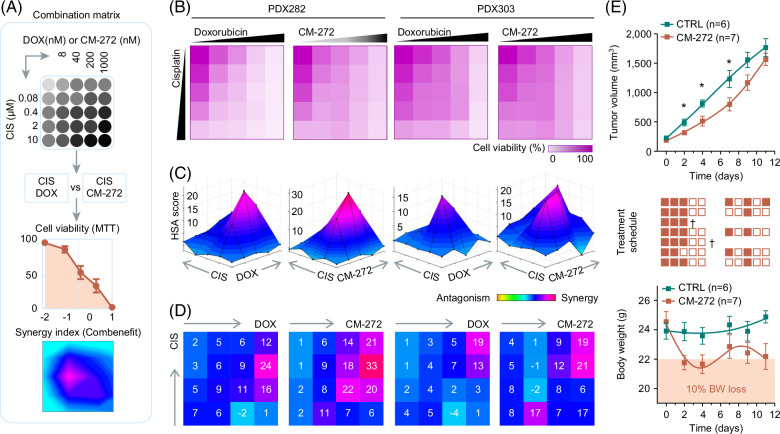
Results: We validated in comprehensive data sets that UHRF1 is highly expressed in HB and associated with poor outcomes. The simultaneous pharmacological targeting of UHRF1-dependent DNA methylation and histone H3 methylation by the dual inhibitor CM-272 identified a selective impact on HB patient-derived xenograft cell viability while leaving healthy fibroblasts unaffected. RNA sequencing revealed downregulation of the IGF2-activated survival pathway as the main mode of action of CM-272 treatment, subsequently leading to loss of proliferation, hindered colony formation capability, reduced spheroid growth, decreased migration potential, and ultimately, induction of apoptosis in HB cells. Importantly, drug response depended on the level of IGF2 expression, and combination assays showed a strong synergistic effect of CM-272 with cisplatin. Preclinical testing of CM-272 in a transplanted patient-derived xenograft model proved its efficacy but also uncovered side effects presumably caused by its strong antitumor effect in IGF2-driven tumors.

Conclusions: The inhibition of UHRF1-associated epigenetic traces, such as IGF2-mediated survival, is an attractive approach to treat high-risk HB, especially when combined with the standard-of-care therapeutic cisplatin.


Conflict of interest statement

The authors have no conflicts to report.

Figures

None
Graphical abstract
FIGURE 1
FIGURE 1
DNMT1, EHMT2, and UHRF1 genes are associated with a poor prognosis in liver cancer. (A, B) RNA expression levels of DNMT1, EHMT2, and UHRF1 genes in normal liver (N) and HB. Fragments per kilobase of transcript per million mapped reads of candidate genes were retrieved from the data sets (A) Ikeda GSE131329 (N=14, HB=53) and (B) Carrillo-Reixach GSE133039 (N=33, HB=33) and normalized to the housekeeping gene TATA-box-binding-protein. The violin plot displays individual values (circles), the median (solid lines) and the 25/75th percentiles (dashed lines) of the group. Student t test was applied to calculate significances, with **p<0.01, ***p<0.001, ****p<0.0001. (C, D) Correlation of gene expression between DNMT1, EHMT2, and UHRF1 in the (C) Ikeda GSE131329 and (D) Carrillo-Reixach GSE133039 data sets. Two-tailed Pearson test was performed, and correlation coefficients were calculated. The linear regressions are given as solid black lines. (E) Kaplan-Meier curves displaying survival probabilities for patients with HCC (n=365) retrieved from the Human Protein Atlas database with either high or low DNMT1, EHMT2, and UHRF1 expression. The log-rank Mantel-Cox test was used to calculate significance. Abbreviations: DNMT1, DNA methyltransferase1; EHMT2, euchromatic histone lysine methyltransferase 2; HB, hepatoblastoma; UHRF1, ubiquitin like with PHD and ring finger domains 1.
FIGURE 2
FIGURE 2
Dual inhibition of DNTM1 and G9A effectively reduces growth of liver cancer cells. (A) Schematic overview of the in vitro drug testing platform comprising four liver cancer cell lines, seven HB PDX cell lines, and normal HDFs. The graph on the right depicts IC50 values of CM-272–treated cell lines, showing individual values (circles), the median (dashed lines) and the 25/75th percentiles (dotted lines) of the group. Student t test was applied to calculate significances, with *p<0.05, ****p<0.0001. (B) Dose-dependent drug response curves of cell lines on exposure to 10 increasing CM-272 concentrations ranging from 5 to 100 µM. All data points represent 2 independent experiments with duplicate measurements, and the error bars represent±SEM. (C) Schematic illustrations depicting the inhibitory mechanisms of DNA methylation by 5-azacytidine, histone 3 lysine 9 methylation (H3K9me) by BIX-0194, and dual inhibition of DNMT1 and G9a by CM-272. (D) Heatmap showing drug sensitivity of cell lines to DOX, CIS, AZA, BIX, and CM-272. AUC values represent the mean of 2 independent cell viability experiments, each consisting of duplicate measurements. The color scale from blue to pink indicates increasing sensitivity to drug treatment. (E) Western blot detection of H3K9me2 in PDX282 and PDX303 tumor cells on 16 hours exposure to 100 nM CM-272. LMNB1 was used as a nuclear loading control. (F) Pyrosequencing results showing the global methylation levels at 3 CpG dinucleotides of LINE-1 elements of PDX282 and PDX303 cells following 100 nM CM-272 exposure for 16 hours. Abbreviations: AZA, 5-azacytidine; BIX, BIX-01294; CIS, cisplatin; DNMT1, DNA methyltransferase1; DOX, doxorubicin; HB, hepatoblastoma; HDF, human dermal fibroblast; HDFa, adult human dermal fibroblast; HDFn, neonatal human dermal fibroblast; H3K9me2, dimethylated histone 3 serine 9; LMNB1, lamin B1; PDX, patient-derived xenograft.
FIGURE 3
FIGURE 3
Transcriptional consequences of CM-272 treatment in liver cancer cells. (A) Volcano plots of differentially expressed genes in PDX282 and PDX303 cells on 16 hours of exposure to 100 nM CM-272, as determined by RNA sequencing. The log10-transformed p-values are plotted against the average log2 fold changes in gene expression, with dashed lines indicating p<0.05 and fold changes >2. (B) Venn diagrams summarizing the numbers of upregulated and downregulated expressed genes for PDX282 and PDX303. (C, D) KEGG pathway analysis (upper) and clustergrams (lower) for commonly (C) upregulated and (D) downregulated genes of PDX282 and PDX303, revealing enrichment in cellular and molecular pathways and associated key genes. (E, F) Bar graphs representing RNA expression of the top-scoring candidate genes of the enriched pathways in the DMSO- (light) and CM-272- (dark) treated PDX282 (orange) and PDX303 (green) cells. (G) Protein-protein interaction network map visualizing CM-272-regulated candidate genes. The nodes and edges represent query genes and predicted relations between candidates, respectively. The thickness of the lines indicates the strength of data support and stronger interaction among the query proteins. Abbreviations: BIK, BCL2-interacting killing; BRCA2, breast cancer gene 2; CCNA2, cyclin 2A; FANCI, Fanconi anemia complementation group I; KEGG, Kyoto Encyclopedia of Genes and Genomes; PDX, patient-derived xenograft; PI3K, phosphatidylinositol-3-kinase.
FIGURE 4
FIGURE 4
Cellular consequences of CM-272 treatment in liver cancer cells. (A) Apoptotic cells were detected in PDX282 and PDX303 cells, which were exposed to DMSO (CTRL) or 200 nM CM-272 for 48 hours by staining active caspase 3/7 substrate (green) and quantified in relation to adherent cells (phase contrast). The bar graphs represent 2 independent experiments with 6 replicate measurements. (B) Proliferating cells were detected by Click-it EdU-staining (red) and quantified in relation to Hoechst 33342-stained nuclei (blue). PDX282 and PDX303 cells were exposed to DMSO (CTRL) or 200 nM CM-272 for 48 hours. The bar graphs represent 2 independent experiments with 6 replicate measurements. (C) Long-term growth of the PDX cells was monitored by colony formation assay. Cells were exposed to DMSO (CTRL) or 50 nM CM-272 for 10 days, and colonies were stained with crystal violet. Representative wells (left) and magnified views (right) are displayed. The bar graphs represent two independent experiments with two replicate measurements. (D) Established tumor spheroids of PDX282 and PDX303 cells were treated with DMSO (CTRL) or 200 nM CM-272 for 6 days. The line graph represents mean spheroid volumes of one experiment consisting of triplicate measurements. (E) Western blot detection of IGF2, AKT and phosphorylated AKT (pAKT) levels in PDX282 and PDX303 liver tumor cells on exposure to 100 nM CM-272 for 16 hours. ACTB or GAPDH were used as loading control. (F) The bar graphs represent densitometrical quantifications of protein amounts detected by western blot of 3 independent experiments. (G) Sensitivity of HB PDXs toward CM-272 detected as cell viability in the presence (+) or absence (−) of 10 ng/mL rhIGF2 for 48 hours. The bar graphs represent 2 independent experiments with 3 replicates. (H) Western blot detection of IGF2, pAKT, and AKT levels after 48 hours of transfection with siIGF2 or siNTC. (I) Viability of tumor cells following IGF2 knock-down for 48 hours. The bars respresent 2 independent experiments with 3 replicates. (A–I) All error bars represent±SD. p-values were calculated using a two-tailed unpaired Student t test, with *p<0.05, **p<0.01, ***p<0.001, ****p<0.0001. All scale bars represent 200 μm. (J) Correlation of the log10-transformed IGF2/H19 ratios or (K) UHRF1 expression (RNAseq counts normalized to TATA-box-binding-protein) of cell lines with the sensitivity against CM-272 treatment (log10-transformed AUC values). Two-tailed Pearson test was performed, and correlation coefficients were calculated. The linear regression is given as a dashed line. Abbreviations: ACTB, beta-actin; CTRL, control; EdU, ethynyl deoxyuridine; GAPDH, glyceraldehyde-3-phosphate dehydrogenase; HDFa, adult human dermal fibroblast; HDFn, neonatal human dermal fibroblast; pAKT, phosphorylated AKT; PDX, patient-derived xenograft; rhIGF2, recombinant human IGF2; siIGF2, siRNA against IGF2; siNTC, nontargeting control; UHRF1, ubiquitin like with PHD and ring finger domains 1.
FIGURE 5
FIGURE 5
Preclinical testing of CM-272 in combination with cisplatin and in vivo. (A) Experimental set-up of combination experiments and synergy calculation. The two-drug combination matrix demonstrates the 4 increasing concentrations for CIS given in micromolar, and for DOX and CM-272 given in nanomolar range. (B) Heatmaps displaying the proportions of cell viability in PDX282 and PDX303 cells on exposure toward increasing concentrations of CIS, DOX, and CM-272 as two-drug combination matrix format (n=2, duplicate measurements). (C) Three-dimensional synergy landscapes shown separately for each two-drug combination of CIS and DOX as well as CIS and CM-272. Synergy was calculated with the Combenefit tool, and synergy scores obtained by using the highest single-agent statistic model. Areas highlighted in pink-purple represent high synergy, and dark blue for moderate synergy (n=2, duplicate measurements). (D) Synergy indexes demonstrate the synergy scores for every possible combination of two-drug concentrations. (E) Tumor growth (upper), treatment schedule (middle panel, with filled boxes indicating applied doses, empty boxes skipped doses and crosses death of animals), and body weight changes (lower panel) in mice treated with either CM-272 (n=7) or vehicle (n=6). Values correspond to mean tumor volumes and mean body weights±SEM. Shaded area indicates body weight loss of >10% of starting values. Abbreviations: CIS, cisplatin; CTRL, control; DOX, doxorubicin; MTT, 3-(4, 5-dimethylthiazol-2-yl)-2, 5-diphenyltetrazolium bromide; PDX, patient-derived xenograft.

Similar articles

Cited by

References

    1. Weinberg AG, Finegold MJ. Primary hepatic tumors of childhood. Hum Pathol. 1983;14:512–37. - PubMed
    1. Giardiello FM, Offerhaus GJ, Krush AJ, Booker SV, Tersmette AC, Mulder JW, et al. . Risk of hepatoblastoma in familial adenomatous polyposis. J Pediatr. 1991;119:766–8. - PubMed
    1. Little MH, Thomson DB, Hayward NK, Smith PJ. Loss of alleles on the short arm of chromosome 11 in a hepatoblastoma from a child with Beckwith-Wiedemann syndrome. Hum Genet. 1988;79:186–9. - PubMed
    1. Koch A, Denkhaus D, Albrecht S, Leuschner I, von Schweinitz D, Pietsch T. Childhood hepatoblastomas frequently carry a mutated degradation targeting box of the beta-catenin gene. Cancer Res. 1999;59:269–73. - PubMed
    1. Eichenmüller M, Trippel F, Kreuder M, Beck A, Schwarzmayr T, Häberle B, et al. . The genomic landscape of hepatoblastoma and their progenies with HCC-like features. J Hepatol. 2014;61:1312–20. - PubMed

Publication types

MeSH terms