. 2024 Jun;105(6):1263-1278.
doi: 10.1016/j.kint.2024.01.012. Epub 2024 Jan 27.

Unbiased kidney-centric molecular categorization of chronic kidney disease as a step towards precision medicine

Affiliations

Unbiased kidney-centric molecular categorization of chronic kidney disease as a step towards precision medicine

Anna Reznichenko et al. Kidney Int. 2024 Jun.

Abstract

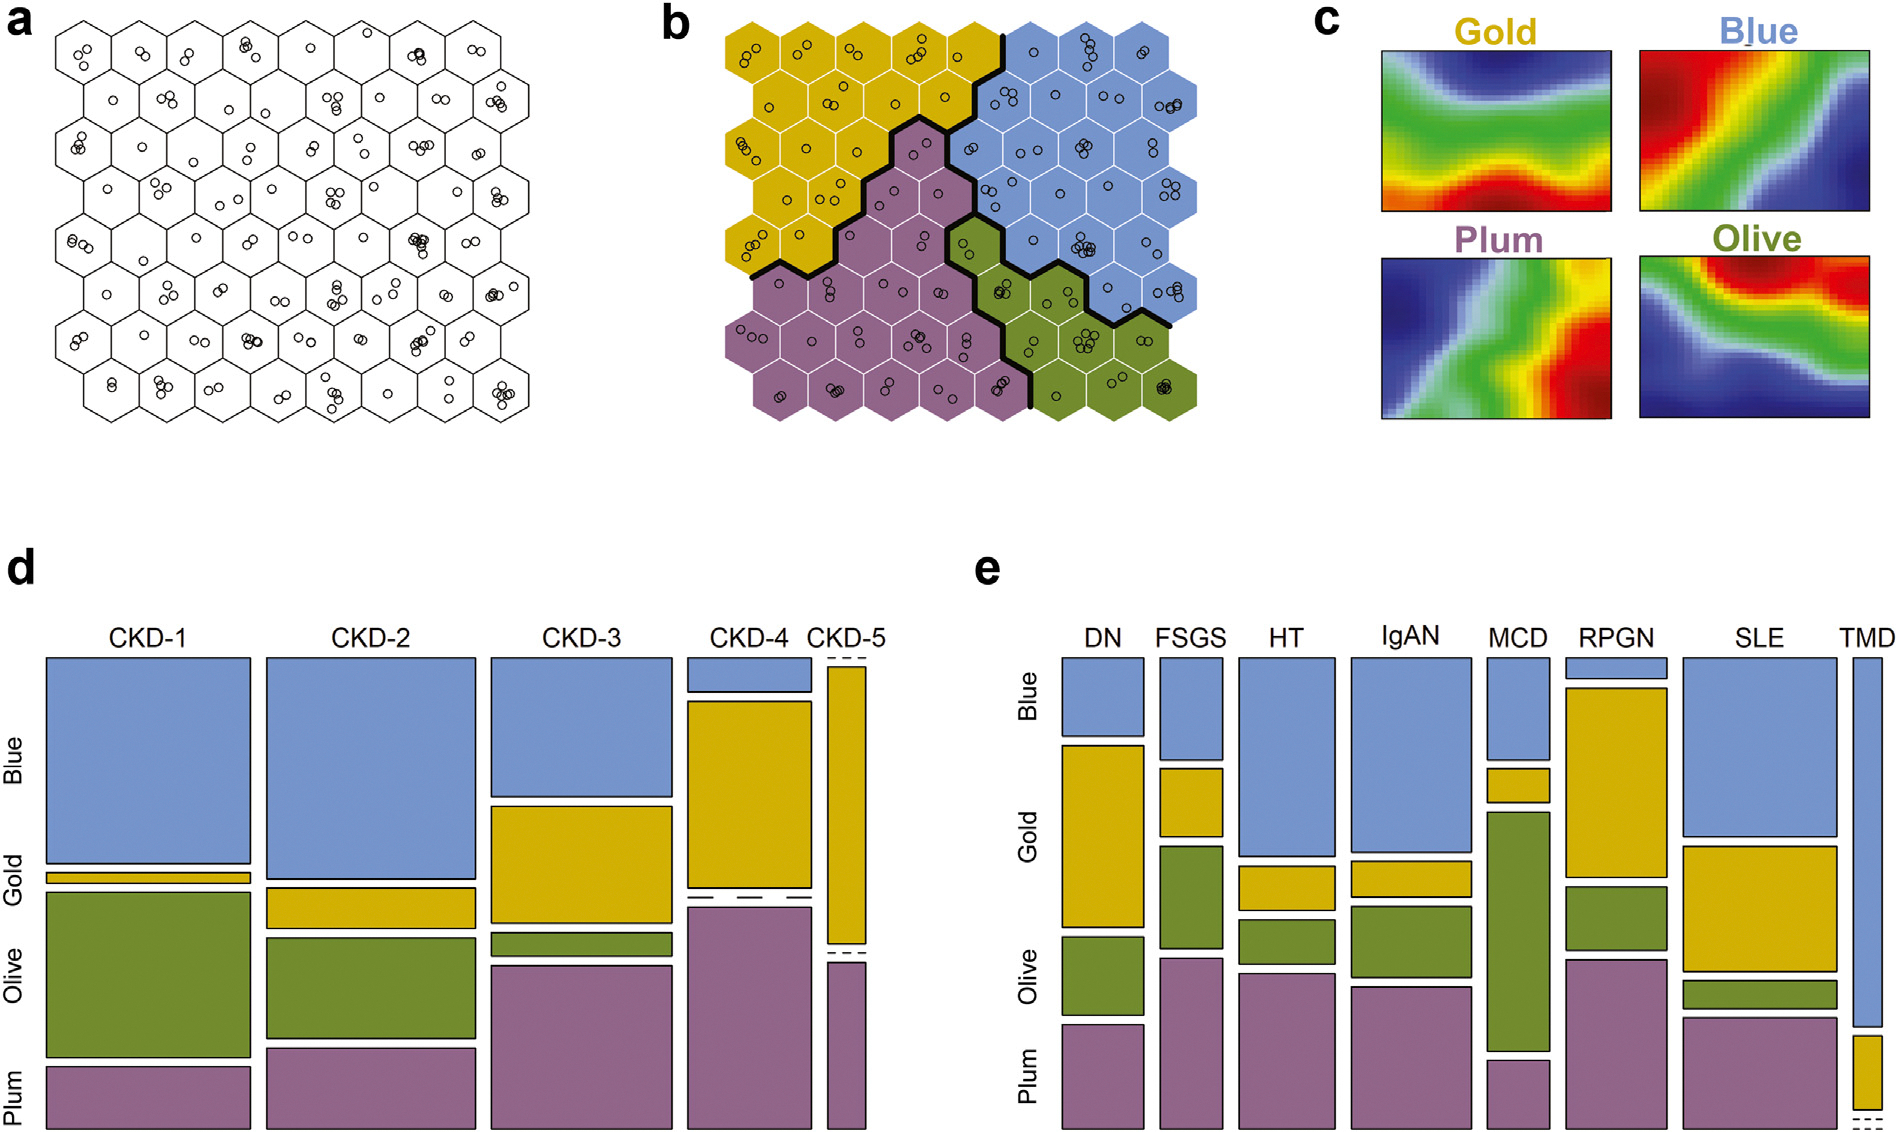
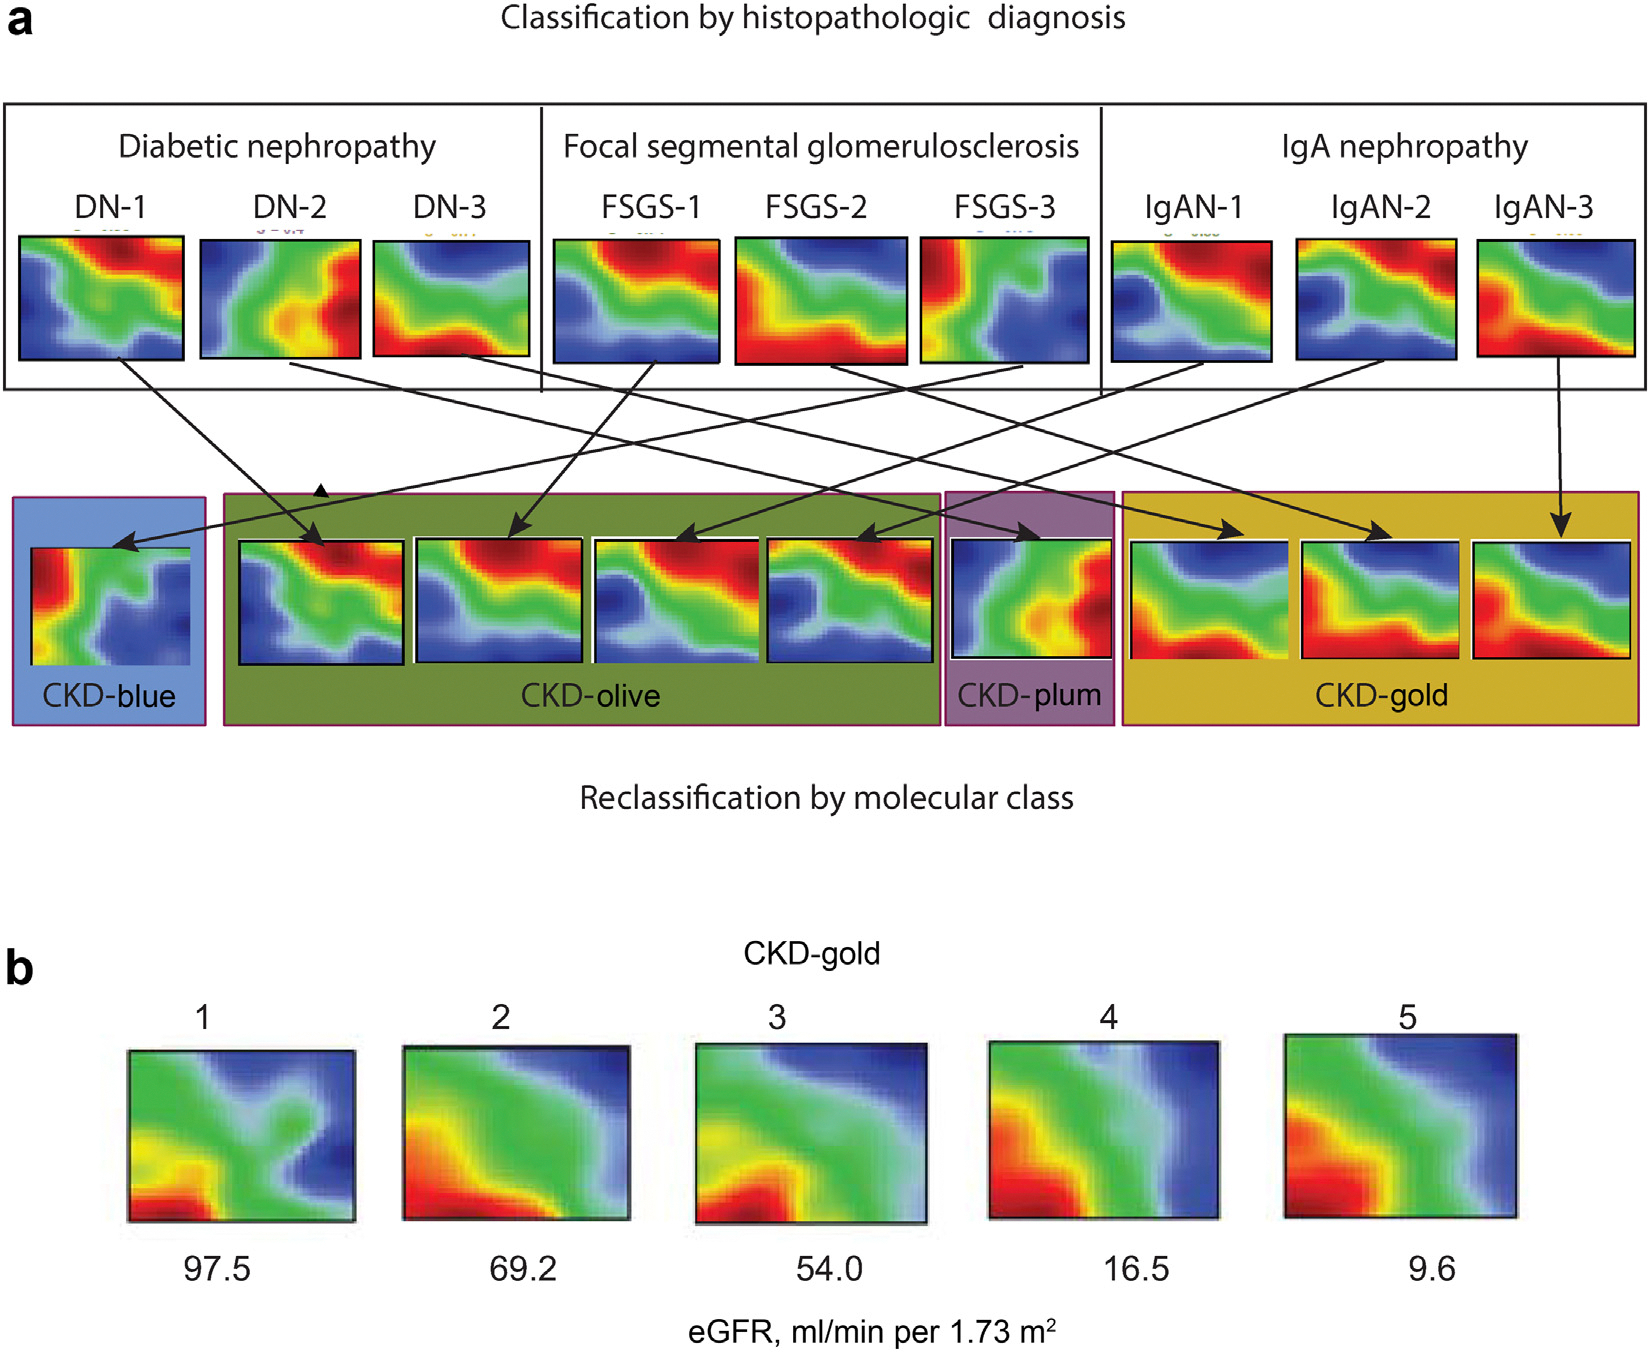
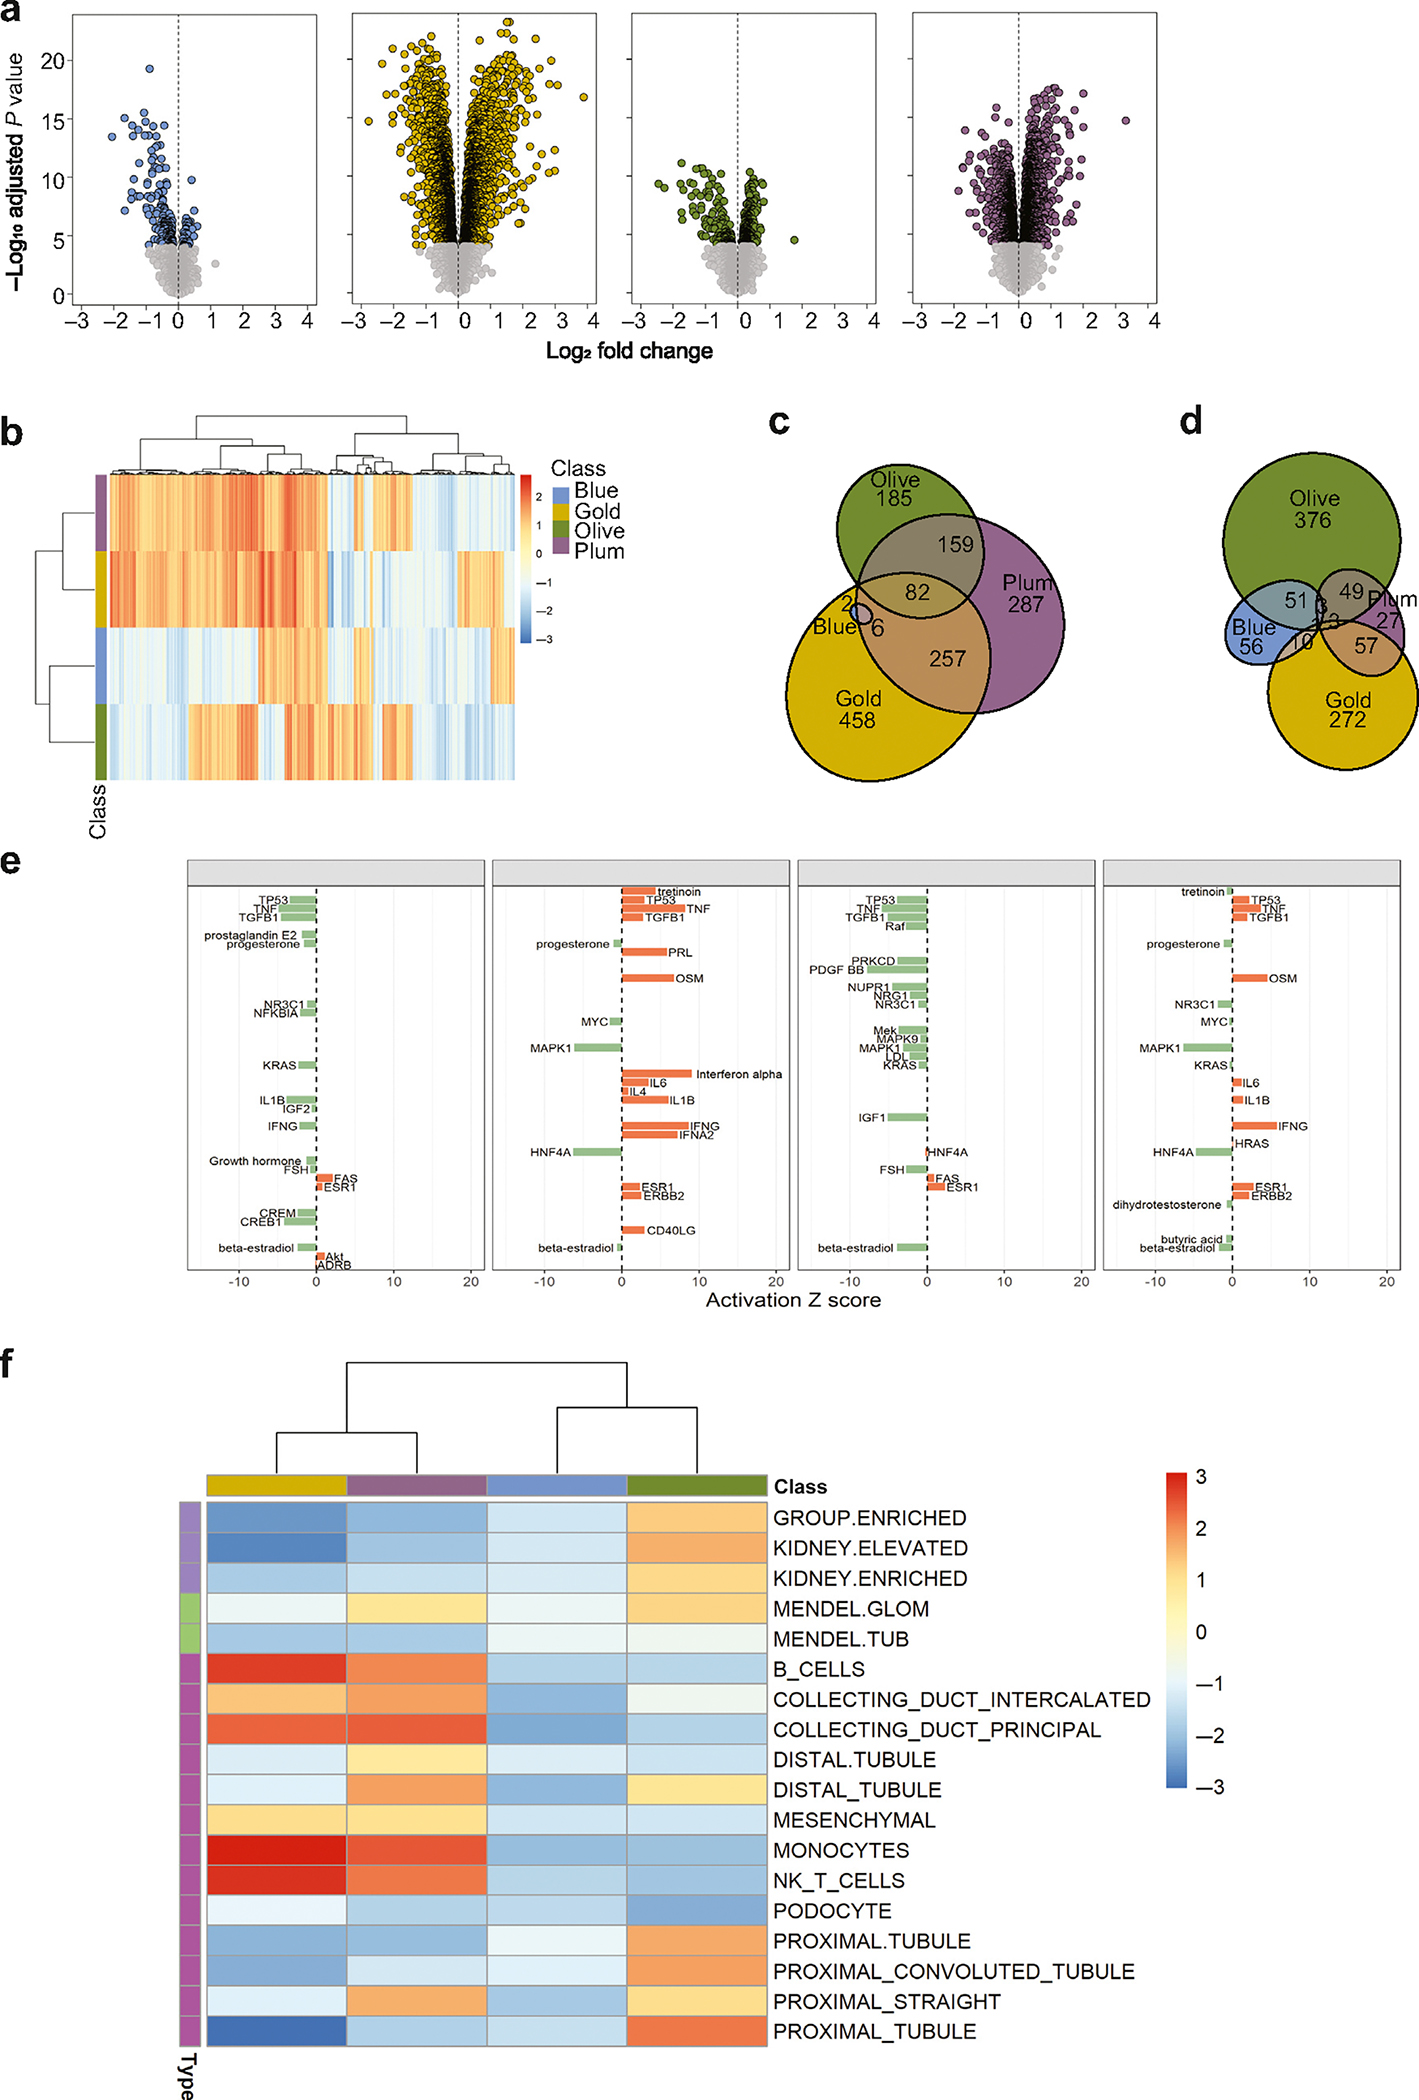
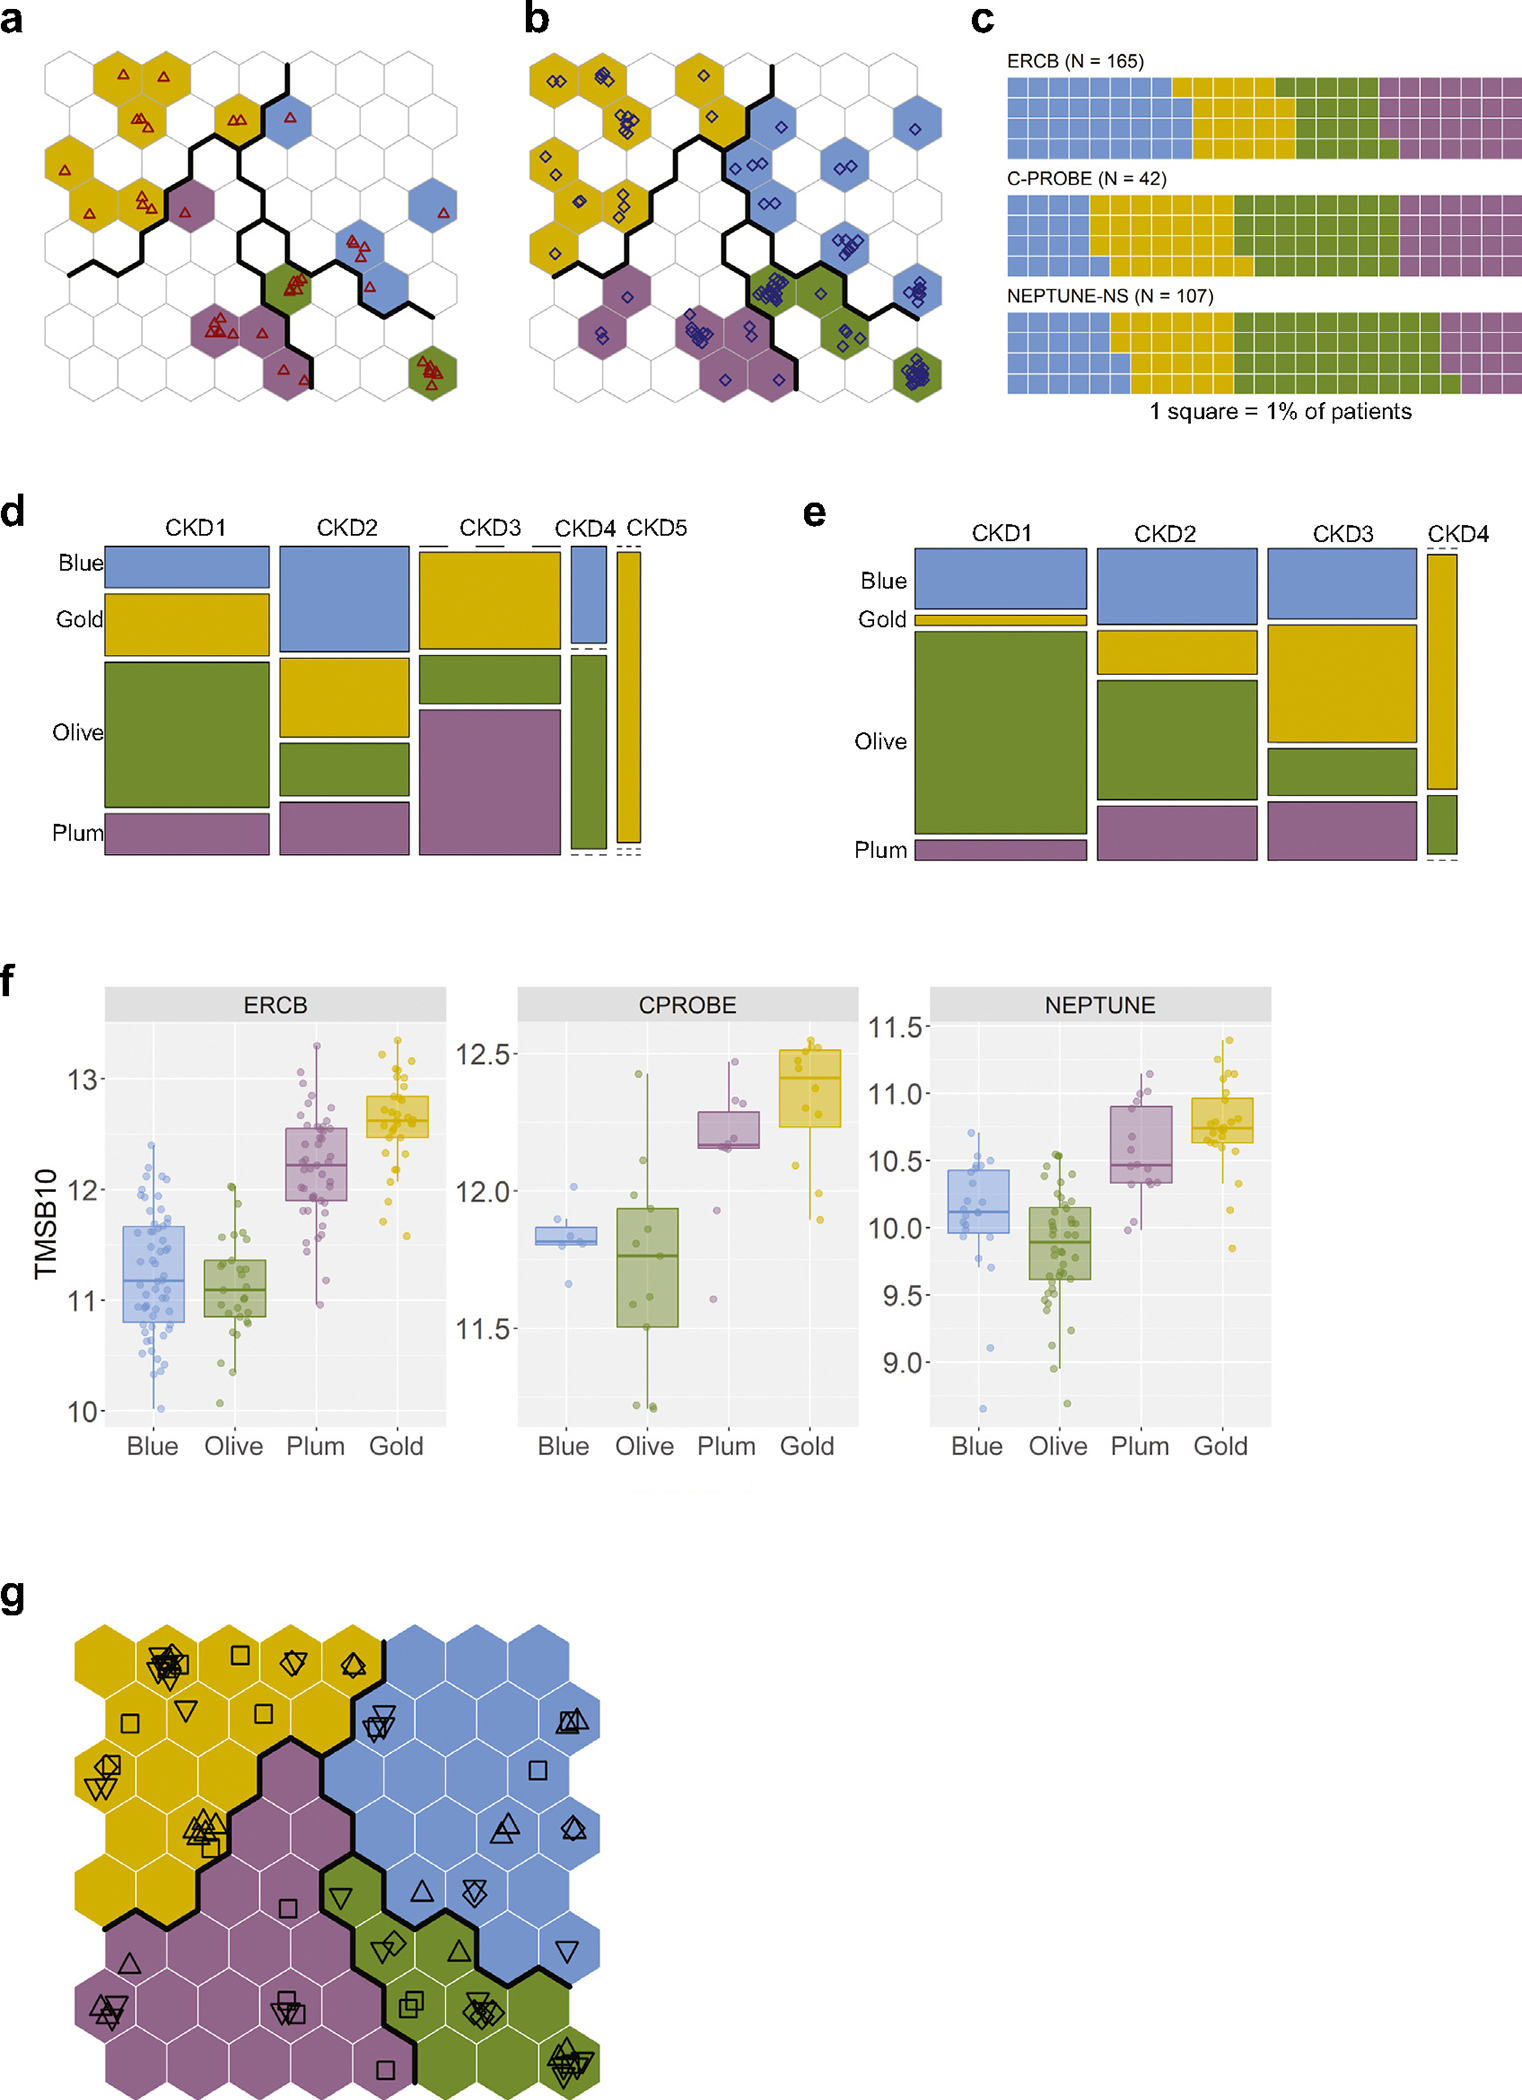
Current classification of chronic kidney disease (CKD) into stages using indirect systemic measures (estimated glomerular filtration rate (eGFR) and albuminuria) is agnostic to the heterogeneity of underlying molecular processes in the kidney thereby limiting precision medicine approaches. To generate a novel CKD categorization that directly reflects within kidney disease drivers we analyzed publicly available transcriptomic data from kidney biopsy tissue. A Self-Organizing Maps unsupervised artificial neural network machine-learning algorithm was used to stratify a total of 369 patients with CKD and 46 living kidney donors as healthy controls. Unbiased stratification of the discovery cohort resulted in identification of four novel molecular categories of disease termed CKD-Blue, CKD-Gold, CKD-Olive, CKD-Plum that were replicated in independent CKD and diabetic kidney disease datasets and can be further tested on any external data at kidneyclass.org. Each molecular category spanned across CKD stages and histopathological diagnoses and represented transcriptional activation of distinct biological pathways. Disease progression rates were highly significantly different between the molecular categories. CKD-Gold displayed rapid progression, with significant eGFR-adjusted Cox regression hazard ratio of 5.6 [1.01-31.3] for kidney failure and hazard ratio of 4.7 [1.3-16.5] for composite of kidney failure or a 40% or more eGFR decline. Urine proteomics revealed distinct patterns between the molecular categories, and a 25-protein signature was identified to distinguish CKD-Gold from other molecular categories. Thus, patient stratification based on kidney tissue omics offers a gateway to non-invasive biomarker-driven categorization and the potential for future clinical implementation, as a key step towards precision medicine in CKD.

Keywords: gene expression; kidney biopsy; machine learning; patient stratification; precision medicine; tissue transcriptomics.


Conflict of interest statement

DISCLOSURE

MK reports receiving grants from the National Institutes of Health (NIH), nonfinancial support from the University of Michigan, funding through the University of Michigan from AstraZeneca, Novo Nordisk, Eli Lilly, Janssen, and Gilead for this study; grants and contracts outside the submitted work through the University of Michigan with the NIH, Chan Zuckerberg Initiative, JDRF, Roche, Goldfinch Bio, Boehringer-Ingelheim, Moderna, European Union Innovative Medicine Initiative, Certa, Chinook, amfAR, Angion Pharmaceuticals, RenalytixAI, Travere Therapeutics, Regeneron, IONIS Pharmaceuticals, and Maze Therapeutics; and consulting fees through the University of Michigan from Astellas, Poxel, Janssen, and Novo Nordisk; and serves on the NIH–National Center for Advancing Translational Sciences Council and the Nephcure Kidney International Board. MK and WJ have a patent— PCT/EP2014/073413 “Biomarkers and methods for progression prediction for chronic kidney disease”—licensed. SE reports receiving funding through the University of Michigan from AstraZeneca, Novo Nordisk, Eli Lilly, Janssen, and Gilead for this study; and unrelated support from Ionis, Moderna, American Foundation for AIDS Research, Certa, and Chinook. UDP reports serving on the Board of Directors of Kidney Health Initiative. WJ reports serving as co-investigator on grants funded by Gilead Sciences, Novo Nordisk, AstraZeneca, Jannsen, and Eli Lilly. UDP reports serving on the Board of Directors of Kidney Health Initiative and Goldfinch Bio, Board of Directors (non-voting member). AR, TS, IH, SM, JMW, and RB report being employees of AstraZeneca, and JMW and UDP report being shareholders of AstraZeneca. SSB, JTL, and UDP report being employees and shareholders of Gilead. JTL reports receiving consulting fees from GyanRx Sciences and Aerovate Therapeutics, unrelated to this work. SSB reports owning stock in Agios Pharmaceuticals. CMQ reports being an employee and shareholder of Vifor Pharma. JDW and AK reports being employees of Novo Nordisk, and JDW reports being a shareholder of Novo Nordisk. KLD reports being an employee of Eli Lilly, and Drs. Breyer and Duffin report being stockholders of Eli Lilly. MDB and MCM report being employees and shareholders of Johnson & Johnson. LB reports receiving funding, outside this work, from NephCure; receiving consulting fees from Vertex, Sangamo, and Protalix; being a member of the steering and clinical trials committees of the International Society of Glomerular Diseases, and being a member of the scientific advisory boards of NephCure and Vertex. JBH reports receiving funding through the NIH, outside of the current work. All the other authors declared no competing interests. All the other authors report having no personal relationships that could have appeared to influence the work reported in this paper.

Figures

Figure 1 |
Figure 1 |. Unbiased kidney transcriptomics stratification identified 4 inherent subgroups of patients (“molecular categories”) within a chronic kidney disease (CKD) cohort.
Molecular categories were present at different CKD stages and histopathologic diagnoses, providing orthogonal biomechanistic information regardless of the disease etiology or severity. (a) Self-Organizing Maps (SOM) of a CKD population based on kidney gene expression profiling. Individual patients (shown as open circles) were arranged in a topological order by similarities of their multivariable transcriptomics profiles. (b) Clustering of similar SOM units identified subgroups of similar patients. Thick lines indicate cluster boundaries. Clusters were assigned colors arbitrarily. (c) Group-level summarized transcriptomics profiles (“expression portraits”) show distinct patterns among the molecular categories. The color scale reflects relative gene expression levels (red—high; blue—low; green—average) of 8454 transcripts mapped. (d,e) Mosaic plots show the correspondence between molecular categorization and CKD stages and histopathologic diagnoses, respectively. The width of the bands reflects the relative proportions of cases. DN, diabetic nephropathy; FSGS, focal segmental glomerulosclerosis; HT, hypertensive nephrosclerosis; IgAN, IgA nephropathy; MCD, minimal change disease; RPGN, rapidly progressive glomerulonephritis; SLE, systemic lupus erythematosus; TMD, thin basement membrane disease.
Figure 2 |
Figure 2 |. Heterogeneity of individual chronic kidney disease (CKD) transcriptomics profiles and reclassification based on molecular similarity independently from the conventional categories.
(a) Principle of molecular reclassification illustrated. Individual patients’ kidney gene expression profiles demonstrate marked heterogeneity, even within the same diagnostic groups. Genes are represented in a fixed order on a grid to enable visual comparisons between samples. The color scale reflects gene expression levels relative to the population average (red—high; blue—low; green—average). (b) Examples of individual patients’ kidney gene expression profiles from the CKD-Gold molecular category presenting with different estimated glomerular filtration rate (eGFR) levels. DN, diabetic nephropathy; FSGS, focal segmental glomerulosclerosis; IgAN, IgA nephropathy.
Figure 3 |
Figure 3 |. Chronic kidney disease (CKD) molecular categories differ from healthy kidney transcriptomics profile and are biologically distinct.
(a) Volcano plots show differential gene expression analysis results (log-fold changes by statistical significance) per each molecular category, contrasted with that of healthy controls (living kidney donors, N = 46). Each point represents a gene. Significantly modulated genes (q < 0.0001) are highlighted in category-specific colors. The vertical dotted lines indicate zero-fold change. (b) Heatmap of gene set–enrichment analysis results. The 5205 gene sets (columns) were tested in each CKD molecular category (rows). The colors reflect normalized enrichment score (NES) values (maroon—positive; blue—negative) per gene set. The color bar indicates the respective molecular category (Olive, Gold, Plum, Blue). Hierarchical clustering groups similar gene sets. (c,d) Venn diagrams show overlaps in significantly enriched (false discovery rate q < 0.05) upregulated and downregulated gene sets, respectively, demonstrating the presence of shared and unique pathways between CKD molecular categories. (e) Transcription regulator analysis. Activation Z-score for the top-20 endogenous upstream regulators per CKD molecular category (orange—activated; green—inhibited). (f) Heatmap of hypothesis-driven enrichment analysis showing enrichment scores for CKD-relevant gene sets (kidney cell–type specific signatures, Mendelian genes known to cause kidney phenotypes, genes with kidney-enriched expression).
Figure 4 |
Figure 4 |. Chronic kidney disease (CKD) molecular categorization in independent patient cohorts.
(a) Clinical Phenotyping Resource and Biobank Core (C-PROBE) cohort patients (N = 42) mapped onto the trained, discovery Self-Organizing Maps (SOM); individual patients are shown as red triangles. (b) Nephrotic Syndrome Study Network (NEPTUNE-NS) cohort patients (N = 107) mapped onto the trained, discovery SOM; individual patients are shown as blue diamonds. (c) Waffle charts show relative proportions of patients assigned to the different molecular categories in the validation CKD cohorts (1 square = 1%). (d) Mosaic plot showing the CKD-stage (1–5) breakdown by molecular category in the C-PROBE cohort. (e) Mosaic plot showing the CKD-stage (1–4) breakdown by molecular category in the NEPTUNE-NS cohort. (f) A randomly chosen individual gene example, TMSB10, demonstrating consistency of the expression pattern across CKD molecular categories in independent cohorts. (g) Diabetic kidney disease (DKD) patients (N = 72) mapping onto the discovery SOM; plotting symbol shapes indicate the corresponding studies: square—European Renal cDNA Bank (ERCB) DKD; diamond—GSE30122; triangle pointing up—Levin et al. (2020); triangle pointing down—GSE142025.
Figure 5 |
Figure 5 |. Chronic kidney disease (CKD) molecular (Mol.) categorization and disease progression.
(a) Kaplan–Meier curves of end-stage kidney disease (ESKD) incidence by CKD molecular category in the Clinical Phenotyping Resource and Biobank Core (C-PROBE) study. Statistical significance of differences was tested using the log-rank test. (b) Prospective slope of estimated glomerular filtration rate (eGFR, ml/min per 1.73 m2 per year, by CKD molecular category at baseline in C-PROBE. Boxplots show median values per molecular class; whiskers indicate interquartile range. Dotted horizontal line denotes zero (no change in eGFR over time). (c) Kaplan–Meier curves of composite ESKD or 40% eGFR drop outcome incidence by CKD molecular category in Nephrotic Syndrome Study Network (NEPTUNE). Statistical significance of differences was tested using the log-rank test. (d) Density plots of distributions of correlation coefficients for CKD molecular category enriched gene correlations with interstitial fibrosis and tubular atrophy (IFTA) values in the NEPTUNE cohort. (e) Boxplots of tubular atrophy levels stratified by patients’ CKD molecular category (interstitial fibrosis data show an identical trend—Supplementary Figure S8).
Figure 6 |
Figure 6 |. Biomarker profiles of chronic kidney disease (CKD) molecular categories.
(a) Gradient plots showing kidney expression levels of genes encoding known kidney injury biomarkers overlayed on the discovery Self-Organizing Maps (SOM; European Renal cDNA Bank [ERCB] CKD cohort). Colors reflect the averaged gene expression levels (blue—low; red—high) of the patients mapped to the specific SOM unit. (b) Urine levels of the same kidney injury markers in the Clinical Phenotyping Resource and Biobank Core (C-PROBE) cohort stratified by CKD molecular class. (c) Volcano plot showing differential abundance analysis of urinary proteins in CKD molecular categories versus controls in the C-PROBE cohort. (d) Heatmap of the top-25 urinary proteins differentiating CKD-Gold versus other molecular categories. (e) Sparce partial least-squares scores plot showing clustering of CKD-Gold versus other molecular categories, based on the 25 urinary proteins. (f) Area under the curve (AUC) receiver operating characteristic plot for discrimination of CKD-Gold versus other molecular categories, based on the urine 25-protein signature.

References

    1. Jager KJ, Kovesdy C, Langham R, et al. A single number for advocacy and communication—worldwide more than 850 million individuals have kidney diseases. Nephrol Dial Transplant. 2019;34:1803–1805. - PubMed
    1. Bikbov B, Purcell CA, Levey AS, et al. Global, regional, and national burden of chronic kidney disease, 1990–2017: a systematic analysis for the Global Burden of Disease Study 2017. Lancet. 2020;395:709–733. - PMC - PubMed
    1. Carney EF. The impact of chronic kidney disease on global health. Nat Rev Nephrol. 2020;16:251. - PubMed
    1. Chapter 1: Definition and classification of CKD. Kidney Int Suppl (2011). 2013;3:19–62. - PMC - PubMed
    1. Eckardt K-U, Coresh J, Devuyst O, et al. Evolving importance of kidney disease: from subspecialty to global health burden. Lancet. 2013;382:158–169. - PubMed

MeSH terms