. 2024 Mar 6;44(10):e1202232023.
doi: 10.1523/JNEUROSCI.1202-23.2023.

Cumulative Effects of Resting-State Connectivity Across All Brain Networks Significantly Correlate with Attention-Deficit Hyperactivity Disorder Symptoms

Affiliations

Cumulative Effects of Resting-State Connectivity Across All Brain Networks Significantly Correlate with Attention-Deficit Hyperactivity Disorder Symptoms

Michael A Mooney et al. J Neurosci. .

Abstract

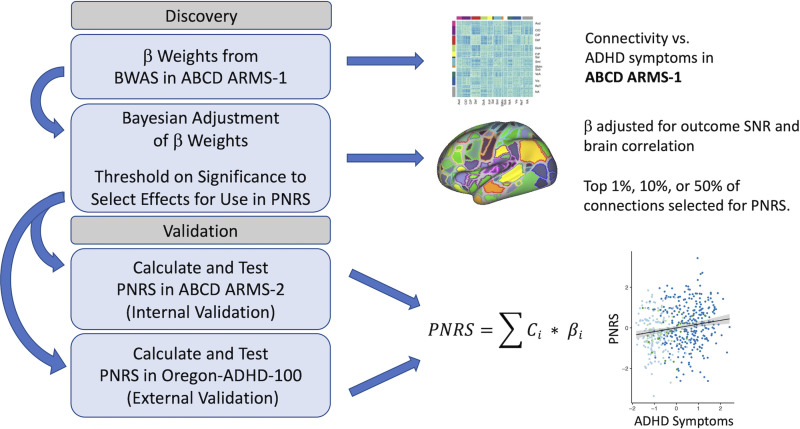
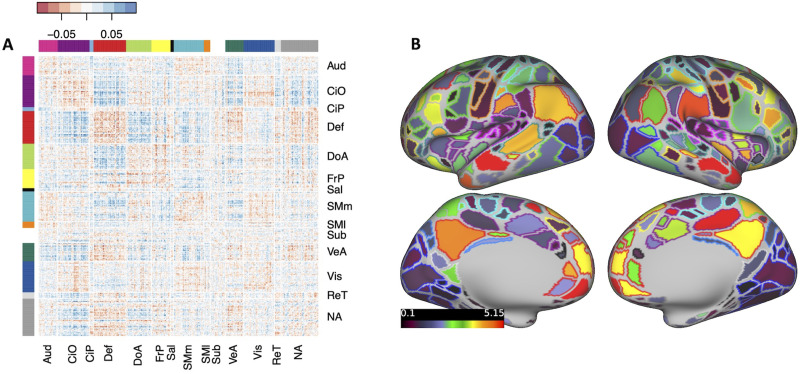
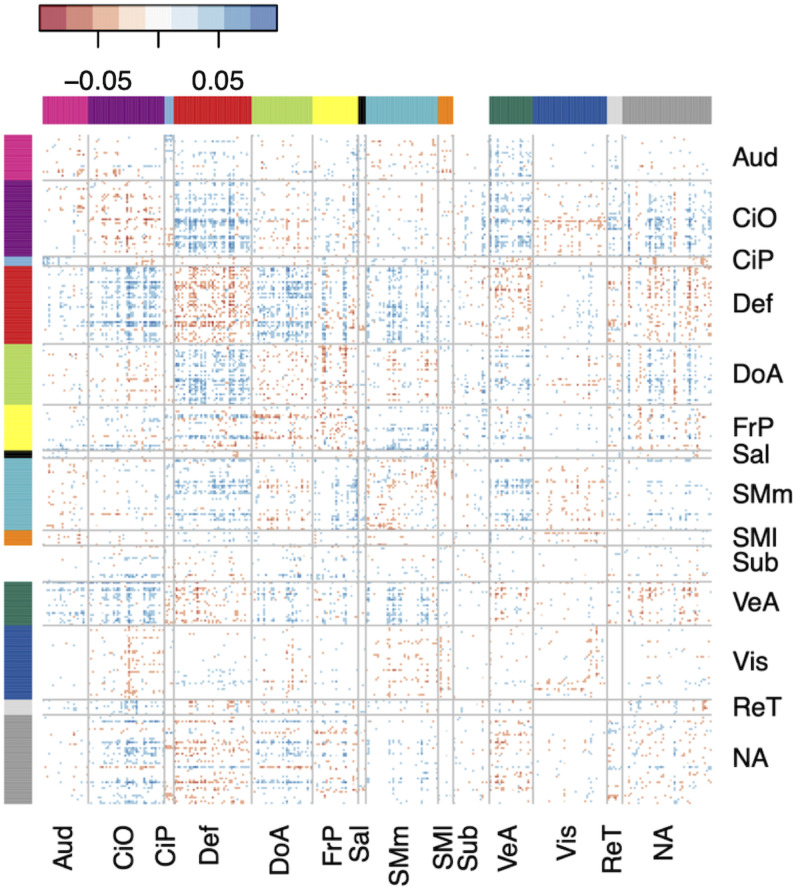
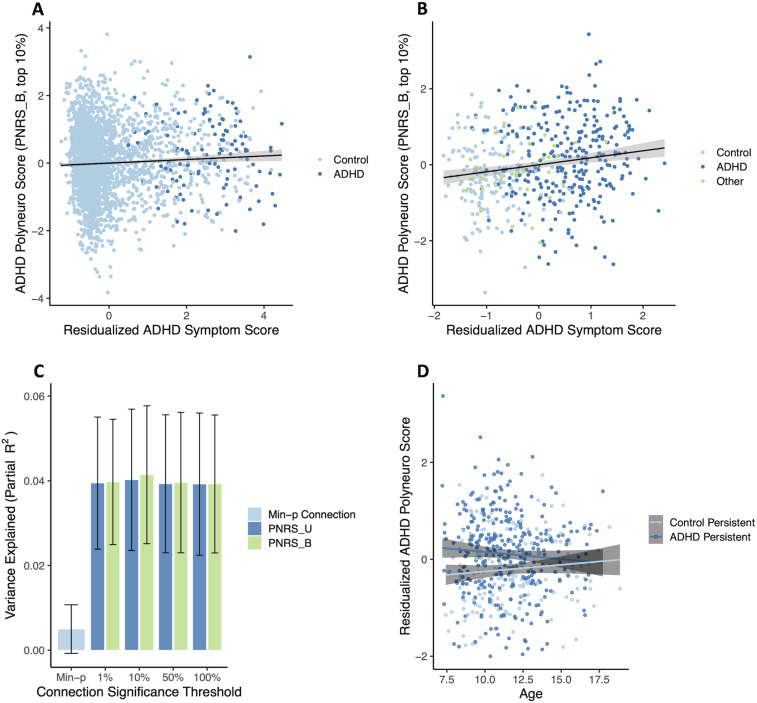
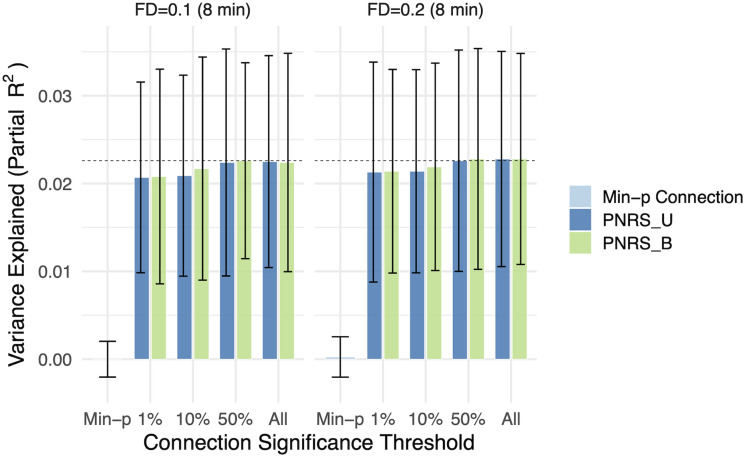
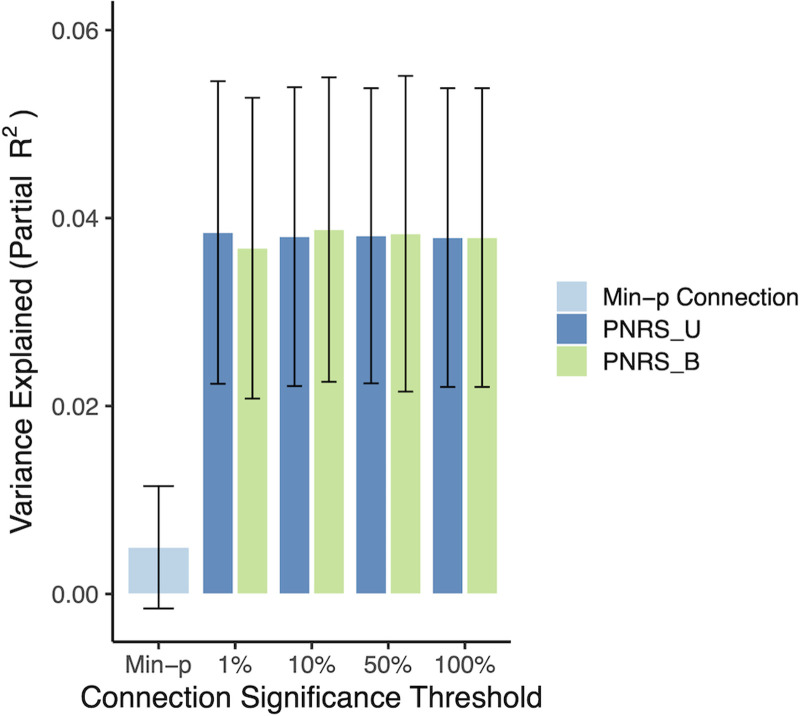
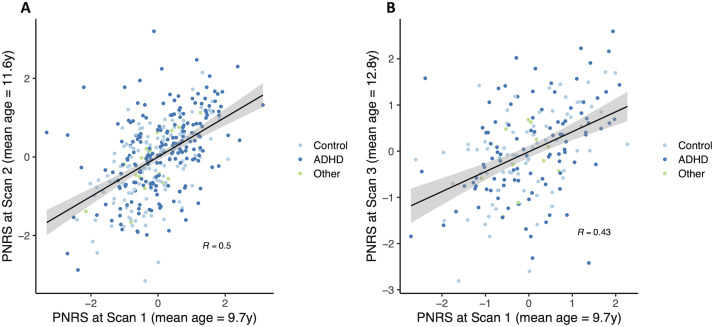
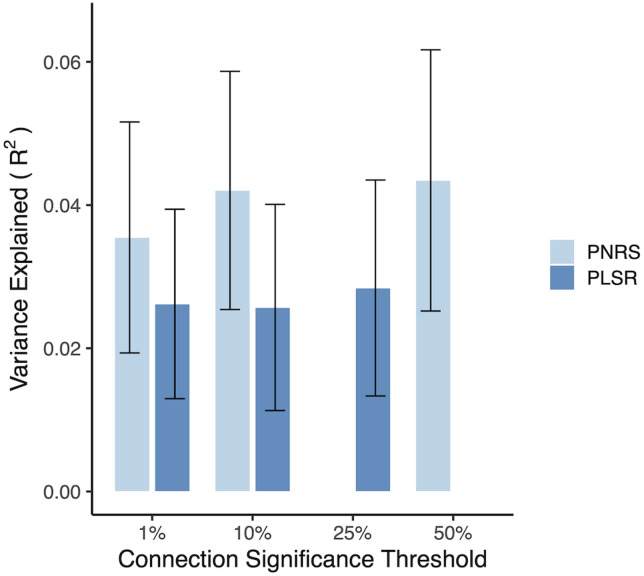
Identification of replicable neuroimaging correlates of attention-deficit hyperactivity disorder (ADHD) has been hindered by small sample sizes, small effects, and heterogeneity of methods. Given evidence that ADHD is associated with alterations in widely distributed brain networks and the small effects of individual brain features, a whole-brain perspective focusing on cumulative effects is warranted. The use of large, multisite samples is crucial for improving reproducibility and clinical utility of brain-wide MRI association studies. To address this, a polyneuro risk score (PNRS) representing cumulative, brain-wide, ADHD-associated resting-state functional connectivity was constructed and validated using data from the Adolescent Brain Cognitive Development (ABCD, N = 5,543, 51.5% female) study, and was further tested in the independent Oregon-ADHD-1000 case-control cohort (N = 553, 37.4% female). The ADHD PNRS was significantly associated with ADHD symptoms in both cohorts after accounting for relevant covariates (p < 0.001). The most predictive PNRS involved all brain networks, though the strongest effects were concentrated among the default mode and cingulo-opercular networks. In the longitudinal Oregon-ADHD-1000, non-ADHD youth had significantly lower PNRS (Cohen's d = -0.318, robust p = 5.5 × 10⁻⁴) than those with persistent ADHD (age 7-19). The PNRS, however, did not mediate polygenic risk for ADHD. Brain-wide connectivity was robustly associated with ADHD symptoms in two independent cohorts, providing further evidence of widespread dysconnectivity in ADHD. Evaluation in enriched samples demonstrates the promise of the PNRS approach for improving reproducibility in neuroimaging studies and unraveling the complex relationships between brain connectivity and behavioral disorders.

Keywords: MRI; attention-deficit hyperactivity disorder; brain-wide association study; polygenic score; polyneuro score; resting-state functional connectivity.


Figures

Figure 1.
Figure 1.
Polyneuro risk score (PNRS) discovery and validation workflow. Note the thresholding done to select connections used in the PNRS is based on significance determined in the discovery cohort.
Figure 2.
Figure 2.
Distribution of ADHD symptom scores in (A) both ARMS of ABCD (Mann–Whitney U test p-value = 0.916) and (B) the Oregon-ADHD-1000 case–control cohort. The ADHD composite symptom scores are the average of multiple standardized (mean = 0, SD = 1) symptom scales (see Materials and Methods).
Figure 3.
Figure 3.
Brain-wide connectivity associated with ADHD symptoms in the ABCD Study cohort. A, The matrix of standardized regression coefficients showing the strength of association between all connections (organized by brain network) and ADHD symptoms. B, Gordon parcellation showing the relative contribution of each brain network to the ADHD PNRS. Only the top 10% most significant connections (representing the most predictive PNRS) are considered. The fill color represents the sum of the absolute value of β weights for all connections in which a parcel participates; the outline color represents network assignment. Aud, auditory; CiO, cingulo-opercular; CiP, cingulo-parietal; Def, default mode; DoA, dorsal attention; FrP, frontoparietal; Sal, salience; SMm, somatomotor medial; SMl, somatomotor lateral; Sub, subcortical; VeA, ventral attention; Vis, visual; ReT, retrosplenial temporal; NA, not assigned.
Figure 4.
Figure 4.
The matrix of standardized regression coefficients showing the strength of association between the top 10% most significant connections (organized by brain network) and ADHD symptoms. The cumulative effect of these connections comprised the most predictive PNRS, demonstrating the brain-wide, distributed nature of the ADHD PNRS. Aud, auditory; CiO, cingulo-opercular; CiP, cingulo-parietal; Def, default mode; DoA, dorsal attention; FrP, frontoparietal; Sal, salience; SMm, somatomotor medial; SMl, somatomotor lateral; Sub, subcortical; VeA, ventral attention; Vis, visual; ReT, retrosplenial temporal; NA, not assigned.
Figure 5.
Figure 5.
ADHD polyneuro score associated with ADHD symptoms. Polyneuro scores and residualized ADHD symptom scores, after adjusting for relevant covariates (see Materials and Methods), for all subjects in the (A) ABCD ARMS-2 (N = 2,796) and (B) Oregon-ADHD-1000 cohort, using each subject’s earliest scan (N = 494). C, The proportion of ADHD symptom score variance explained in the Oregon cohort, by the single most significantly associated connection (Min-p); polyneuro scores comprised of the top 1%, 10%, and 50% most significant connections; and all connections (bootstrapped standard errors are shown). D, Subjects in the Oregon-ADHD-1000 cohort with persistent ADHD showed higher ADHD PNRS than controls (p = 0.00142), though this difference decreases with age. PNRS_U, unadjusted polyneuro score; PNRS_B, Bayesian-adjusted polyneuro score.
Figure 6.
Figure 6.
ADHD polyneuro scores were robust to the motion threshold. The proportion of ADHD symptom score variance explained is nearly identical when analyzing the same set of subjects (N = 2,863) using a more stringent motion threshold (FD threshold of 0.1 mm vs 0.2 mm). Bootstrapped standard errors are shown. PNRS_U, unadjusted polyneuro score; PNRS_B, Bayesian-adjusted polyneuro score.
Figure 7.
Figure 7.
The matrix of standardized, motion-adjusted regression coefficients showing the strength of association between the top 10% most significant connections (organized by brain network) and ADHD symptoms. The regression coefficients shown here are from a BWAS that included mean FD as a covariate. Aud, auditory; CiO, cingulo-opercular; CiP, cingulo-parietal; Def, default mode; DoA, dorsal attention; FrP, frontoparietal; Sal, salience; SMm, somatomotor medial; SMl, somatomotor lateral; Sub, subcortical; VeA, ventral attention; Vis, visual; ReT, retrosplenial temporal; NA, not assigned.
Figure 8.
Figure 8.
The proportion of ADHD symptom score variance explained in the Oregon cohort, by the single most significantly associated connection (Min-p); polyneuro scores comprised of the top 1%, 10%, and 50% most significant connections; and all connections. The results are shown for PNRS based on the BWAS that adjusted for mean FD. Bootstrapped standard errors are shown.
Figure 9.
Figure 9.
ADHD polyneuro scores measured in the same subject were significantly correlated when measured (A) approximately 2 years apart and (B) approximately 3 years apart.
Figure 10.
Figure 10.
The proportion of ADHD symptom score variance explained by both the PNRS and the PLSR model in the Oregon baseline cohort (without adjusting for covariates). Due to the computational complexity of the PLSR, that model was fit with a maximum of 25% of the most significant functional connections. Nevertheless, the two methods provide comparable predictive power across various connection inclusion thresholds, suggesting there is no meaningful benefit from the more complex PLSR model. Bootstrapped standard errors are shown.

References

    1. Adhikari BM, et al. (2018) Heritability estimates on resting state fMRI data using ENIGMA analysis pipeline. Pac Symp Biocomput Pac Symp Biocomput 23:307–318. 10.1142/9789813235533_0029 - DOI - PMC - PubMed
    1. Albajara Sáenz A, Villemonteix T, Massat I (2019) Structural and functional neuroimaging in attention-deficit/hyperactivity disorder. Dev Med Child Neurol 61:399–405. 10.1111/dmcn.14050 - DOI - PubMed
    1. Baurley JW, Edlund CK, Pardamean CI, Conti DV, Bergen AW (2016) Smokescreen: a targeted genotyping array for addiction research. BMC Genomics 17:145. 10.1186/s12864-016-2495-7 - DOI - PMC - PubMed
    1. Byington N, et al. (2023) Polyneuro risk scores capture widely distributed connectivity patterns of cognition. Dev Cogn Neurosci 60:101231. 10.1016/j.dcn.2023.101231 - DOI - PMC - PubMed
    1. Carey VJ (2019) gee: generalized estimation equation solver. Available at: https://CRAN.R-project.org/package=gee [Accessed September 15, 2021].

Publication types

LinkOut - more resources