. 2024 Apr;11(13):e2304991.
doi: 10.1002/advs.202304991. Epub 2024 Jan 29.

Melanoma Derived Exosomes Amplify Radiotherapy Induced Abscopal Effect via IRF7/I-IFN Axis in Macrophages

Affiliations

Melanoma Derived Exosomes Amplify Radiotherapy Induced Abscopal Effect via IRF7/I-IFN Axis in Macrophages

Lu Wang et al. Adv Sci (Weinh). 2024 Apr.

Abstract

Radiotherapy (RT) can induce tumor regression outside the irradiation field, known as the abscopal effect. However, the detailed underlying mechanisms remain largely unknown. A tumor-bearing mouse model is successfully constructed by inducing both subcutaneous tumors and lung metastases. Single-cell RNA sequencing, immunofluorescence, and flow cytometry are performed to explore the regulation of tumor microenvironment (TME) by RT. A series of in vitro assays, including luciferase reporter, RNA Pulldown, and fluorescent in situ hybridization (FISH) assays, are performed to evaluate the detailed mechanism of the abscopal effect. In addition, in vivo assays are performed to investigate combination therapy strategies for enhancing the abscopal effect. The results showed that RT significantly inhibited localized tumor and lung metastasis progression and improved the TME. Mechanistically, RT promoted the release of tumor-derived exosomes carrying circPIK3R3, which is taken up by macrophages. circPIK3R3 promoted Type I interferon (I-IFN) secretion and M1 polarization via the miR-872-3p/IRF7 axis. Secreted I-IFN activated the JAK/STAT signaling pathway in CD8+ T cells, and promoted IFN-γ and GZMB secretion. Together, the study shows that tumor-derived exosomes promote I-IFN secretion via the circPIK3R3/miR-872-3p/IRF7 axis in macrophages and enhance the anti-tumor immune response of CD8+ T cells.

Keywords: IRF7; I‐IFNs; abscopal effect; melanoma; radiotherapy.


Conflict of interest statement

The authors declare no conflict of interest.

Figures
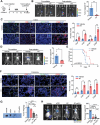
Figure 1
Figure 1
Effects of RT on the local tumor and distant lung metastases. A) Workflow of RT and bioluminescence imaging. B) Bioluminescence imaging showing the growth of subcutaneous melanoma tumors in the vehicle and RT groups, quantitatively analyzed based on bioluminescent signal intensity (n = 4) on day 7. C) Immunofluorescence analysis of CD4+ T cells, CD8+ T cells, NK cells (CD161C+ cells), and macrophages (CD68+ cells) infiltrating subcutaneous tumors in the vehicle and RT groups (n = 3) on day 7. D) Bioluminescence imaging depicting the growth of distant lung metastases in the vehicle and RT groups (n = 4) on day 18. E) Survival curves of mice in the vehicle and RT groups (n = 6). F) Immunofluorescence analysis of CD4+ T cells, CD8+ T cells, NK cells (CD161C+ cells), and macrophages (CD68+ cells) infiltrating distant lung metastases in the vehicle and RT groups (n = 3) on day 18. G) Measurement of subcutaneous tumor weight in each group to evaluate the therapeutic efficacy (n = 3). H) Evaluation of therapeutic efficacy by measuring the fluorescence intensity of lung metastases in mice using bioluminescence imaging (n = 6). Data are presented as mean ± SEM, * p < 0.05, ** p < 0.01, *** p < 0.001, **** p < 0.0001 by two‐tailed unpaired Student t‐test.
Figure 2
Figure 2
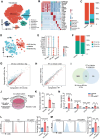
Irradiated melanoma cells promote M1 polarization and IRF7 expression of macrophages. A) t‐SNE plot illustrating the distribution of seven cell subpopulations. B) Heatmap depicting the expression levels of marker genes for each cell subpopulation. C) Percentage of different cell types in the vehicle and RT groups (n = 3). D) t‐SNE plot displaying the distribution of three macrophage subpopulations. E) Expression profile of marker genes in the three macrophage subpopulations. F) Percentage of the three macrophage subpopulations in the vehicle and RT groups. G) Volcano plot depicting differentially expressed genes between M1‐like macrophages and M2‐like macrophages, with log2FC > 0.45 and p‐value < 0.05. H) Volcano plot illustrating differentially expressed genes of melanoma cells between the vehicle and RT groups, with log2FC > 0.45 and p‐value < 0.05. I) Venn diagram displaying the overlapping differentially expressed genes upregulated in both RT‐treated melanoma cells and M1‐like macrophages. J) Schematic representation of the co‐culture model of macrophages and RT‐treated melanoma cells. K) qRT‐PCR analysis of IRF7 expression in macrophages. L,M) FCM analysis of CD80 and CD86 expression in macrophages. N) qRT‐PCR analysis of IL‐1β, TNF‐α, IFN‐α, and IFN‐β expression in macrophages. Data in (J–M) are presented as mean ± SEM, n = 3. * p < 0.05, ** p < 0.01, *** p < 0.001, **** p < 0.0001 by two‐tailed unpaired Student t‐test.
Figure 3
Figure 3
Irradiated melanoma‐derived exosomes induce macrophage M1 polarization via upregulating IRF7. A) Electron microscopy and NTA analysis of exosomes released by vehicle and RT‐treated melanoma cells. B) Uptake of DiO‐labeled exosomes released by melanoma cells by macrophages. C) qRT‐PCR analysis of IRF7 expression in macrophages induced by exosomes released from RT‐treated melanoma cells. D) FCM analysis of CD86 expression on the cell surface of macrophages induced by exosomes released from RT‐treated melanoma cells. E) qRT‐PCR analysis of IL‐1β, TNF‐α, IFN‐α, and IFN‐β expression in macrophages induced by exosomes released from RT‐treated melanoma cells. F) qRT‐PCR analysis of IRF7 expression in macrophages after treatment with GW4869. G) FCM analysis of CD86 expression on the cell surface of macrophages after treatment with GW4869. H) qRT‐PCR analysis of IL‐1β, TNF‐α, IFN‐α, and IFN‐β expression in macrophages after treatment with GW4869. Data in (C–H) are presented as mean ± SEM, n = 3. * p < 0.05, ** p < 0.01, *** p < 0.001, **** p < 0.0001 by two‐tailed unpaired Student t‐test.
Figure 4
Figure 4
Exosomal circPIK3R3 promotes M1 polarization via upregulating IRF7 in macrophages. A) Heatmap displaying differentially expressed circRNAs in subcutaneous tumors of vehicle and RT groups, with logFC > 1.5 and p_adjust < 0.05 (n = 3). B) Comparison with the circBase circular RNA database revealed that out of the 1266 circRNAs detected by whole transcriptome sequencing in subcutaneous tumors of mice, 29 differentially expressed circRNAs in the RT group had corresponding identifiers and sequences in the circBase database. Venn diagram shows that seven up‐regulated circRNAs in the subcutaneous tumors of the RT group had matching identifiers and sequences in the circBase database. C) qRT‐PCR analysis of differentially expressed circRNAs in subcutaneous tumors of vehicle and RT groups (n = 4). D) qRT‐PCR analysis of differentially expressed circRNAs in peripheral blood exosomes (n = 4). E) qRT‐PCR analysis of circPIK3R3 expression in RT‐treated melanoma cells. F) Expression of circPIK3R3 in macrophages co‐cultured with RT‐treated melanoma cells. G) Expression of circPIK3R3 in exosomes derived from RT‐treated melanoma cells. H) Sanger sequencing revealing the back‐splicing site of circ_0011074. I) qRT‐PCR analysis of IRF7 expression in macrophages overexpressing circPIK3R3. J,K) FCM analysis of CD80 and CD86 expression in macrophages overexpressing circPIK3R3. L) qRT‐PCR analysis of IL‐1β, TNF‐α, IFN‐α, and IFN‐β expression in macrophages overexpressing circPIK3R3. Data are presented as mean ± SEM, n = 3. * p < 0.05, ** p < 0.01, *** p < 0.001, **** p < 0.0001 by Student's t‐test.
Figure 5
Figure 5
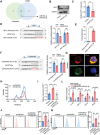
CircPIK3R3 upregulates IRF7 expression via sponging miR‐872‐3p. A) Venn diagram displaying the miRNAs that target IRF7 according to TargetScan and miRBD databases. B,C) Western blot and qRT‐PCR analysis examining the effect of miR‐872‐3p overexpression on IRF7 expression. D) Binding sites of miR‐872‐3p with IRF7. Dual‐luciferase reporter gene assay was performed to assess the binding relationship between miR‐872‐3p and IRF7. E) RNA Pull‐down assay detecting the expression level of CircPIK3R3 bound to biotinylated miR‐872‐3p probe. F) Binding sites of CircPIK3R3 with miR‐872‐3p. Dual‐luciferase reporter gene assay was conducted to evaluate the binding relationship between CircPIK3R3 and miR‐872‐3p. G) FISH analysis revealing the spatial relationship between CircPIK3R3 and miR‐872‐3p in Raw264.7 cells. H) Fluorescence signal quantifification according to the location of circPIK3R3 and miR‐872‐3p in (G). I) qRT‐PCR analysis of IRF7 expression in Raw264.7 cells treated with Vector, circPIK3R3, and circPIK3R3+miR‐872‐3p. J,K) FCM analysis of CD80 and CD86 expression in Raw264.7 cells treated with Vector, circPIK3R3, and circPIK3R3+miR‐872‐3p. L) qRT‐PCR analysis of IL‐1β, TNF‐α, IFN‐α, and IFN‐β expression in Raw264.7 cells treated with Vector, circPIK3R3, and circPIK3R3+miR‐872‐3p. Data are presented as mean ± SEM, n = 3. * p < 0.05, ** p < 0.01, *** p < 0.001, **** p < 0.0001 by Student's t‐test (C–F) and two‐tailed unpaired Student t‐test (I–K).
Figure 6
Figure 6
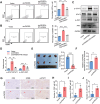
CircPIK3R3 promotes macrophage I‐IFN secretion to induce CD8+ T cell activation. A,B) FCM analysis of IFN‐γ and GZMB expression in CD8+ T cells co‐cultured with macrophages. C,D) Western blot analysis showing the activation of the JAK1‐STAT1 pathway in CD8+ T cells co‐cultured with macrophages. E) Subcutaneous tumor model assessing the impact of circPIK3R3 on melanoma growth by measuring tumor weight (n = 4). (F) qRT‐PCR detection of CircPIK3R3 expression in peripheral blood exosomes of mice (n = 3). G–J) Immunohistochemical examination of CD8+ T cell infiltration, GZMB expression, and p‐STAT1 expression in melanoma tissues. Data are presented as mean ± SEM, n = 3. * p < 0.05, ** p < 0.01, *** p < 0.001, **** p < 0.0001 by two‐tailed unpaired Student t‐test (A–D) and Student's t‐test (E–J).
Figure 7
Figure 7
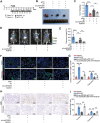
CircPIK3R3/IRF7/I‐IFN axis participates in the combination of radiotherapy and anti‐PD1 mediated abscopal effect. A) The treatment model involving RT, anti‐PD1, and RO8191: C57/BL6 mice were subcutaneously inoculated with 1 × 10⁶ sh‐NC B16F10 cells or sh‐circ‐0011074 B16F10 cells. On day 5, C57/BL6 mice were intravenously injected with 1 × 10⁶ B16F10‐luc cells. Starting from day 6, mice were administered the IFN receptor agonist RO8191 via daily intraperitoneal injections at a dose of 1 mg kg−1. On day 7, radiotherapy was initiated, with a daily dose of 8 Gy administered for 3 consecutive days. On day 7, mice were also administered anti‐PD1 via intraperitoneal injection every 2 days at a dose of 100 µg/mouse until the endpoint of observation. B,C) Measurement of subcutaneous tumor weight in each group to assess treatment efficacy (n = 3). D,E) Evaluation of fluorescent intensity in lung metastatic foci using bioluminescence imaging to assess treatment efficacy (n = 6). F,G) Immunohistochemical examination of CD8+ T cell infiltration in subcutaneous tumors and lung metastatic foci (n = 3). H,I) Immunofluorescence detection of IRF7+ macrophage infiltration in subcutaneous tumors and lung metastatic foci (n = 3). Data are presented as mean ± SEM. * p < 0.05, ** p < 0.01, *** p < 0.001, **** p < 0.0001 by two‐tailed unpaired Student t‐test.
Figure 8
Figure 8
A schematic diagram depicting the biological function and mechanism of circPIK3R3 in RT‐induced abscopal effect in melanoma.

References

    1. Siegel R. L., Miller K. D., Jemal A., CA Cancer J. Clin. 2018, 68, 7. - PubMed
    1. Proietti I., Skroza N., Bernardini N., Tolino E., Balduzzi V., Marchesiello A., Michelini S., Volpe S., Mambrin A., Mangino G., Romeo G., Maddalena P., Rees C., Potenza C., Cancers 2020, 12, 2801. - PubMed
    1. Zhong J., Yan W., Wang C., Liu W., Lin X., Zou Z., Sun W., Chen Y., Curr. Treat. Options Oncol. 2022, 23, 1503. - PMC - PubMed
    1. Weiss S. A., Wolchok J. D., Sznol M., Clin. Cancer Res. 2019, 25, 5191. - PMC - PubMed
    1. Mameghan H., Knittel T., Med. J. Aust. 1988, 149, 474. - PubMed