. 2024 Jan 29;15(1):750.
doi: 10.1038/s41467-024-44836-9.

Dorsal hippocampus to nucleus accumbens projections drive reinforcement via activation of accumbal dynorphin neurons

Affiliations

Dorsal hippocampus to nucleus accumbens projections drive reinforcement via activation of accumbal dynorphin neurons

Khairunisa Mohamad Ibrahim et al. Nat Commun. .

Abstract

The hippocampus is pivotal in integrating emotional processing, learning, memory, and reward-related behaviors. The dorsal hippocampus (dHPC) is particularly crucial for episodic, spatial, and associative memory, and has been shown to be necessary for context- and cue-associated reward behaviors. The nucleus accumbens (NAc), a central structure in the mesolimbic reward pathway, integrates the salience of aversive and rewarding stimuli. Despite extensive research on dHPC→NAc direct projections, their sufficiency in driving reinforcement and reward-related behavior remains to be determined. Our study establishes that activating excitatory neurons in the dHPC is sufficient to induce reinforcing behaviors through its direct projections to the dorso-medial subregion of the NAc shell (dmNAcSh). Notably, dynorphin-containing neurons specifically contribute to dHPC-driven reinforcing behavior, even though both dmNAcSh dynorphin- and enkephalin-containing neurons are activated with dHPC stimulation. Our findings unveil a pathway governing reinforcement, advancing our understanding of the hippocampal circuity's role in reward-seeking behaviors.


Conflict of interest statement

The authors declare no competing interests.

Figures
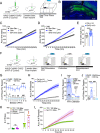
Fig. 1
Fig. 1. Stimulation of dHPC CaMKII+ neurons drives reinforcing behavior.
A Schematic illustrating real-time place test (RTPT) protocol. B Representative 10x magnification image of the viral expression and fiber placement in the dHPC. C, D ChR2 mice (n = 16) increased their preference for the stimulation-paired compartment within the session (Two-way ANOVA, F1,15 = 21.56, p = 0.0003), while control did not (n = 14; Two-way ANOVA, F1,13 = 4.386, p = 0.0564). E ChR2 mice (blue) demonstrated a significant preference for (two-tailed t-test, ChR2 vs 50% of time: t15 = 6.967, $$$$ p < 0.0001) and spent more time in the stimulation-paired compartment than control (grey) (two-tailed t-test: t28 = 4.372, ***p = 0.0002). F Schematic outlining self-stimulation protocol. G ChR2 mice (blue; n = 11), but not control (grey; n = 11), sought and maintained dHPC stimulation for 10 acquisition sessions (Two-way ANOVA, ChR2 vs Ctrl: F3,40 = 28.35, p < 0.0001 with Tukey’s multiple comparisons; * Active vs Inactive ChR2 groups; # ChR2 vs Ctrl Active groups). H ChR2 mice (blue) sought dHPC stimulation throughout the last session at a significantly higher level than control (grey; Two-way ANOVA, ChR2 vs Ctrl: F1,19 = 33.84, p < 0.0001 with Sidak’s multiple comparisons). I Uncoupling active inset with dHPC stimulation (laser turned OFF) resulted in ChR2 (blue; n = 11) mice to extinguish their seeking behavior while control mice (grey; n = 11) were unaffected (Two-way ANOVA, ChR2 vs Ctrl: F3,42 = 27.08, p < 0.0001 with Tukey’s multiple comparisons indicating no significance during extinction sessions; * Active vs Inactive ChR2 groups; # ChR2 vs Ctrl Active groups). J ChR2 mice reinstate behavior (laser ON) with significantly higher active pokes compared to the inactive and control active pokes (n = 11; One-way ANOVA, F3,40 = 18.33, p < 0.0001 with Tukey’s multiple comparison). K Mice significantly increase the number of active pokes in the absence of the TO and max criteria (n = 11; Two-way ANOVA, F1,11 = 31.10, p = 0.0002 with Sidak’s multiple comparisons). L The accumulation of rewards is significantly higher in the absence of TO and max stimulations (Two-way ANOVA, F1,11 = 14.12, p = 0.0032 with Sidak’s multiple comparisons). Data are expressed as mean ± S.E.M.
Fig. 2
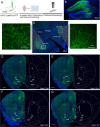
Fig. 2. Viral tracing of dHPC CaMKII+ fibers in the NAc and its surrounding areas.
A Schematic illustrating experimental protocol to determine the anatomical dHPC projections to the NAc (created with BioRender.com). B Representative images of viral expression in the dHPC (10x magnification), and (C) corresponding fiber terminals in the NAcSh at 10x and 20x magnification, highlighting fibers in the dorso-medial (dmNAcSh) and ventro-lateral (vlNAcSh) areas of the NAcSh. This viral expression was observed in all 5 mice that were injected. DG Overall tracing of dHPC CaMKII+ fibers in brain regions that are 1.18 mm to 1.78 mm away from Bregma. Scale bars represent 500 μm.
Fig. 3
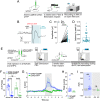
Fig. 3. Stimulation of dHPC excitatory neurons evoked neuronal activation in the dmNAcSh.
A Schematic outlining the protocol for evoked in-vivo local field potential (LFP) recording in the NAc. B Representative trace illustrating how the amplitude (amp) pre- and post-stimulation as well as latency to peak were calculated. The respective amplitude was calculated as the maximum voltage – minimum voltage within a 0.1 s window. The time between dHPC stimulation onset to the first evoked peak (Latency to peak) was calculated to determine direct input to NAc. C Stimulation of dHPCCaMKII+ neurons evoked a significant increase in LFP amplitude in the NAc (n = 56 electrodes; two-tailed Wilcoxon matched-pairs signed rank test, p < 0.0001). D Variability in latency to peak suggests that recorded NAc cells received both direct and indirect inputs from dHPCCaMKII+ neurons (n = 56 electrodes). E Experimental schematic of fiber photometry dmNAcSh recording with stimulation of dHPCCaMKII+ neurons in self-stimulation operant boxes. F Both ChR2-GCaMP ((n = 11) and ChR2-eYFP (n = 5) mice significantly sought for dHPC self-stimulation (Two-way ANOVA, Active vs Inactive: F1,16 = 184.7, p < 0.0001 with Sidak’s multiple comparisons). G An increase in calcium transients in the dmNAcSh upon optical self-stimulation of ChR2 expressing CaMKII+ neurons in the dHPC was only observed in ChR2-GCaMP mice (n = 11) but not in ChR2-eYFP mice (n = 5). H The peak Z-score obtained from mice expressing both ChR2 and GCaMP (n = 11) is significantly higher than control littermates expressing ChR2 and eYFP (n = 5) in the dmNAcSh (Peak z-score GCaMP vs eYFP: two-tailed Mann Whitney, p = 0.0055). I The measured calcium transients Area Under the Curve (AUC) in the dmNAcSh of ChR2-GCaMP mice upon self-stimulation (ChR2-GCaMP: 0:2) were significantly higher than their respective baseline (ChR2-GCaMP −2:0 vs 0:2 (n = 11): two-tailed Wilcoxon matched-pairs signed rank test, p = 0.002). Stimulation of the dHPC had no effect on the calcium transients AUC in the control group ChR2-eYFP −2:0 vs 0:2 (n = 5): two-tailed Wilcoxon matched-pairs signed rank test, p = 0.3125). Data are expressed as mean ± S.E.M.
Fig. 4
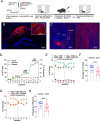
Fig. 4. Stimulation of dHPC-dmNAcSh projections is sufficient to drive reinforcement via glutamate transmission.
A Experimental schematic illustrating selective stimulation dHPCCaMKII+ neurons that project to the dmNAcSh. Briefly, mice were injected with a retrograde virus carrying Cre recombinase in the dmNAcSh, Cre-dependent ChR2 in the dHPC, and optic fibers were secured above the dHPC. After recovery, mice were exposed to self-stimulation protocol. B Representative images of viral expression and fiber placement in the dHPC at 10x and 20x magnification (insert). C During the first FR1 session mice (n = 12) discriminated between the active and inactive nose insets, and this behavior was maintained throughout the 10 training sessions. The seeking behavior was abolished within the 5 days of extinction during which interaction with the active inset was not associated with dHPC→dmNAcSh stimulation (laser turned OFF). Self-stimulation behavior resumed when the laser was turned back ON during a reinstatement test performed 24 h after the last extinction session (Two-way ANOVA, *Active vs Inactive: F1,11 = 32.14, p = 0.0001 with Sidak’s multiple comparisons). D Overall, the number of interactions with the active inset during the reinstatement test was significantly higher than interactions with the inactive inset during reinstatement and the active inset on the last day of extinction (n = 12; Two-way ANOVA, Session x Active vs Inactive: F1,11 = 29.70, p = 0.0002, Sidak’s multiple comparisons: Active vs Inactive during reinstatement: p < 0.0001; Last day Ext vs Reinstate active: p < 0.0001). E Experimental schematic to assess the necessity for dmNAcSh glutamatergic signaling in dHPC-induced reinforcing properties. F Within the first self-stimulation session, mice (n = 9) sought dHPC stimulation through persistent active nose pokes and maintained this behavior throughout the 7 training sessions (Two-way ANOVA, Active vs Inactive: F1,8 = 24.09, p = 0.0012 with Sidak’s multiple comparisons). G Local micro-infusion of AP5/CNQX cocktail (AMPA/NMDA antagonists) within the dmNAcSh 30 min before self-stimulation session significantly decreased active inset interactions as compared to aCSF micro-infusion (n = 9; Two-way ANOVA, Treatment x Active vs Inactive: F1,8 = 5.410, p = 0.0485 with Sidak’s multiple comparisons: Antagonist vs aCSF active: p = 0.046 and Antagonist vs aCSF inactive: p > 0.9999). Data are expressed as mean ± S.E.M.
Fig. 5
Fig. 5. dHPC-dmNAcSh projections modulate sucrose self-administration.
A Experimental schematic illustrating selective inhibition of dHPC neurons projecting to the dmNAcSh during sucrose self-administration. Once mice have acquired FR5 sucrose self-administration, they received 4 sessions of CNO or SAL injections 30 min before the start of sucrose self-administration test (FR5). The treatment groups were counterbalanced such that mice receiving CNO in the first 4 sessions received SAL in the last 4 sessions and mice receiving SAL in the first 4 sessions received CNO in the last 4 sessions. B Representative images of viral expression in the dHPC at 10x and 20x magnification (insert). C Representative images of the terminal fiber expression in the NAcSh at 10x (left) and 20x magnification (right). D Mice rapidly discriminated active from inactive nose pokes during acquisition sessions. Mice increased the number of active nose pokes to maintain the number of sucrose pellets (rewards) received as the schedule increased from FR1 to FR5 (n = 12; Two-way ANOVA, Session x Active vs Inactive: F2.415,26.57 = 78.66, p < 0.0001 with Tukey’s multiple comparisons * Active vs Inactive and # Active vs Reward). E Mice (n = 12) that received CNO (red filled symbols) decreased the number of active nose pokes compared to mice that received SAL. When the treatment was switched (sessions 5–8), mice that previously received CNO, increased their number of active nose pokes while mice that previously received SAL decreased their number of active nose pokes. F Pretreatment with CNO before sucrose self-administration significantly decreases the average number of active nose pokes compared to their respective SAL pretreatment sessions (n = 12; CNO vs Sal: two-tailed Wilcoxon matched-pairs signed rank test, p = 0.0005). G The number of sucrose pellets obtained during a session was also attenuated when mice received CNO pretreatment before sucrose self-administration (n = 12). H Pretreatment with CNO significantly decreases the average number of sucrose pellets compared to SAL pretreatment before a sucrose self-administration session (n = 12; CNO vs Sal: two-tailed Wilcoxon matched-pairs signed rank test, p = 0.001). Data are expressed as mean ± S.E.M.
Fig. 6
Fig. 6. dHPC CaMKII+ stimulation evoked response in both Dyn- and Enk-containing neurons in the dmNAcSh of behaving mice.
A Experimental schematic outlining fiber photometry recording in the dmNAcSh dynorphin (Dyn) or enkephalin (Enk) containing neurons with non-contingent (experimenter-induced) dHPC stimulation in the home cage. B Time course for the Z-scores of the evoked calcium transient in both Dyn and Enk containing neurons where the gray area represents dHPC stimulation. Stimulation of dHPC CaMKII+ neurons evoked increases in calcium transients in both Dyn (n = 11) and Enk (n = 12) containing neurons in the dmNAcSh. C The peak Z-score during the 2 s of dHPC stimulation was similar between dmNAcSh Dyn (n = 11) and Enk (n = 12) containing neurons (Dyn vs Enk: two-tailed Mann Whitney, p = 0.1335). D Area under the Curve (AUC) for Z-scores obtained in experimental groups demonstrate that both calcium transients recorded from Dyn (n = 11) and Enk (n = 12) containing neurons significantly increase during stimulation (0:2) compared to their respective baseline (−2:0) (two-tailed t-test; Dyn −2:0 vs 0:2: t10 = 6.155, p = 0.0001; Enk −2:0 vs 0:2: t11 = 4.430, p = 0.001). Data are expressed as mean ± S.E.M.
Fig. 7
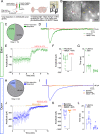
Fig. 7. Ex vivo electrophysiological stimulation of dHPCCaMKII+ terminals in the dmNAcSh evoked responses in both Dyn- and Enk-containing neurons.
A Experimental schematic outlining ex vivo electrophysiology experiments in Dyn+ and Enk+ cre mice (created with BioRender.com). B Representative images of a single cell patched under a light microscope (left) which is identified as mCherry positive using 570 nm LED fluorescence (right). The glass pipette is outlined by a dotted red line. C 47.4% of Enk+ cells patched responded to wide-field 470 nm stimulations, indicating that they received a monosynaptic input from dHPCCaMKII+ neurons. D Representative trace of the Enk+ cells with 470 nm stimulation (indicated by the blue line above the traces) in the presence of picrotoxin in the bath. E The average evoked amplitude for all Enk+ cells was abolished when glutamatergic blockers (NBQX + AP5) were bath applied suggesting it is glutamatergic input. F The amplitude of evoked activation in the presence of NBQX + AP5 was significantly lower compared to the presence of only picrotoxin in the bath (n = 9 cells; two-tailed t-test, t8 = 3.993, **p = 0.004). G The average latency of synaptic current onset and jitter (variability in synaptic timing) show slight variation consistent with a monosynaptic connection (n = 9 cells). H 14.06% of Dyn+ cells that were patched responded to wide-field 470 nm stimulations and were predominately located in the dorsal region of the dmNAcSh. I Representative trace of the Dyn+ cells with 470 nm stimulation (indicated by the blue line above the traces) in the presence of GABAergic (bicuculline) and glutamatergic (NBQX and AP5) blockers. J The average evoked amplitude for all Dyn+ cells was mainly abolished when bicuculline were bath applied, and any remaining responses were subsequently blocked with NBQX + AP5 in the bath. This indicates that their activation is primarily driven by GABAergic signaling, with a limited contribution from glutamatergic input from the dHPC. K The amplitude of evoked activation in the presence of bicuculline was significantly lower compared to baseline (n = 8 cells; One-way ANOVA, F2,17 = 4.634, p = 0.0248 with Tukey’s multiple comparison). L The average latency of the synaptic current onset and jitter suggest the presence of both monosynaptic and polysynaptic responses (n = 9 cells). Data are expressed as mean ± S.E.M.
Fig. 8
Fig. 8. Dynorphin-containing neurons in the dmNAcSh participate in the reinforcing properties of dHPC CaMKII+ stimulation.
A Experimental schematic outlining silencing Dyn or Enk containing neurons in the dmNAcSh during dHPC self-stimulation. All mice were exposed to 4 saline pretreatment and 4 CNO pretreatment sessions after acquiring the operant behavior. B Silencing Dyn-containing neurons within the dmNAcSh significantly reduces dHPC self-stimulation (n = 8; Dyn+ Sal vs Dyn+ CNO active: Two-way ANOVA, F1,14 = 6.938, p = 0.0196 with Sidak’s multiple comparisons). C Silencing Enk containing neurons within the dmNAcSh had no effect on dHPC self-stimulation (n = 9; Enk+ Sal vs Enk+ CNO active: Two-way ANOVA, F1,16 = 0.1073, p = 0.7475 with Sidak’s multiple comparisons). D Overall, the number of stimulations is significantly attenuated when dmNAcSh Dyn containing neurons (n = 8) are selectively silenced, uncovering the role of those neurons in modulating dHPC CaMKII+-induced reinforcement (two-tailed t-test; Sal vs CNO: Dyn, t7 = 2.939, p = 0.0217; Enk, t8 = 0.4428, p = 0.6696; n = 9). Data are expressed as mean ± S.E.M.
Fig. 9
Fig. 9. Schematic detailing the projections from dHPC CaMKII+ neurons to the Dyn- and Enk-containing neurons in the dmNAcSh.
A Our findings suggest that there is a differential connectivity pattern between the dHPC CaMKII+ neurons and the MSNs in the dmNAcSh. A strong monosynaptic input from the dHPC CaMKII+ neurons was mainly observed in the Enk neurons located in the ventral subregion of the dmNAcSh while a weaker input from the dHPC CaMKII+ neurons was found in the Dyn neurons in the dorsal subregion of the dmNAcSh. B Inhibiting dmNAcSh Dyn neurons, but not dmNAcSh Enk neurons, decreases dHPC CaMKII+ driven reinforcing behavior suggesting that the dHPC-dmNAcSh pathway’s role in reinforcement is mediated, at least in part, by Dyn neurons.

References

    1. Moser M-B, Moser EI, Forrest E, Andersen P, Morris R. Spatial learning with a minislab in the dorsal hippocampus. Proc. Natl Acad. Sci. 1995;92:9697–9701. doi: 10.1073/pnas.92.21.9697. - DOI - PMC - PubMed
    1. Strange BA, Witter MP, Lein ES, Moser EI. Functional organization of the hippocampal longitudinal axis. Nat. Rev. Neurosci. 2014;15:655–669. doi: 10.1038/nrn3785. - DOI - PubMed
    1. Yang AK, Mendoza JA, Lafferty CK, Lacroix F, Britt JP. Hippocampal input to the nucleus accumbens shell enhances food palatability. Biol. Psychiatry. 2020;87:597–608. doi: 10.1016/j.biopsych.2019.09.007. - DOI - PubMed
    1. Yoshida K, Drew MR, Mimura M, Tanaka KF. Serotonin-mediated inhibition of ventral hippocampus is required for sustained goal-directed behavior. Nat. Neurosci. 2019;22:770–777. doi: 10.1038/s41593-019-0376-5. - DOI - PubMed
    1. Yoshida K, et al. Chronic social defeat stress impairs goal-directed behavior through dysregulation of ventral hippocampal activity in male mice. Neuropsychopharmacology. 2021;46:1606–1616. doi: 10.1038/s41386-021-00990-y. - DOI - PMC - PubMed

Substances