. 2024 Jan 29;15(1):97.
doi: 10.1038/s41419-024-06477-0.

Regulation of ULK1 by WTAP/IGF2BP3 axis enhances mitophagy and progression in epithelial ovarian cancer

Affiliations

Regulation of ULK1 by WTAP/IGF2BP3 axis enhances mitophagy and progression in epithelial ovarian cancer

Jiao Wang et al. Cell Death Dis. .

Abstract

There is a pressing need for innovative therapeutic strategies for patients with epithelial ovarian cancer (EOC). Previous studies have shown that UNC-51-like kinase 1 (ULK1), a serine/threonine kinase, is crucial in regulating cellular autophagy and mitophagy across various tumor types. However, the clinical implications, biological functions, and potential mechanisms of ULK1 in EOC remain poorly understood. This study demonstrates that ULK1 expression is upregulated in EOC tissue samples and EOC cell lines, with increased ULK1 expression correlating with poor prognosis. Functionally, overexpressed ULK1 enhances the proliferation and migration abilities of EOC cells both in vitro and in vivo. Mechanistically, ULK1 was identified as an m6A target of WTAP. WTAP-mediated m6A modification of ULK1 enhanced its mRNA stability in an IGF2BP3-dependent manner, leading to elevated ULK1 expression and enhanced mitophagy in EOC. In summary, our research reveals that the WTAP/IGF2BP3-ULK1 axis significantly influences protective mitophagy in EOC, contributing to its progression. Therefore, the regulatory mechanisms and biological function of ULK1 identify it as a potential molecular target for therapeutic intervention in EOC.


Conflict of interest statement

The authors declare no competing interests.

Figures

Fig. 1
Fig. 1. ULK1 is overexpressed in EOC, and its elevated expression is associated with poor prognosis in EOC patients.
A, B Protein expression levels of ULK1 in 35 EOC and 26 normal ovarian tissues were detected by western blot. C The mRNA expression levels of ULK1 in 67 EOC and 50 normal ovarian tissues were detected using RT-qPCR. D Representative images of ULK1 IHC staining in EOC (n = 78), epithelial ovarian borderline tumor (n = 14), epithelial ovarian benign tumor (n = 6), and normal ovarian tissues (n = 5). E, F Kaplan–Meier plots for the OS and PFS of OV patients according to ULK1 expression. G The expression levels of ULK1 protein in human EOC cell lines A2780, ES-2, Caov-3, and OVCAR-3, and human normal ovarian epithelial cell line HOSEpiC were detected by western blot. ns not significant; *P < 0.05; **P < 0.01; ***P < 0.001.
Fig. 2
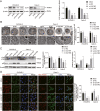
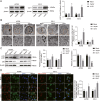
Fig. 2. ULK1 knockdown inhibits EOC cells mitophagy in vitro.
A The efficiency of ULK1 knockdown in OVCAR-3 and Caov-3 cell lines was evaluated through western blot. B Representative images of TEM showed the number of autophagosomes in OVCAR-3 and Caov-3 cells after ULK1 knockdown. C Protein expression levels of LC3B and p62 in OVCAR-3 and Caov-3 cells after ULK1 knockdown were detected by western blot. D Confocal microscopy images of MitoTracker Red staining and LC3 IF staining. ns not significant; *P < 0.05; **P < 0.01; ***P < 0.001.
Fig. 3
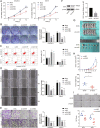
Fig. 3. ULK1 knockdown inhibits proliferation and migration of EOC cells in vitro and growth of xenograft tumors in vivo.
A Cell viability was detected by CCK-8 assays after ULK1 knockdown. B Colony formation assays were used to detect the proliferation of OVCAR-3 and Caov-3 cells after ULK1 knockdown. C Flow cytometry verified ULK1 functions in OVCAR-3 and Caov-3 cells apoptosis after ULK1 knockdown. D, E Cell scratch and transwell assays were used to detect cell migration after ULK1 knockdown. F Efficiency of ULK1 knockdown in ES-2 cell line was examined by western blot. G, H The tumor growth curve and the weight of xenograft tumors at the endpoints. I Representative images of IHC staining showed the expression of ULK1 and Ki67 of xenograft tumors. ns not significant; *P < 0.05; **P < 0.01; ***P < 0.001; ****P < 0.0001.
Fig. 4
Fig. 4. ULK1 overexpression promotes mitophagy of EOC cells in vitro.
A Efficiency of ULK1 overexpression in A2780 and ES-2 cell lines was evaluated through western blot. B Representative images of TEM showed the number of autophagosomes in A2780 and ES-2 cells after ULK1 overexpression. C Protein expression levels of LC3B and p62 in A2780 and ES-2 cells after ULK1 overexpression were detected by western blot. D Confocal microscopy images of MitoTracker Red staining and LC3 IF staining. ns not significant; *P < 0.05; **P < 0.01; ***P < 0.001.
Fig. 5
Fig. 5. ULK1 overexpression promotes proliferation and migration of EOC cells in vitro; mitophagy inhibitors can reverse these effects.
A Cell viability was detected by CCK-8 assays after ULK1 overexpression. B Colony formation assays were used to detect the proliferation of A2780 and ES-2 cells after ULK1 overexpression. C Flow cytometry verified ULK1 functions in A2780 and ES-2 cells apoptosis after ULK1 overexpression. D, E Transwell and cell scratch assays were used to detect cell migration after ULK1 overexpression. F, G Colony formation and transwell assays were used to detect the proliferation and migration of OVCAR-3 and ES-2 cells after treated with autophagy inhibitors 3-MA (5 mM) or CQ (30 μM) for 24 h. ns not significant; **P < 0.01; ***P < 0.001; ****P < 0.0001.
Fig. 6
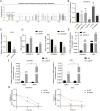
Fig. 6. The stability and expression of ULK1 are enhanced by WTAP mediated m6A modification.
A The predicted m6A modification sites in ULK1 pre-mRNA in the SRAMP database. B The ULK1 mRNA expression levels in si-NC, si-METTL3, si-METTL14, si-WTAP, si-FTO, and si-ALKBH5 OVCAR-3 cells were examined by RT-qPCR. C The ULK1 mRNA expression levels in si-NC and si-WTAP ES-2 cells were examined by RT-qPCR. D m6A levels in total RNA of OVCAR-3 and ES-2 cells after WTAP overexpression and WTAP knockdown were detected by m6A methylation quantification kit. E The direct interaction between ULK1 and WTAP was verified by RIP-qPCR assay in OVCAR-3 and ES-2 cells. F The enriched m6A modification of ULK1 in WTAP overexpression and control groups was detected by MeRIP-qPCR assay in OVCAR-3 and ES-2 cells. G After treatment of OVCAR-3 and ES-2 cells with ACD for 0, 3, and 6 h, ULK1 expression in sh-NC and sh-WTAP groups was detected by RT-qPCR. ns not significant; *P < 0.05; **P < 0.01; ***P < 0.001; ****P < 0.0001.
Fig. 7
Fig. 7. WTAP exerts oncogenic effects through ULK1-mediated mitophagy.
A Representative images of TEM showed the number of autophagosomes in OVCAR-3 and ES-2 cells. B Protein expression levels of LC3B and p62 in OVCAR-3 and ES-2 cells were detected by western blot assay. C Representative confocal microscopy images of MitoTracker Red staining and LC3 IF staining. D Cell viability was detected by CCK-8 assays. E Transwell assay was used to detect cell migration. F Flow cytometry was used to detect cell apoptosis. *P < 0.05; **P < 0.01; ***P < 0.001; ****P < 0.0001.
Fig. 8
Fig. 8. WTAP enhances the stability of ULK1 mRNA in an IGF2BP3 dependent manner.
A The ULK1 mRNA expression levels in si-NC, si-IGF2BP1, si-IGF2BP2, and si-IGF2BP3 OVCAR-3 cells were examined by RT-qPCR. B The ULK1 mRNA expression levels in si-NC and si-IGF2BP3 ES-2 cells were examined by RT-qPCR. C RM2Target database predicted a positive correlation between IGF2BP3 and ULK1 expression in TCGA ovarian cancer. D The mRNA expression levels of IGF2BP3 in OV and normal ovarian tissues from the GEPIA database. E Kaplan–Meier plots for the OS of OV patients according to IGF2BP3 expression. F The direct interaction between ULK1 and IGF2BP3 was verified by RIP-qPCR assay in OVCAR-3 and ES-2 cells. G After treatment of OVCAR-3 and ES-2 cells with ACD for 0, 3, and 6 h, ULK1 expression in si-NC and si-IGF2BP3 groups was detected by RT-qPCR. H Schematic diagram of the present study (by Figdraw). ns not significant; *P < 0.05; **P < 0.01; ***P < 0.001; ****P < 0.0001.

Similar articles

Cited by

References

    1. Berek JS, Kehoe ST, Kumar L, Friedlander M. Cancer of the ovary, fallopian tube, and peritoneum. Int J Gynaecol Obstet. 2018;143:59–78. doi: 10.1002/ijgo.12614. - DOI - PubMed
    1. Zhu JW, Charkhchi P, Akbari MR. Potential clinical utility of liquid biopsies in ovarian cancer. Mol Cancer. 2022;21:114. doi: 10.1186/s12943-022-01588-8. - DOI - PMC - PubMed
    1. Zhang T, Liu Q, Gao W, Sehgal SA, Wu H. The multifaceted regulation of mitophagy by endogenous metabolites. Autophagy. 2022;18:1216–39. doi: 10.1080/15548627.2021.1975914. - DOI - PMC - PubMed
    1. Lu Y, Li Z, Zhang S, Zhang T, Liu Y, Zhang L. Cellular mitophagy: mechanism, roles in diseases and small molecule pharmacological regulation. Theranostics. 2023;13:736–66. doi: 10.7150/thno.79876. - DOI - PMC - PubMed
    1. Pradeepkiran JA, Hindle A, Kshirsagar S, Reddy PH. Are mitophagy enhancers therapeutic targets for Alzheimer’s disease? Biomed Pharmacother. 2022;149:112918. doi: 10.1016/j.biopha.2022.112918. - DOI - PMC - PubMed

Publication types

MeSH terms

Substances