. 2024 Jan 29;15(1):881.
doi: 10.1038/s41467-024-45210-5.

PRL2 regulates neutrophil extracellular trap formation which contributes to severe malaria and acute lung injury

Affiliations

PRL2 regulates neutrophil extracellular trap formation which contributes to severe malaria and acute lung injury

Xinyue Du et al. Nat Commun. .

Abstract

Excessive host immune responses contribute to severe malaria with high mortality. Here, we show that PRL2 in innate immune cells is highly related to experimental malaria disease progression, especially the development of murine severe malaria. In the absence of PRL2 in myeloid cells, Plasmodium berghei infection results in augmented lung injury, leading to significantly increased mortality. Intravital imaging revealed greater neutrophilic inflammation and NET formation in the lungs of PRL2 myeloid conditional knockout mice. Depletion of neutrophils prior to the onset of severe disease protected mice from NETs associated lung injury, and eliminated the difference between WT and PRL2 CKO mice. PRL2 regulates neutrophil activation and NET accumulation via the Rac-ROS pathway, thus contributing to NETs associated ALI. Hydroxychloroquine, an inhibitor of PRL2 degradation alleviates NETs associated tissue damage in vivo. Our findings suggest that PRL2 serves as an indicator of progression to severe malaria and ALI. In addition, our study indicated the importance of PRL2 in NET formation and tissue injury. It might open a promising path for adjunctive treatment of NET-associated disease.


Conflict of interest statement

The authors declare no competing interests.

Figures

Fig. 1
Fig. 1. PRL2 downregulation in myeloid cells is associated with severe malaria.
a–c C57BL/6 J mice were infected with 1 × 106 P. berghei ANKA (PbA) iRBCs. a Relative PRL2 mean fluorescence intensity (MFI) in different subsets of peripheral blood cells from the control (Con) and PbA infected mice at 7 days post infection (dpi), normalized to normal mice (n = 6 mice per group). b Spearman’s correlation analysis between PRL2 MFI in CD11b+ peripheral blood cells and the clinical scores of PbA infected mice (n = 46, samples from 10 mice at 0, 2, 4, 6, 8 dpi). c Relative PRL2 MFI in CD11b+ peripheral blood cells from mice with uncomplicated and severe malaria, samples as in (b). d, e Wildtype (WT) and PRL2 myeloid cell conditional knockout (CKO) mice were infected with 1 × 106 PbA iRBCs. d Clinical scores, survival curve, (e) parasitemia and number of RBCs during the 14-day infection (n = 6 mice per group). Cross symbol indicates all CKO mice died. f–n WT and PRL2 CKO mice were infected with 1 × 106 PbA iRBCs (n = 6 mice per group). Samples were collected at 7 dpi. f Representative axial computed tomography (CT) images of lungs. Scale bars, 5 mm. g Quantification of mean pulmonary density from (f). h Hematoxylin-eosin (H&E) staining of lung sections. Representative images are shown. Scale bars, up: 50 μm, down: 10 μm. i Pulmonary pathology scores and infiltrated neutrophils numbers were quantified from (h). j Numbers of peripheral leukocytes, neutrophils, monocytes and lymphocytes. k Concentrations of serum cytokines and chemokines. l Quantification of peripheral neutrophil extracellular traps (NETs) via an analysis of Giemsa-stained blood smears. m Quantification of peripheral NETs via immunofluorescence co-staining with myeloperoxidase (MPO) and citrullinated histone H3 (Cit-H3). n Relative OD value of serum MPO-DNA level. All data were pooled from two independent experiments. Data are presented as the mean ± SEM or in violin plots showing the median and interquartile range. p values were calculated by two-tailed unpaired t test (a, d left, g, i up, l, m, n), two-tailed Mann–Whitney test (c, i down), Spearman’s correlation (b) or log-rank test (d right) and shown in the figures. Source data are provided as a Source Data file.
Fig. 2
Fig. 2. Mice with PRL2 myeloid cell deficiency develop more severe malaria related lung injury with increased NET accumulation.
Wildtype ( WT) and PRL2 myeloid cell conditional knockout (CKO) mice were infected with 1 × 106 P. berghei ANKA (PbA) iRBCs. a Representative immunofluorescence images of lungs from WT and PRL2 CKO mice at 7 dpi (n = 6 mice per group). DNA is stained in blue (DAPI), myeloperoxidase is stained in green (MPO) and citrullinated histone H3 is stained in red (Cit-H3). Scale bars, 20 μm. Neutrophils are indicated as co-stained with MPO and DAPI. Neutrophil extracellular traps (NETs) are indicated as co-stained with MPO and Cit-H3. b Quantification of neutrophils and NETs from (a). c Intravital imaging of the lungs from WT and PRL2 CKO mice at 7 dpi (n = 6 mice per group). Representative time-lapse images are shown. Scale bars, 20 μm. Neutrophils are stained in red (Ly6G) and extracellular DNA is stained in green (Sytox Green, SG). d Quantitative analysis of Ly6G+ cells, Ly6G+SG+ cells, and Ly6G+SG+ cells/30 min in each field of each mice lung by intravital imaging. All data were pooled from two independent experiments. Data are presented as the mean ± SEM or in violin plots showing the median and interquartile range. p values were calculated by two-tailed unpaired t test (b up, d left and middle) or two-tailed Mann–Whitney test (b down, d right) and shown in the figures. Source data are provided as a Source Data file.
Fig. 3
Fig. 3. Depletion of neutrophils protects PRL2 myeloid cell deficient mice from severe malaria related acute lung injury.
a A schematic showing the experimental design for neutrophil depletion in P. berghei ANKA (PbA) infection model. PbA infected wildtype (WT) and PRL2 myeloid cell conditional knockout (CKO) mice were intraperitoneally injected with anti-Ly6G monoclonal antibody or an isotype control at 6 days post infection (dpi). b Number of neutrophils in peripheral blood from the four groups of mice described in (a) at 7 dpi (n = 8 mice per group). c Survival curve of the mice described in (b). d Hematoxylin-eosin (H&E) staining of histologic lung sections from the four groups of mice described in (a) at 7 dpi (n = 6 mice per group). Representative images are shown. Scale bars, left: 50 μm, right: 10 μm. e Pulmonary pathology scores and infiltrated neutrophils numbers were quantified from (d). f Quantification of neutrophils and neutrophil extracellular traps (NETs) in immunofluorescence images of lungs from the four groups of mice described in (d) at 7 dpi. g Representative immunofluorescence images of lungs as described in (f). DNA is stained in blue (DAPI), myeloperoxidase is stained in green (MPO) and citrullinated histone H3 is stained in red (Cit-H3). Scale bars, 20 μm. Neutrophils are indicated as co-stained with MPO and DAPI. NETs are indicated as co-stained with MPO and Cit-H3. All data were pooled from two independent experiments. Data are presented as the mean ± SEM or in violin plots showing the median and interquartile range. p values were calculated by two-way ANOVA with Tukey’s multiple testing (b, e, f) or log-rank test (c) and shown in the figures. Source data are provided as a Source Data file.
Fig. 4
Fig. 4. PRL2 deficiency promotes NET formation.
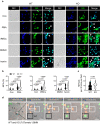
a Representative immunofluorescence images of neutrophil extracellular traps (NETs) released by wildtype (WT) and PRL2 knockout (KO) bone marrow derived neutrophils (BMNs) after phorbol myristate acetate (PMA), iRBC and hemin stimulation. Fixed cells were stained. DNA is stained in blue (DAPI), and extracellular DNA is stained in green (Sytox Green, SG). Scale bar, 5 μm. DIC, differential interference contrast. Arrowheads indicate NETs. b Quantification of NETs in (a). Data were pooled from three independent experiments. BMNs were collected from different mice (n = 3 per group). c Equivalent amount of WT (in white) and PRL2 deficient TdTomato+ (in red) neutrophils were mixed and then stimulated with PMA together for 5 h. Extracellular DNA is stained in green (SG). Quantitative analysis of NETosis/30 min in each field by live cell imaging. Data were pooled from three independent experiments. BMNs were collected from different mice (n = 3 per group). d Representative time-lapse images from live cell imaging described in (c) are shown. Black/white boxes indicate NETs from WT/KO BMNs, respectively. Scale bars, 25 μm. Violin plots show the median and interquartile range. p values were calculated by two-way ANOVA with Tukey’s multiple testing (b) or two-tailed unpaired t test (c) and shown in the figures. Source data are provided as a Source Data file.
Fig. 5
Fig. 5. PRL2 regulates NET formation through the Rac-ROS pathway.
a Wildtype (WT) and PRL2 knockout (KO) bone marrow derived neutrophils (BMNs) were stimulated with phorbol myristate acetate (PMA). Reactive oxygen species (ROS) production was measured by chemiluminescence assay. ROS kinetic plots and averaged area under the curve (AUC) are shown. b WT and PRL2 KO neutrophils were treated with PMA, iRBCs and hemin, ROS production was measured by fluorescent staining. a, b Data were pooled from four independent experiments. BMNs were isolated from different mice (n = 4 per group). c Quantification of neutrophil extracellular traps (NETs) released by WT and PRL2 KO neutrophils that stimulated with PMA, hemin and iRBCs. Cells were pretreated with NAC or not. Data were pooled from three independent experiments. BMNs were isolated from different mice (n = 3 per group). d WT and PRL2 KO neutrophils were treated with PMA for the indicated times. Cell lysates were subjected to pull-down using PAK GST beads. Lysates from pull-down and total lysates were subjected to SDS-PAGE followed by immunoblot assay with anti-Rac, anti-PRL2 and anti-GAPDH antibodies. The experiments were repeated two times with similar results, and the representative immunoblot images were shown. e Representative immunofluorescence images of WT and PRL2 KO neutrophils after PMA stimulation. The experiments were repeated three times with similar results. DNA is stained in blue (DAPI), and GTP-Rac is stained in green. Scale bar, 5 μm. f Relative fluorescence intensity (RFI) of GTP-Rac from WT or KO cells in (e) was determined (n = 26 cells per group). g Quantification of NETs released by WT and PRL2 KO neutrophils that stimulated with PMA, hemin and iRBCs. Cells were pretreated with NSC23766 or not. Data were pooled from three independent experiments. BMNs were from different mice (n = 3 per group). Data are presented as the mean ± SEM or in violin plots showing the median and interquartile range. p values were calculated by two-way ANOVA with Tukey’s multiple testing (a right, b, c, f, g) and shown in the figures. Source data are provided as a Source Data file.
Fig. 6
Fig. 6. PRL2 related NET formation contributes to the pathology in iRBCs induced ALI.
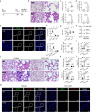
a A schematic showing the experimental design for iRBCs and TNF-α induced acute lung injury (ALI) model. b–g C57BL/6 J mice were induced ALI in (a) or grouped as normal control (Con) (n = 6 mice per group). b Representative images of lung tissues stained with hematoxylin-eosin (H&E). Scale bars, left: 50 μm, right: 10 μm. c Pulmonary pathology scores and infiltrated neutrophil numbers were quantified from (b). d Quantification of neutrophils and neutrophil extracellular traps (NETs) in immunofluorescence images of lungs. e Representative immunofluorescence images of lungs as described in (d). DNA is stained in blue (DAPI), myeloperoxidase is stained in green (MPO) and citrullinated histone H3 is stained in red (Cit-H3). Scale bars, 20 μm. Neutrophils are indicated as co-stained with MPO and DAPI. NETs are indicated as co-stained with MPO and Cit-H3. f Percentage of different subsets of peripheral blood cells. g Relative PRL2 mean fluorescence intensity (MFI) in different subsets of peripheral blood cells, normalized to normal mice. h A schematic showing the experimental design for neutrophil depletion in iRBCs and TNF-α induced ALI model. i–m Wildtype (WT) and PRL2 myeloid cell conditional knockout (CKO) mice were intraperitoneally injected with anti-Ly6G monoclonal antibody or an isotype control 24 h before iRBCs injection (n = 6 mice per group). i Number of peripheral neutrophils from the four groups of mice 24 h after iRBCs injection. j Representative images of lung tissues stained with H&E. Scale bars, left: 50 μm, right: 10 μm. k Pulmonary pathology scores and infiltrated neutrophils numbers were quantified from (j). l Quantification of neutrophils and NETs in immunofluorescence images of lung tissues. m Representative immunofluorescence images of lung tissues. Staining panel is as described in (e). All data were pooled from two independent experiments. Data are presented as the mean ± SEM or in violin plots showing the median and interquartile range. p values were calculated by two-tailed unpaired t test (c up, f, g), two-tailed Mann–Whitney test (c down, d) or two-way ANOVA with Tukey’s multiple testing (i, k, l) and shown in the figures. Source data are provided as a Source Data file.
Fig. 7
Fig. 7. HCQ alleviated iRBCs induced lung injury by blocking PRL2 degradation and NET formation.
a A flow chart depicting hydroxychloroquine (HCQ) treatment for iRBCs and TNF-α induced acute lung injury (ALI). b–g C57BL/6 J mice were treated with normal saline (NS) or HCQ and induced ALI, or just treated with NS and grouped as normal control (Con) (n = 6 mice per group). b Percentage of peripheral myeloid cells (CD11b+) and neutrophils (CD11b+Ly6G+).c Relative PRL2 mean fluorescence intensity (MFI) in different subsets of peripheral blood cells, normalized to normal control mice. d Pulmonary pathology scores and infiltrated neutrophils numbers were quantified from lung tissues stained with hematoxylin-eosin (H&E). e Representative images of lung tissues. Scale bars, left: 50 μm, right: 10 μm. f Representative immunofluorescence images of lung tissues. DNA is stained in blue (DAPI), myeloperoxidase is stained in green (MPO) and citrullinated histone H3 is stained in red (Cit-H3). Scale bars, 20 μm. Neutrophils are indicated as co-stained with MPO and DAPI. Neutrophil extracellular traps (NETs) are indicated as co-stained with MPO and Cit-H3. g Quantification of neutrophils and NETs from (f). All data were pooled from two independent experiments. Data are presented as the mean ± SEM or in violin plots showing the median and interquartile range. p values were calculated by one-way ANOVA with Tukey’s multiple testing (b, c, d, g) and shown in the figures. Source data are provided as a Source Data file.

Similar articles

Cited by

References

    1. World Health Organization. World malaria report 2023 (2023).
    1. Ashley EA, Pyae Phyo A, Woodrow CJ. Malaria. Lancet (Lond. Engl.) 2018;391:1608–1621. doi: 10.1016/S0140-6736(18)30324-6. - DOI - PubMed
    1. Kotepui M, Kotepui KU, De Jesus Milanez G, Masangkay FR. Plasmodium spp. mixed infection leading to severe malaria: a systematic review and meta-analysis. Sci. Rep. 2020;10:11068. doi: 10.1038/s41598-020-68082-3. - DOI - PMC - PubMed
    1. Brejt JA, Golightly LM. Severe malaria: update on pathophysiology and treatment. Curr. Opin. Infect. Dis. 2019;32:413–418. doi: 10.1097/QCO.0000000000000584. - DOI - PubMed
    1. Cunnington AJ, Walther M, Riley EM. Piecing together the puzzle of severe malaria. Sci. Transl. Med. 2013;5:211ps218. doi: 10.1126/scitranslmed.3007432. - DOI - PubMed

Substances