. 2024 Jan 30;14(1):2441.
doi: 10.1038/s41598-024-52337-4.

Glial cells react to closed head injury in a distinct and spatiotemporally orchestrated manner

Affiliations

Glial cells react to closed head injury in a distinct and spatiotemporally orchestrated manner

Ester Nespoli et al. Sci Rep. .

Abstract

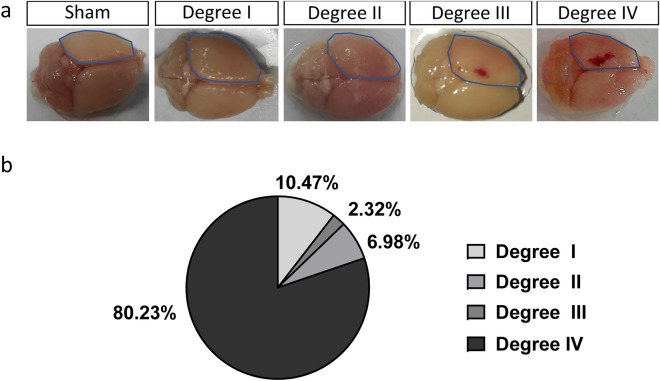
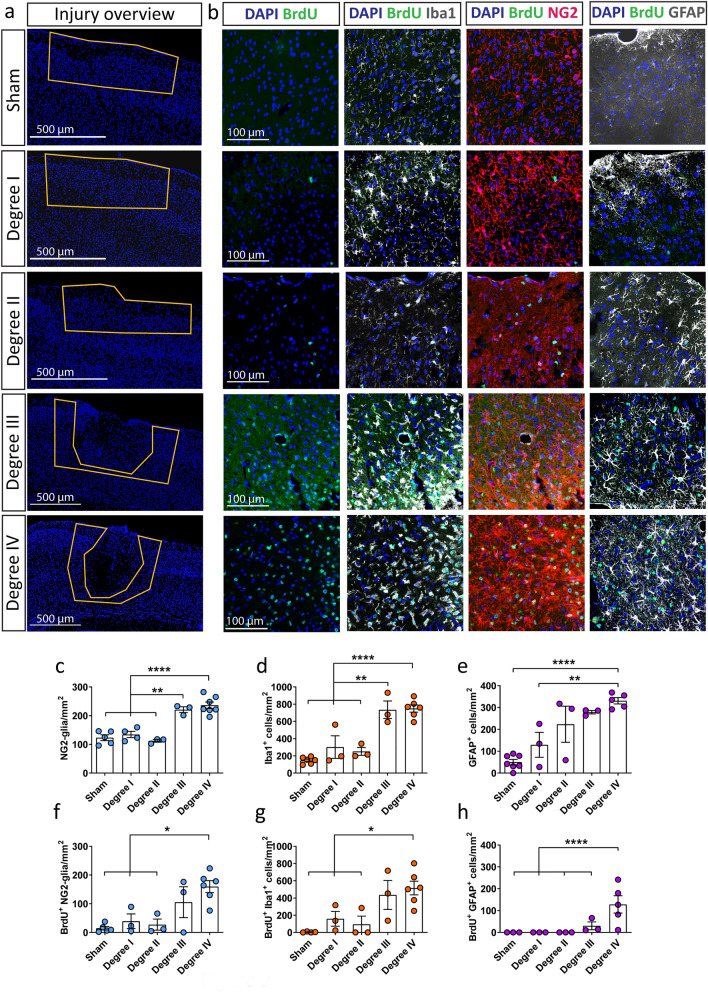
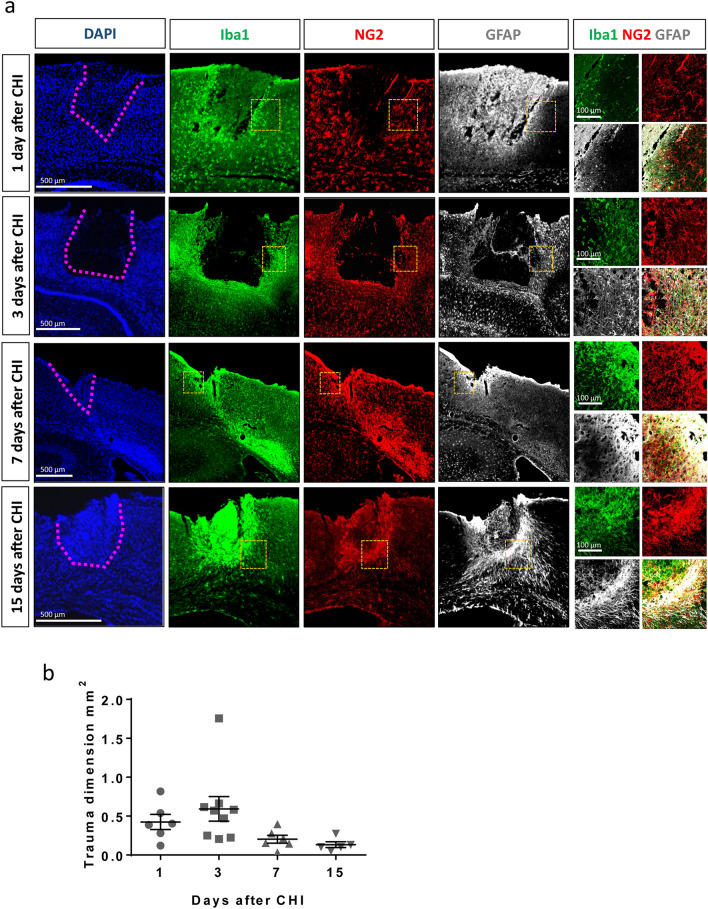
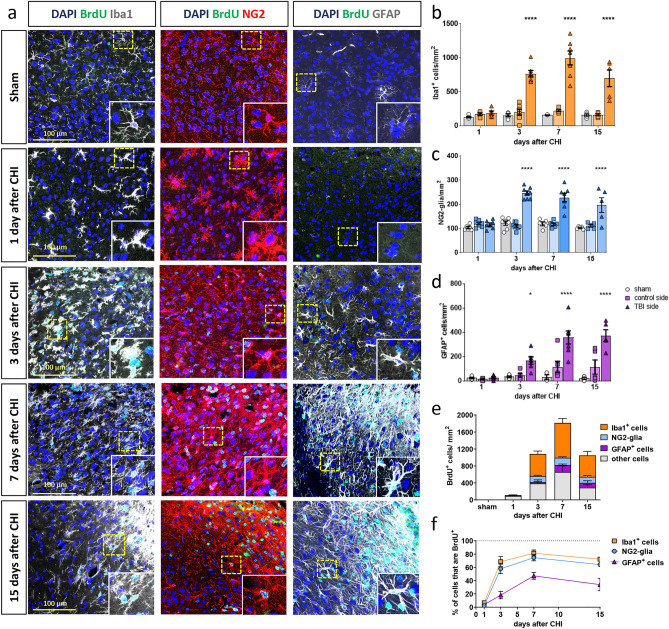
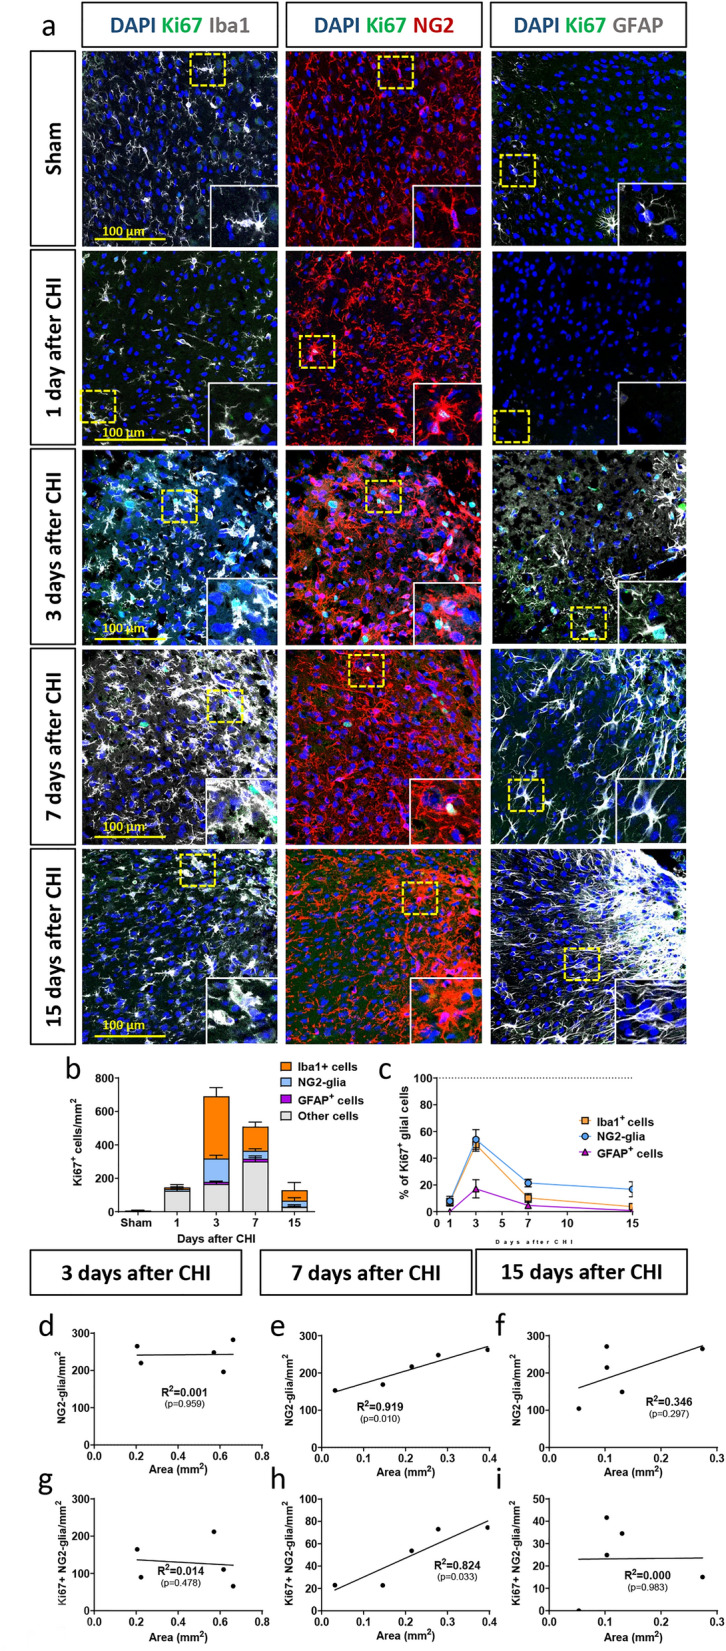
Traumatic brain injury (TBI) is a leading cause of mortality and disability worldwide. Acute neuroinflammation is a prominent reaction after TBI and is mostly initiated by brain-resident glial cells such as microglia, NG2-glia and astrocytes. The magnitude of this reaction paves the way for long-lasting consequences such as chronic neurological pathologies, for which therapeutic options remain limited. The neuroinflammatory response to TBI is mostly studied with craniotomy-based animal models that are very robust but also rather artificial. Here, we aimed to analyze the reaction of glial cells in a highly translational but variable closed head injury (CHI) model and were able to correlate the severity of the trauma to the degree of glial response. Furthermore, we could show that the different glial cell types react in a temporally and spatially orchestrated manner in terms of morphological changes, proliferation, and cell numbers in the first 15 days after the lesion. Interestingly, NG2-glia, the only proliferating cells in the healthy brain parenchyma, divided at a rate that was correlated with the size of the injury. Our findings describe the previously uncharacterized posttraumatic response of the major brain glial cell types in CHI in order to gain a detailed understanding of the course of neuroinflammatory events; such knowledge may open novel avenues for future therapeutic approaches in TBI.


Conflict of interest statement

The authors declare no competing interests.

Figures

Figure 1
Figure 1
CHI can lead to different degrees of injury severity. (a) Three days after CHI, the presence of fracture and bleeding (degree IV), only bleeding (degree III), only fracture (degree II), or neither (degree I) could be determined visually on the ipsilateral side of the injury (dotted blue line). (b) Percentages of the different outcomes after CHI.
Figure 2
Figure 2
The response of glial cells to CHI is elevated with increased severity of the injury. (a) Immunohistochemical analysis which shows the injury overview with the use of the nuclear marker DAPI (blue). The yellow line highlights the area that was chosen for analysis regarding cell imaging and quantification. (b) Representative IHC images of higher magnification within the area that was analyzed; BrdU+ cells (green) alone or in combination with NG2-glia (red, middle panel), Iba1+ cells (microglia, white, left panel), and GFAP+ cells (reactive astrocytes, white, right panel) at 3 days after CHI according to the trauma severity. Quantitative analysis of (c) NG2-glia, (d) Iba1+ cells, and (e) GFAP+ cells in the different degrees of CHI. Quantitative analysis of (f) BrdU+ NG2-glia, (g) BrdU+ Iba1+ cells, and (h) BrdU+ GFAP+ cells in the different degrees of CHI. Statistical analysis: one-way ANOVA with Tukey's post hoc test; *p < 0.05, **p < 0.01, ****p < 0.0001. Data are presented as the mean ± SEM.
Figure 3
Figure 3
Spatial reaction of glial cells after CHI and reduction of lesion size over time. (a) IHC shows the progressive accumulation of Iba1+ cells around and within the trauma site (the borders of the trauma site are highlighted by the pink dotted line in the left panel), while NG2-glia and GFAP+ astrocytes surround the lesion. Yellow dotted squares show the position of the higher-magnification images (right panels), used to highlight the colocalization of the different markers. (b) No significant reduction in the primary trauma dimension per slice is observed over time (one-way ANOVA with Tukey's post hoc test). Data are presented as the mean ± SEM.
Figure 4
Figure 4
Glial cell-specific reaction to CHI over time. (a) IHC analysis of Iba1+ cells (in gray, left panel), NG2-glia (in red, middle panel), GFAP+ astrocytes (in gray, right panel), and proliferating BrdU+ cells (in green) shows morphological changes at different time points after CHI. In the images, CHI is located in the upper right corner. Higher magnification images of single cells (yellow dotted line) are shown in insets. (b) Quantification of Iba1+ cell-, (c) NG2-glia-, and (d) GFAP+ astrocyte-numbers that accumulate around the TBI at different timepoints after CHI. (e) Quantification and identity of BrdU+ cells, representing all cells that have proliferated between the timepoint of injury and the timepoint of sacrifice; (f) percentage of the total Iba1+ cells, NG2-glia, and GFAP+ cells that are also BrdU+ at the different time points. Statistical analysis: two-way ANOVA with Tukey’s post hoc test for multiple comparisons. *p < 0.05, ****p < 0.0001. Data are presented as the mean ± SEM.
Figure 5
Figure 5
Active proliferation of glial cells changes after injury over time. (a) IHC analysis of Iba1+ cells (in gray, left panel), NG2-glia (in red, middle panel), GFAP+ astrocytes (in gray, right panel), and actively proliferating Ki67+ cells (in green) after CHI. In the images, CHI is located in the upper right corner. Higher magnification images of single cells (yellow dotted line) are shown in insets. (b) Quantification and identity of Ki67+ cells, which represent the acute proliferating cells at the timepoint of sacrifice; (c) percentages of all Iba1+ cells, NG2-glia, and GFAP+ cells that are also Ki67+ at the different time points. Correlation of lesion size at 3 (d,g), 7 (e,h) and 15 (f,i) days after trauma with the total number of NG2-glia (df) and Ki67+ NG2-glia (gi). A correlation between the size of the lesion and the reaction of NG2-glia could only be observed at 7 days after trauma (e,h). Data are plotted along with the line of fit determined by linear regression analysis. Significance was calculated with R2 and p < 0.05.

Similar articles

Cited by

References

    1. Maas AIR, et al. Traumatic brain injury: Integrated approaches to improve prevention, clinical care, and research. Lancet Neurol. 2017;16:987–1048. doi: 10.1016/S1474-4422(17)30371-X. - DOI - PubMed
    1. Lew HL, et al. Persistent problems after traumatic brain injury: The need for long-term follow-up and coordinated care. J. Rehabil. Res. Dev. 2006;43:vii. doi: 10.1682/JRRD.2006.05.0054. - DOI - PubMed
    1. Plassman BL, et al. Documented head injury in early adulthood and risk of Alzheimer’s disease and other dementias. Neurology. 2000;55:1158–1166. doi: 10.1212/WNL.55.8.1158. - DOI - PubMed
    1. Quaglio G, Gallucci M, Brand H, Dawood A, Cobello F. Traumatic brain injury: A priority for public health policy. Lancet Neurol. 2017;16:951–952. doi: 10.1016/S1474-4422(17)30370-8. - DOI - PubMed
    1. Rosenfeld JV, et al. Early management of severe traumatic brain injury. Lancet Lond. Engl. 2012;380:1088–1098. doi: 10.1016/S0140-6736(12)60864-2. - DOI - PubMed