. 2024 Feb;6(2):273-289.
doi: 10.1038/s42255-024-00978-0. Epub 2024 Jan 29.

Obesity causes mitochondrial fragmentation and dysfunction in white adipocytes due to RalA activation

Affiliations

Obesity causes mitochondrial fragmentation and dysfunction in white adipocytes due to RalA activation

Wenmin Xia et al. Nat Metab. 2024 Feb.

Abstract

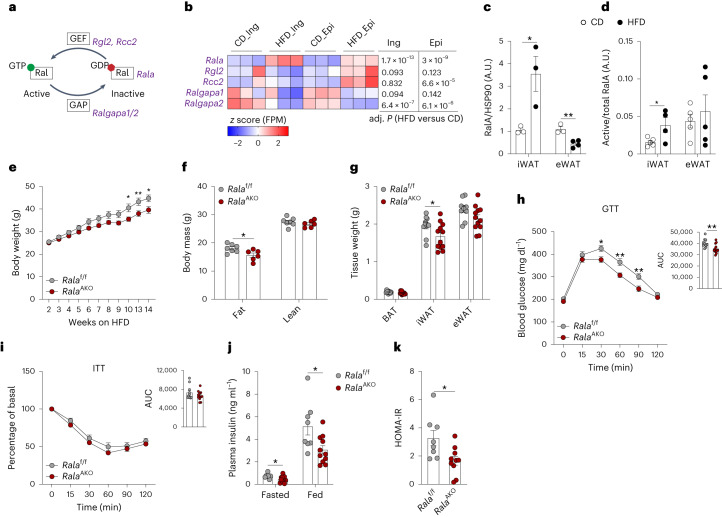
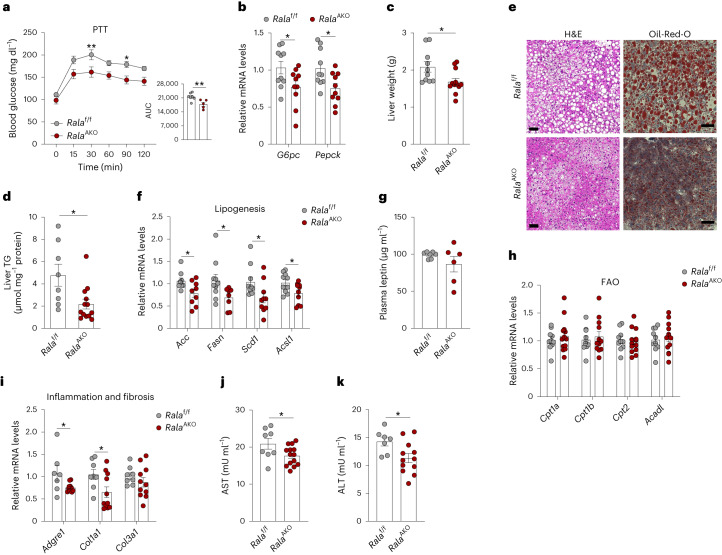
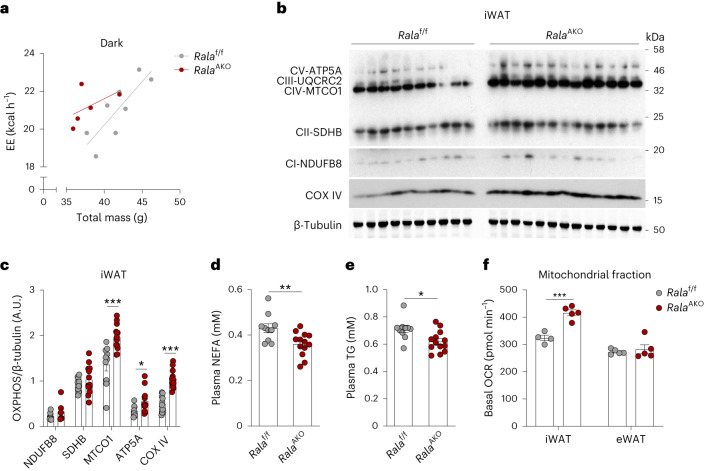
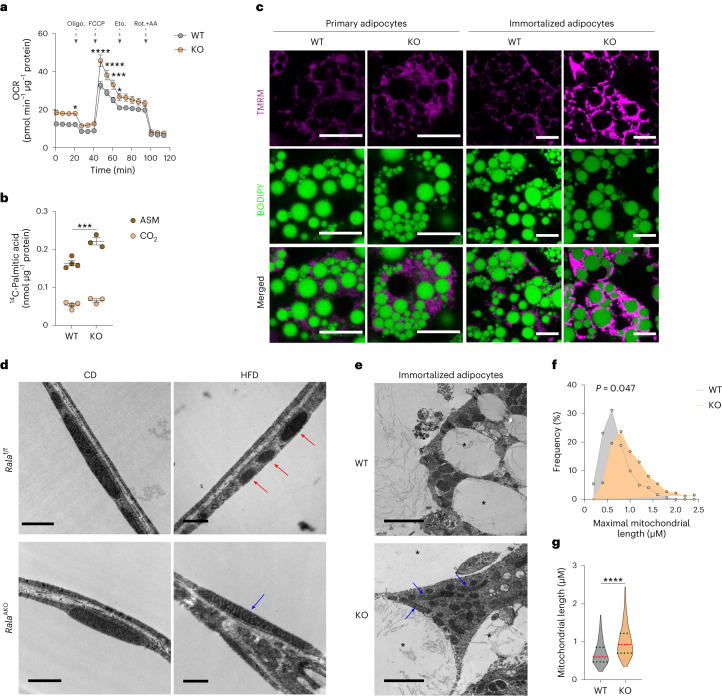
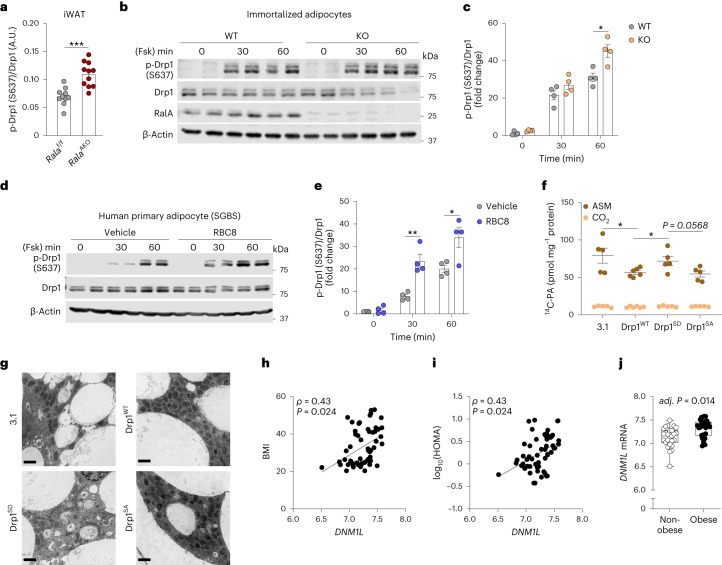
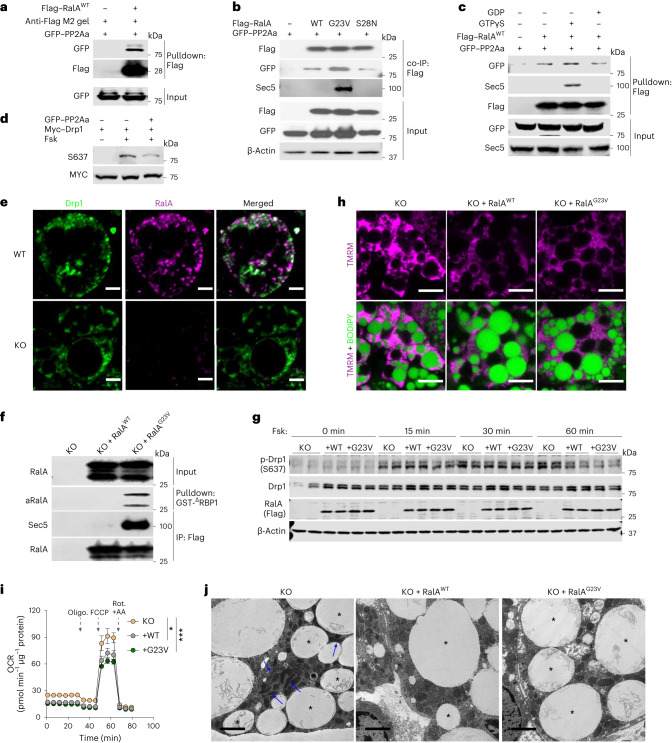
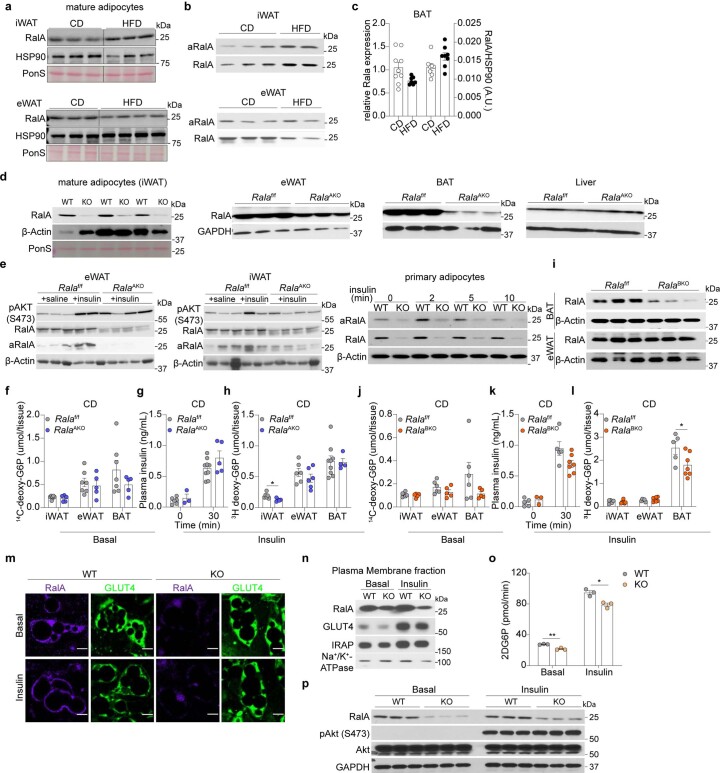
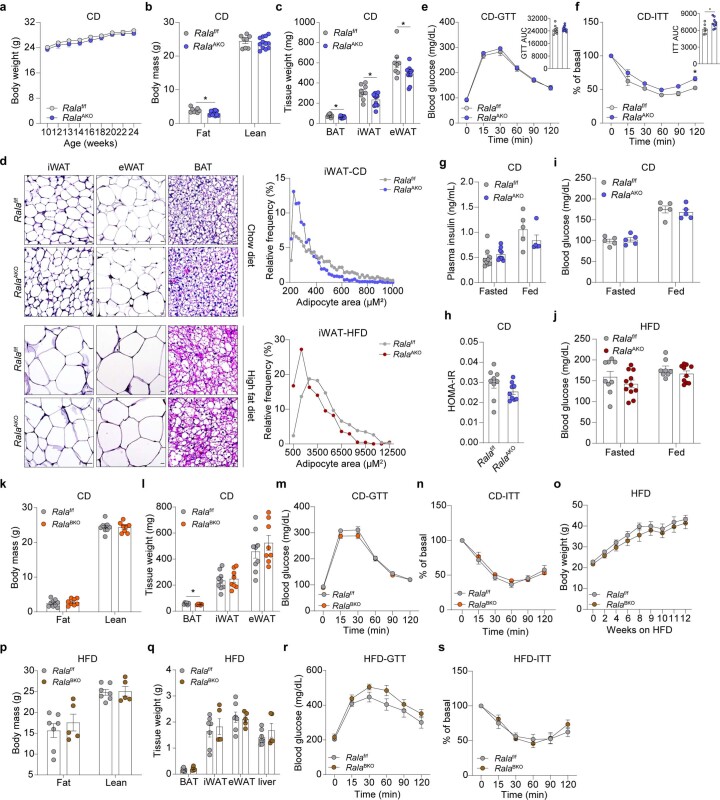
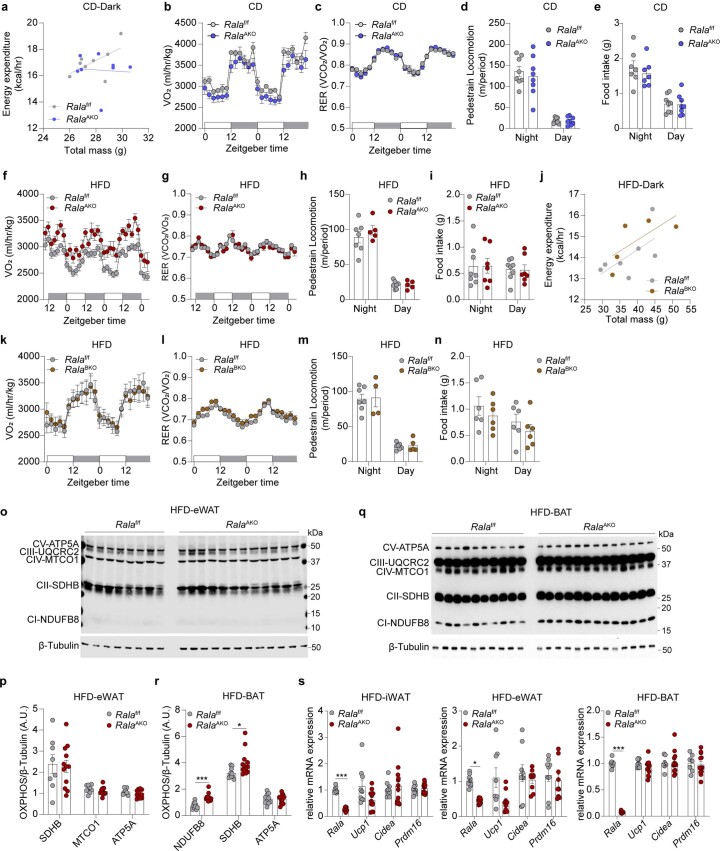
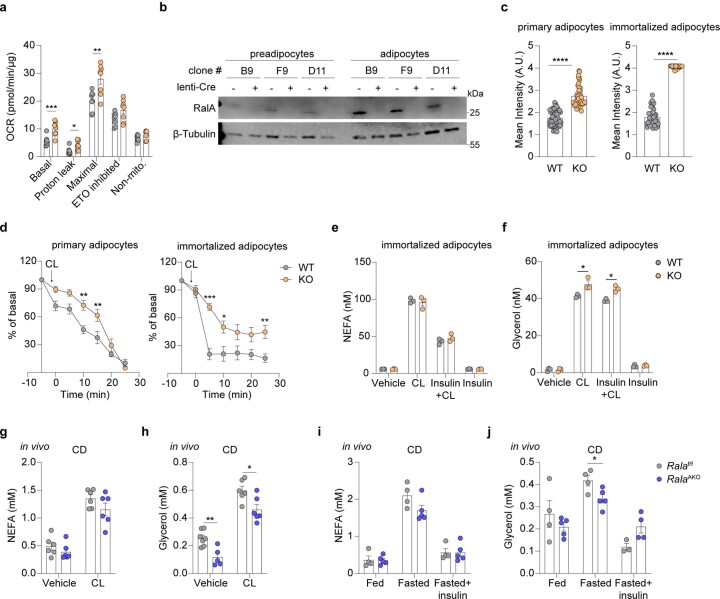
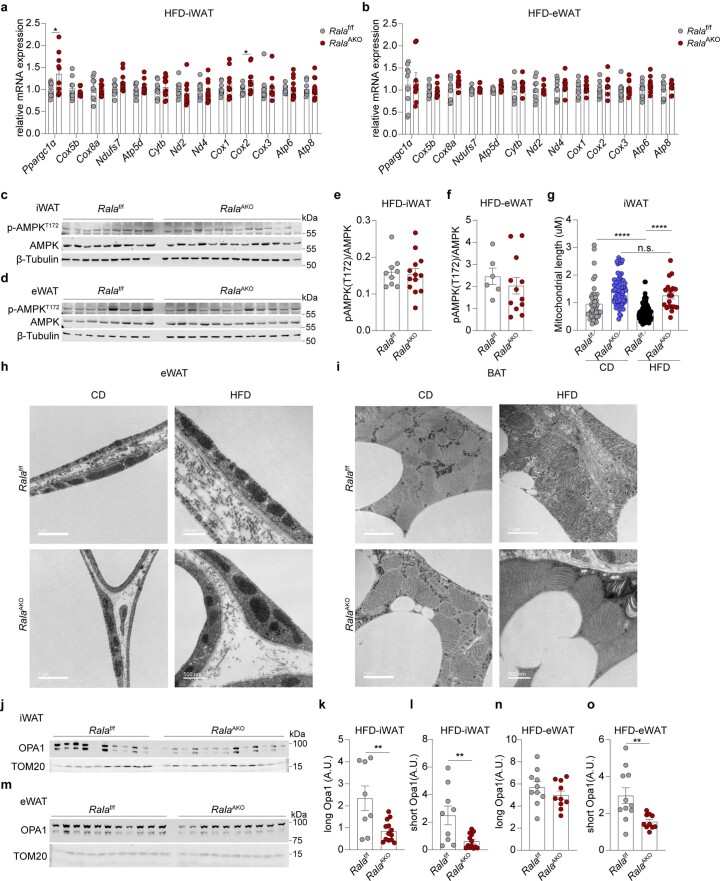
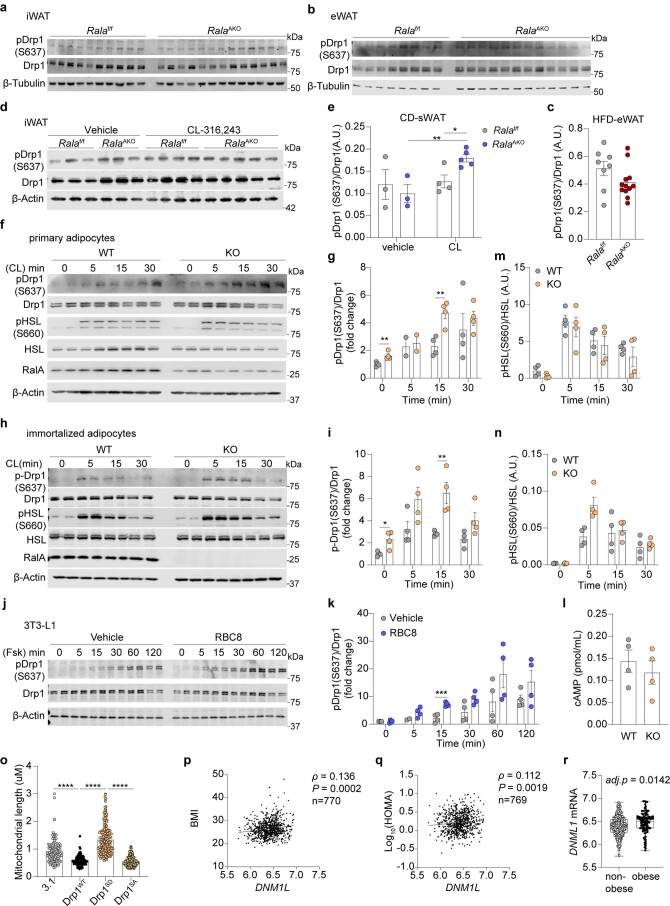
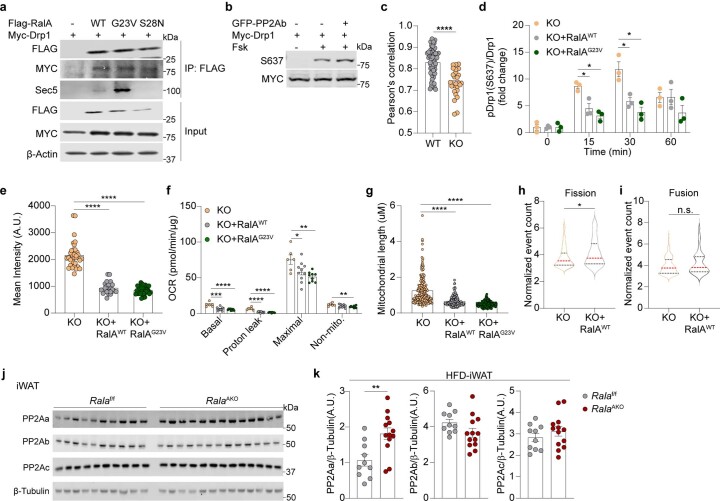
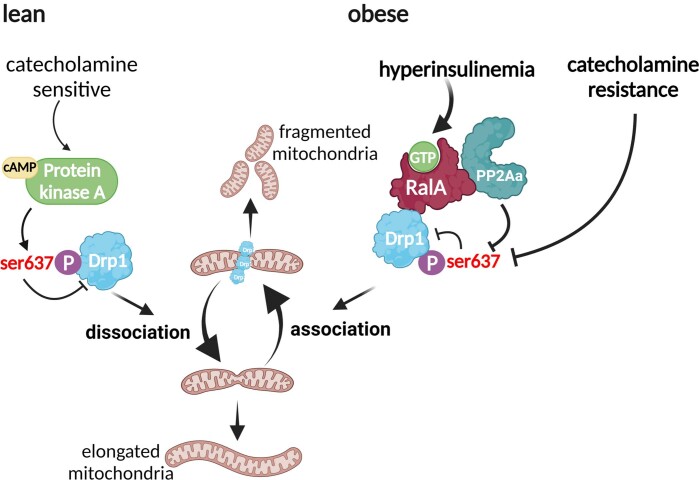
Mitochondrial dysfunction is a characteristic trait of human and rodent obesity, insulin resistance and fatty liver disease. Here we show that high-fat diet (HFD) feeding causes mitochondrial fragmentation in inguinal white adipocytes from male mice, leading to reduced oxidative capacity by a process dependent on the small GTPase RalA. RalA expression and activity are increased in white adipocytes after HFD. Targeted deletion of RalA in white adipocytes prevents fragmentation of mitochondria and diminishes HFD-induced weight gain by increasing fatty acid oxidation. Mechanistically, RalA increases fission in adipocytes by reversing the inhibitory Ser637 phosphorylation of the fission protein Drp1, leading to more mitochondrial fragmentation. Adipose tissue expression of the human homolog of Drp1, DNM1L, is positively correlated with obesity and insulin resistance. Thus, chronic activation of RalA plays a key role in repressing energy expenditure in obese adipose tissue by shifting the balance of mitochondrial dynamics toward excessive fission, contributing to weight gain and metabolic dysfunction.


Conflict of interest statement

The authors declare no competing interests.

Figures

Fig. 1
Fig. 1. White adipocyte-specific Rala deletion protects mice from high-fat-diet-induced obesity.
a, Scheme illustrating RalA activation network involving genes encoding RalA, GEF and GAP. b, RNA-seq analysis of primary inguinal (Ing) and epididymal (Epi) mature adipocytes isolated from mice (n = 3) under 16-week HFD feeding. Heat map displays transcriptional expression as z-scored FPM values. Adjusted P (adj. P) values are indicated and considered significant with values <0.05. c, Quantification of RalA protein content in mature adipocytes from iWAT and eWAT of mice fed with CD (n = 3) or HFD (n = 4) for 16 weeks. iWAT P = 0.033 CD versus HFD, eWAT P = 0.005 CD versus HFD. A.U., arbitrary units. d, Quantification of RalA GTPase activity in iWAT and eWAT of mice (n = 4) fed with CD or HFD for 4 weeks. iWAT P = 0.0448 CD versus HFD. e, Body weight of Ralaf/f (n = 8) and RalaAKO (n = 10) mice fed with 60% HFD. Longitudinal graph, P = 0.0158, P = 0.009, P = 0.0106. f, Body mass of Ralaf/f (n = 7) and RalaAKO (n = 6) mice fed with HFD for 12 weeks. Fat mass P = 0.0252. g, Fat depot weights of Ralaf/f (n = 10) and RalaAKO (n = 12) mice fed with HFD for 12 weeks. iWAT P = 0.0465. h, GTT on 11-week HFD-fed Ralaf/f (n = 10) and RalaAKO (n = 13) mice, P = 0.0174, P = 0.0036, P = 0.0069; the area under the curve (AUC) was calculated from longitudinal charts, P = 0.0062. i, ITT on 12-week HFD-fed Ralaf/f (n = 10) and RalaAKO (n = 12) mice; AUC was calculated from longitudinal chart. j, Plasma insulin levels in 8-week HFD-fed Ralaf/f and RalaAKO mice (n = 11). Fasted P = 0.0166. Fed P = 0.0329. k, HOMA-IR was calculated using fasting glucose and insulin levels from 8-week HFD-fed Ralaf/f (n = 8) and RalaAKO (n = 10) mice. P = 0.0152. Data (ck) show mean ± s.e.m., *P < 0.05, **P < 0.01, by two-tailed Student’s t-test (c,d,f,g,j,k) or two-way analysis of variance (ANOVA) with Bonferroni’s post-test (e,h,i). Source data
Fig. 2
Fig. 2. Loss of RalA in WAT ameliorates HFD-induced hepatic steatosis.
a, A PTT was performed on overnight-fasted Ralaf/f (n = 7) and RalaAKO (n = 5) mice after 8 weeks of HFD feeding; P = 0.0093, P = 0.0241. The AUC was calculated from a PTT longitudinal chart; P = 0.0097. b, Relative mRNA expression of key gluconeogenic genes in livers of HFD-fed Ralaf/f and RalaAKO mice (n = 10). P = 0.0388, P = 0.0167. c, Liver weight of HFD-fed Ralaf/f (n = 10) and RalaAKO (n = 12) mice; P = 0.0235. d, TG content in livers of HFD-fed Ralaf/f (n = 8) and RalaAKO (n = 13) mice; P = 0.0129. e, Representative H&E staining image (left) and Oil-Red-O staining image (right) of liver sections in HFD-fed Ralaf/f and RalaAKO mice (n = 3). Scale bar, 15 mm. f, Relative mRNA expression of lipogenic genes in livers of HFD-fed Ralaf/f (n = 9) and RalaAKO (n = 10) mice; P = 0.0218, P = 0.0435, P = 0.0332, P = 0.0325. g, Plasma leptin levels in HFD-fed Ralaf/f (n = 7) and RalaAKO (n = 6) mice. h, Relative mRNA expression of FAO-related genes in livers of HFD-fed Ralaf/f (n = 10) and RalaAKO (n = 11) mice. i, Relative mRNA expression of genes related to inflammation and fibrosis in livers of HFD-fed Ralaf/f (n = 7) and RalaAKO (n = 11) mice; P = 0.0347, P = 0.0325. j,k, Plasma AST (j) and ALT (k) activities in HFD-fed Ralaf/f (n = 7) and RalaAKO (n = 14) mice; P = 0.0367(j), P = 0.0275 (k). Data (ad,fk) show mean ± s.e.m., *P < 0.05, **P < 0.01 by two-tailed Student’s t-test (bd,f,ik) or two-way ANOVA with Bonferroni’s post-test (a). Source data
Fig. 3
Fig. 3. RalA deficiency in WAT increases energy expenditure and mitochondrial oxidative phosphorylation.
a, Regression plot of energy expenditure (EE) measured in HFD-fed Ralaf/f (n = 8) and RalaAKO (n = 5) mice during dark phase. ANCOVA was performed using body weight (BW) as a covariate, group effect P = 0.0391. b,c, Immunoblot (b) and quantification (c) of OXPHOS complex proteins and β-tubulin in iWAT of HFD-fed Ralaf/f (n = 10) and RalaAKO (n = 13) mice. P = 0.0005, P = 0.0348, P < 0.0001. d,e, Plasma non-esterified fatty acid (NEFA; d) and TG (e) levels in HFD-fed Ralaf/f (n = 10) and RalaAKO (n = 13) mice; P = 0.0077(d), P = 0.0115 (e). f, Basal OCR in mitochondria measured by Seahorse. Mitochondrial fractions were isolated from primary mature adipocytes in iWAT or eWAT of HFD-fed Ralaf/f (n = 4) and RalaAKO (n = 5) mice. iWAT P = 0.0004. Data (cf) show mean ± s.e.m., *P < 0.05, **P < 0.01, ***P < 0.001 by two-tailed Student’s t-test (cf). Source data
Fig. 4
Fig. 4. Rala knockout in white adipocytes increases mitochondrial activity and fatty acid oxidation via preventing obesity-induced mitochondrial fission in iWAT.
a, OCR was measured in fully differentiated primary adipocytes (n = 8 biological samples); P = 0.0499, P < 0.0001, P < 0.0001, P = 0.0006, P = 0.0468. Vertical arrows indicate injection ports of indicated chemicals. b, 14C-PA oxidation in differentiated primary WT (n = 4 biological samples) and KO (n = 3 biological samples) adipocytes under basal conditions; P = 0.0037. c, Representative confocal images of live primary and immortalized adipocytes stained with TMRM (red) and BODIPY (green) (n = 3 biological samples). Scale bar, 15 μm. d, Representative transmission electron microscope (TEM) images of iWAT from CD-fed and HFD-fed Ralaf/f and RalaAKO mice (n = 3 biological samples). Red arrow indicates fissed mitochondria; blue arrow indicates elongated mitochondria. Scale bar, 1 μm (CD) or 500 nm (HFD). e, Representative TEM images of WT and Rala KO immortalized adipocytes (n = 3 biological samples). Blue arrow indicates elongated mitochondria; asterisk indicates lipid droplet. Scale bar, 2 μm. f,g, Histogram (f) and violin plot (g) of maximal mitochondrial length in immortalized adipocytes (WT, six independent cells; KO, ten independent cells). Violin plot is presented as violin showing 25th to 75th percentiles and whiskers showing min to max; P = 0.047 (f), P < 0.0001 (g). Data (a,b) show mean ± s.e.m., *P < 0.05, ***P < 0.001, ****P < 0.0001 by two-tailed Student’s t-test (b,g), two-way ANOVA alone (f) or with Bonferroni’s post-test (a). Source data
Fig. 5
Fig. 5. Inhibition of RalA increases Drp1 S637 phosphorylation in white adipocytes.
a, Quantification of phospho-Drp1 (S637) and total Drp1 in iWAT of HFD-fed Ralaf/f (n = 10) and RalaAKO (n = 13) mice; P = 0.0001. b,c, Immunoblotting (b) and quantification (c) of phospho-Drp1 (S637) and total Drp1 in immortalized adipocytes (n = 4 biological samples); P = 0.0125 (c). Adipocytes were treated with 20 μM forskolin (Fsk) for indicated time. d,e, Immunoblotting (d) and quantification of phospho-Drp1 (S637) and total Drp1 in human primary adipocytes (SGBS) (n = 4 biological samples). Cells were pretreated with 50 μM RBC8 or dimethylsulfoxide (DMSO) for 30 min before treatment with 20 μM forskolin (Fsk) for indicated time; P = 0.0022, P = 0.0244 (e). f, Basal 14C-PA oxidation in WT immortalized adipocytes transfected with indicated plasmids (n = 6 biological samples); P = 0.040 3.1 versus Drp1WT, P = 0.0364 Drp1WT versus Drp1SD. g, Representative TEM images of immortalized adipocytes transfected with indicated plasmids (n = 3 biological samples). Scale bar, 2 μM. h,i, DNM1L mRNA expression is correlated with BMI (h) and HOMA (i) in human abdominal subcutaneous adipose tissue samples (n = 56 biological samples). ρ (rho) denotes Spearman’s rank-order correlation coefficient of the regression; P = 0.024 (h), P = 0.024 (i). j, Box-and-whisker plot of DNM1L mRNA expression in abdominal subcutaneous adipose tissues from 56 individuals with or without obesity. Benjamini–Hochberg adj. P = 0.014. The box plot is presented as a box showing 25th to 75th percentiles and whiskers showing min to max. Data (a,c,e,f) show mean ± s.e.m., *P < 0.05, **P < 0.01, ***P < 0.001 by two-tailed Student’s t-test (a,c,e,f). Significance in correlation was assessed by Spearman’s correlation test (h,j). Source data
Fig. 6
Fig. 6. RalA interacts with Drp1 and protein phosphatase 2A, promoting dephosphorylation of Drp1 at S637.
a, Representative immunoblotting of pulldown assay determining PP2Aa–RalA interactions. b, Representative immunoblotting of co-immunoprecipitation (co-IP) determining the interaction between RalA WT, constitutive active (G23V) or dominant negative (S28N) mutants and PP2Aa in HEK293T cells. c, Representative immunoblotting of pulldown and in vitro loading assay determining interaction between PP2Aa and GTP/GDP-loaded RalA. Purified Flag–RalAWT protein loaded with either GTPγS or GDP was, respectively, used as a bait to pull down GFP–PP2Aa from HEK293T cells. d, Representative immunoblotting of in vitro dephosphorylation assay in HEK293T cells co-transfected with PP2A and Drp1 plasmids. Cells were treated for 1 h with 20 μM forskolin (Fsk) or vehicle. e, Representative immunofluorescent staining of endogenous Drp1 and RalA in immortalized WT adipocytes. Scale bar, 5 μm. f, Representative immunoblotting of RalA activity assay in immortalized Rala KO adipocytes reconstituted with RalAWT and RalAG23V. g, Immunoblotting of phospho-Drp1 (S637), total Drp1, Flag-tagged RalA and β-actin in immortalized Rala KO adipocytes with or without RalA reconstitution (n = 3 independent experiments). Adipocytes were treated with 20 μM forskolin for the indicated times. h, Representative confocal images of live immortalized adipocytes (n = 3 biological independent cells) stained with TMRM (red) and BODIPY (green). Scale bar, 15 μM. i, OCR was measured by Seahorse in immortalized adipocytes (KO, n = 5 independent samples; +WT, n = 10 independent samples; +G23V, n = 9 independent samples); P = 0.0165 KO versus +WT, P = 0.0005 KO versus +G23V. Vertical arrows indicate injection ports of indicated chemicals. Data are shown as mean ± s.e.m., *P < 0.05, ***P < 0.001 by two-way ANOVA. j, Representative TEM images of Rala KO immortalized adipocytes with or without RalA reconstitution (n = 3 independent cells). Blue arrow indicates elongated mitochondria; asterisk indicates lipid droplet. Scale bar, 2 μm. Source data
Extended Data Fig. 1
Extended Data Fig. 1. RalA protein content and activity are increased in obese adipocytes.
a, Immunoblotting for RalA in mature adipocytes isolated from iWAT (n = 3) or eWAT (n = 4) of age-matched CD-fed (lean) mice and HFD-fed (obese) mice. b, Representative immunoblotting for active RalA (aRalA) in iWAT (upper panel) or eWAT (lower panel) of age-matched CD-fed mice (n = 3) and HFD-fed mice (n = 2). c, RalA mRNA expression and quantified protein levels in BAT of age-matched CD-fed and HFD-fed mice (n = 8). d, Immunoblotting of RalA in inguinal mature adipocyte fraction, eWAT, BAT, and liver from lean mice (n = 3). e, In vivo and in vitro activation of RalA by insulin in adipose tissue of Ralaf/f (saline n = 3, insulin n = 2) and RalaAKO (n = 4) mice and primary adipocytes. 0.5U/kg or 100 nM insulin was injected or treated for 5 min or indicated time. f, Basal in vivo glucose uptake in 6 hrs fasted CD-fed mice injected with 10μCi [14C]-2deoxyglucose for 30 min (Ralaf/f n = 7, RalaAKO n = 5). g, Plasma insulin levels before and 30 min after glucose injection (Ralaf/f n = 9, RalaAKO n = 5). h, Insulin stimulated in vivo glucose uptake in CD-fed mice injected with 1.2 g/kg glucose and 10 μCi [3H]-2-deoxy-glucose for 30 min (Ralaf/f n = 6, RalaAKO n = 9). i, Immunoblotting of RalA in BAT (upper panel) and eWAT (lower panel) of Ralaf/f and RalaBKO mice (n = 3). j, Basal in vivo glucose uptake in 6 hrs fasted CD-fed mice injected with 10 μCi [14C]-2-deoxy-glucose for 30 min (Ralaf/f n = 7, RalaBKO n = 5). k, Plasma insulin levels before and 30 min after glucose injection (Ralaf/f n = 5, RalaBKO n = 7). l, Insulin stimulated in vivo glucose uptake in CD-fed mice injected with 1.2 g/kg glucose and 10 μCi [3H]-2-deoxy-glucose for 30 min (Ralaf/f n = 5, RalaBKO n = 7). m, Representative immunostaining of endogenous RalA and GLUT4 in primary adipocytes treated with insulin (100 nM) or vehicle for 30 min, scale bar = 15 μm. (n = 3 biological samples). n, Representative immunoblotting of RalA, GLUT4, IRAP and Na + /K + -ATPase proteins in plasma membrane fraction of primary adipocytes treated with vehicle or insulin (100 nM) for 30 min. (n = 3 biological samples). o, 2-deoxy-glucose (2-DG) uptake in primary adipocytes treated with insulin (100 nM) or vehicle for 30 min (n = 3 biological samples). p, Immunoblotting of phosphor-Akt (S473), total Akt and GAPDH in primary adipocytes treated with or without insulin (100 nM) for 15 min. (n = 3 biological samples). The data are shown as the mean ± SEM, *P < 0.05, **P < 0.01 by two-tailed Student’s T-test (h, l, o). Source data
Extended Data Fig. 2
Extended Data Fig. 2. Brown adipocyte specific Rala deletion in mice did not phenocopy RalaAKO mice.
a-c, Body weight curve (a), body composition (b) and fat depot weights (c) of CD-fed Ralaf/f (n = 8) and RalaAKO (n = 12) mice at the age of 24-weeks. P = 0.0103 (b). P = 0.0122, P = 0.0252, P = 0.0403 (c). d, Representative H&E staining images of iWAT, eWAT, and BAT from CD-fed and HFD-fed mice (n = 3), scale bar = 100 μm, representative adipocytes size quantification of iWAT from CD-fed and HFD-fed mice. e, f, Glucose tolerance test (GTT, e) and insulin tolerance test (ITT, f) on CD-fed Ralaf/f (n = 8) and RalaAKO (n = 12) mice. Area under curves (AUC) were calculated from GTT and ITT, respectively. P = 0.0247 (f). g, Plasma insulin levels in CD-fed Ralaf/f and RalaAKO mice under ab libitum (n = 5) or overnight fasted (n = 9) condition. h, Homeostasis model assessment-estimated insulin resistance (HOMA-IR) was calculated based on fasting glucose and insulin levels from CD-fed Ralaf/f and RalaAKO mice (n = 9). I, Blood glucose levels in CD-fed mice (n = 5) at indicated states. j, Blood glucose levels in HFD-fed Ralaf/f (n = 9) and RalaAKO (n = 11) mice at indicated states. k-l, Body composition (k) and fat depot weights (l) in CD-fed Ralaf/f (n = 9) and RalaBKO (n = 8) mice at the age of 28 weeks. P = 0.0488 (l). m-n, GTT (m) and ITT (n) were performed in CD-fed Ralaf/f (n = 9) and RalaBKO (n = 8) mice at the age of 26-weeks. o, Body weight curve of Ralaf/f (n = 6) and RalaBKO (n = 4) mice fed with HFD for 12 weeks. p-q, Body composition (p) and fat depot and liver weights (q) in HFD-fed Ralaf/f (n = 7) and RalaBKO (n = 5) mice at the age of 20-21 weeks. r, s, GTT (r) and ITT (s) were performed in HFD-fed Ralaf/f (n = 7) and RalaBKO (n = 5) mice at the age of 17-weeks or 20-weeks, respectively. The data are presented as the mean ± SEM (a-c, e-s), *P < 0.05 by two-tailed Student’s T-test (b, c, f, l) or two-way ANOVA with Bonferroni’s post-test (a, e, f, m-o, r, s). Source data
Extended Data Fig. 3
Extended Data Fig. 3. Neither CD-fed RalaAKO mice nor HFD-fed RalaBKO mice show increased energy expenditure.
a, Regression plot of energy expenditure (EE) during dark phase against body weight (BW) in CD-fed Ralaf/f and RalaAKO mice (n = 8). ANCOVA test using BW as a covariate, group effect P = 0.2805. b-e, BW-normalized oxygen consumption (b), respiratory exchange ratio (RER) (c), pedestrian locomotion (d) and food intake (e) over a two-days period were measured in CD-fed Ralaf/f and RalaAKO mice (n = 8) by metabolic cages. f-i, BW-normalized oxygen consumption (f), respiratory exchange ratio (RER) (g), pedestrian locomotion (h) and food intake (i) over a two-days period were measured in HFD-fed Ralaf/f (n = 8) and RalaAKO (n = 5) mice by metabolic cages. j, Regression plot of EE during dark phase against BW in HFD-fed Ralaf/f (n = 7) and RalaBKO (n = 5) mice. ANCOVA test using BW as a covariate, group effect P = 0.2792. k-n, BW-normalized oxygen consumption (k), respiratory exchange ratio (RER, l), pedestrian locomotion (m) and food intake (n) over a two-days period were measured in HFD-fed Ralaf/f (n = 7) and RalaBKO (n = 5) mice by metabolic cages. (o, p) Immunoblotting (o) and quantification (p) of OXPHOS proteins in eWAT of HFD-fed mice (Ralaf/f n = 8 and RalaAKO n = 12). (q, r) Immunoblotting (q) and quantitation (r) of OXPHOS proteins in BAT of HFD-fed mice (Ralaf/f n = 10 and RalaAKO n = 13). P < 0.0001, P = 0.0252 (r). s, Relative mRNA expression of browning-related genes in iWAT, eWAT and BAT of HFD-fed mice (Ralaf/f n = 8 and RalaAKO n = 13). P < 0.0001, P < 0.0001, P < 0.0001. The data (b-i, k-n, p-s) are shown as the mean ± SEM, *P < 0.05, ***P < 0.001 by two-tailed Student’s T-tesI (d, e, h, i, m, n, p-s), or two-way ANOVA with Bonferroni’s post-test (b, c, f, g, k, l). Source data
Extended Data Fig. 4
Extended Data Fig. 4. Absence of RalA in adipocytes did not affect free fatty acid release.
a, Calculation of individual OCR in differentiated primary adipocytes (n = 8 biological samples). P = 0.0008, P = 0.0175, P = 0.0042. b, Representative immunoblot of RalA and β-Tubulin in immortalized preadipocytes and differentiated adipocytes. (n = 3 biological samples). c, Quantification of mean TMRM fluorescence intensity in primary adipocytes and immortalized adipocytes (n = 3 independent cells). P < 0.0001, P < 0.0001. d, Time course TMRM intensity quantification in primary and immortalized adipocytes (n = 4 biological samples). Adipocytes were treated with 1 μM CL-316,243 (CL) for indicated times. P = 0.0015, P = 0.0044 (left panel). P < 0.0001, P = 0.0154, P = 0.0095 (right panel). e, f, Quantification of NEFA (e) and free glycerol (f) released into medium from immortalized adipocytes (n = 3 biological samples). Cells were treated with 1 µM CL, 100 nM insulin, or in combination prior to medium collection. P = 0.0301, P = 0.0051 (f). g, h, Plasma levels of NEFA (g) and free glycerol (h) in CD-fed Ralaf/f and RalaAKO mice (n = 6). P = 0.0027, P = 0.0173 (h). Mice were i.p. injected with CL or vehicle prior to blood sampling. i, j, Plasma levels of NEFA (i) and free glycerol (j) in CD-fed Ralaf/f (n = 4) and RalaAKO (n = 5) mice. Mice were either subjected to ad libitum feeding, overnight fasting or fasting plus insulin injection 15 min prior to harvesting. P = 0.0316 (j). The data (a, c-j) are shown as the mean ± SEM, *P < 0.05, **P < 0.01, ***P < 0.001, ****P < 0.0001 by two-tailed Student’s T-test (a, c, e-j) or two-way ANOVA with Bonferroni’s post-test (d). Source data
Extended Data Fig. 5
Extended Data Fig. 5. RalA inhibition did not affect mitochondrial biogenesis in WAT.
a, b, Relative mRNA expression of genes corresponding to mitochondrial biogenesis in iWAT (a) and eWAT (b) of HFD-fed Ralaf/f (n = 9) and RalaAKO (n = 10) mice. P = 0.0449, P = 0.0478. (a). c-f, Immunoblotting (c, d) and quantification (e, f) of phospho-AMPK (T172), total AMPK and β-Tubulin in iWAT (Ralaf/f n = 9, RalaAKO n = 14) (c, e) and eWAT (Ralaf/f n = 8, RalaAKO n = 12) (d, f) of HFD-fed mice. g, Maximal mitochondrial length in iWAT of CD-fed and HFD-fed mice (n = 3 biological samples). P < 0.0001, P < 0.0001, P = 0.1675. h, Representative TEM images of mitochondria in eWAT of HFD-fed mice, scale bar = 500 nm. i, Representative TEM images of mitochondria in BAT of HFD-fed mice, scale bar = 1 μm. j-l, Immunoblotting (j) and quantification (k, l) of Opa1 in iWAT of HFD-fed mice (Ralaf/f n = 10, RalaAKO n = 13). P = 0.0045 (k). P = 0.0044 (l). m-o, Immunoblotting (m) and quantification (n, o) of Opa1 in eWAT of HFD-fed mice (Ralaf/f n = 14, RalaAKO n = 10). P = 0.0063 (o). The data (a, b, e-g, k, l, n, o) are shown as the mean ± SEM, *P < 0.05, **P < 0.01, ****P < 0.0001 by two-tailed Student’s T-test (a, g, k, l, o). Source data
Extended Data Fig. 6
Extended Data Fig. 6. Rala deletion in adipocytes did not affect cAMP production and HSL phosphorylation.
a, Immunoblotting of phospho-Drp1 S637, total Drp1 and β-Tubulin in iWAT of HFD-fed Ralaf/f (n = 10) and RalaAKO (n = 13) mice. b, c, Immunoblotting (b) and quantification (c) of phospho-Drp1(S637), total Drp1, and β-Tubulin in eWAT of HFD-fed Ralaf/f (n = 8) and RalaAKO (n = 12) mice. d, e, Immunoblotting (d) and quantification (e) of phospho-Drp1 (S637), total Drp1 and β-Actin in iWAT of CD-fed mice. Non-fasted Ralaf/f (vehicle n = 3, CL n = 4) and RalaAKO (vehicle n = 3, CL n = 5) mice fed with CD were i.p. injected with 1 mg/kg CL for 30 min. P = 0.0054, P = 0.0135 (e). f, g, Immunoblotting (f) and quantification (g) of phospho-Drp1 (S637), total Drp1, RalA, and β-Actin in fully differentiated primary adipocytes (n = 4 biological samples). P = 0.0085, P = 0.0046 (g). Adipocytes were differentiated from stromal vascular fraction (SVF) isolated from 8-week-old female mice, and were treated with 1 μM CL for indicated time. h, i, Immunoblotting (h) and quantification (i) of phospho-Drp1 (S637), total Drp1, RalA, and β-Actin in immortalized adipocytes (n = 4 biological samples). P = 0.0159, P = 0.0086 (i). Adipocytes were treated with 1 μM CL for indicated time. j, k, Immunoblotting (j) and quantification (k) of phospho-Drp1 (S637), total Drp1, and β-Actin in 3T3-L1 adipocytes (n = 4 biological samples). P = 0.0009 (k). Cells were pretreated with 50 μM RBC8 or DMSO for 30 min, then treated with 5 μM forskolin (Fsk) for indicated time. l, Determination of intracellular cAMP levels in differentiated WT and RalaAKO (KO) primary adipocytes (n = 4 biological samples). Cells were treated with CL for 5 min prior to harvesting. m, n, Quantification of phospho-HSL(S660) and HSL in primary (m) and immortalized adipocytes (n) treated with CL for indicated time (n = 4 biological samples). o, Maximal mitochondrial length in immortalized adipocytes expressing Drp1 mutants (n = 3 independent cells). P < 0.0001 3.1 vs Drp1WT, P < 0.0001 Drp1WT vs Drp1SD, P < 0.0001 Drp1SD vs Drp1SA. p-r, Transcriptomics and clinical data were directly accessed from GEO database (GSE70353). p, q, DNM1L mRNA expression is correlated with BMI (p) and HOMA (q) in human subcutaneous adipose tissue samples (n = 770). P = 0.0002 (p). P = 0.0019 (q). r, Box-and-whisker plot of DNM1L mRNA expression in abdominal subcutaneous adipose tissues from 770 individuals with or without obesity. Benjamini and Hochberg-adjusted P value (adj. p) is 0.014186. The box plot is presented as a box: 25th to 75th percentile, and whiskers: min to max. The data (c, e, g, i, k, l, m, n, o) are shown as the mean ± SEM, *P < 0.05, **P < 0.01, ***P < 0.001, ****P < 0.0001 by two-tailed Student’s T-test (e, g, i, k, o). Significance in correlation was assessed by Spearman’s correlation test (p, q). Source data
Extended Data Fig. 7
Extended Data Fig. 7. Knockout of RalA increases PP2Aa content.
a, Representative immunoblotting of co-immunoprecipitated between Flag-RalAWT, Flag-RalAG23V, or Flag-RalAS28N and Myc-Drp1 proteins in HEK293T cells. b, Representative in vitro dephosphorylation assay in PP2Ab and Drp1 co-transfected HEK293T cells treated with or without 20 μM forskolin (Fsk) for 1 hr. c, Quantification of Drp1 and RalA co-localization using Pearson’s method (n = 3 independent cells). P < 0.0001. d, Quantification of phospho-Drp1 (S637) and total Drp1 in immortalized RalA KO adipocytes with or without RalA reconstitution (n = 3 biological samples). 15 min: P = 0.0164 KO vs +WT, P = 0.0015 KO vs +GV. 30 min: P = 0.0185 KO vs +WT, P = 0.0087 KO vs +GV. Adipocytes were treated with 20 μM forskolin for indicated time. e, Quantification of TMRM fluorescence intensity in immortalized RalA KO adipocytes with or without RalA reconstitution (n = 3 independent cells). P < 0.0001 KO vs +WT. P < 0.0001 KO vs +GV. f, Calculated OCR in each state from immortalized RalA KO adipocytes with or without RalA reconstitution (WT = 6, +WT = 10, +GV = 9 biological samples). P < 0.0001, P = 0.0423, P = 0.0015, P = 0.0060. g, Maximal mitochondrial length in immortalized adipocytes (n = 3 independent cells). P < 0.0001 KO vs +WT. P < 0.0001 KO vs +GV. h, i, Quantification of fission (h) and fusion (i) events in immortalized adipocytes (KO = 92, +WT = 41). P = 0.0252 (h). P = 0.0879 (i). j, k, Immunoblotting (j) and quantification (k) of PP2Aa, PP2Ab, PP2Ac, and β-Tubulin in iWAT of HFD-fed mice (Ralaf/f n = 10, RalaAKO n = 13). P = 0.0039 (k). The data (c, d, e, f, g, k) are shown as the mean ± SEM, *P < 0.05, **P < 0.01, ***P < 0.001, ****P < 0.0001 by two-tailed Student’s T-test (c, d, e, f, g, h, k). Source data
Extended Data Fig. 8
Extended Data Fig. 8. Mechanistic model depicting how RalA regulates mitochondrial function in obese adipocytes. Created with BioRender.com.
Obesity drives RalA expression and GTP binding activity, leading to its association with PP2Aa, which in turn recruits the catalytic subunit PP2Ac to dephosphorylate Drp1 S637. Also, catecholamine resistance could reduce PKA-catalyzed S637 phosphorylation. The combined effects converging on RalA-PP2A-Drp1signaling axis result in constitutive mitochondrial translocation of Drp1 and fragmented mitochondria in adipocytes from obese subjects.

Update of

References

    1. Haththotuwa, R. N., Wijeyaratne, C. N., and Senarath, U. Worldwide epidemic of obesity. Obes. Obstet.10.1016/B978-0-12-817921-5.00001-1 (2020).
    1. Saltiel AR. Insulin resistance in the defense against obesity. Cell Metab. 2012;15:798–804. doi: 10.1016/j.cmet.2012.03.001. - DOI - PubMed
    1. Saltiel AR, Kahn CR. Insulin signalling and the regulation of glucose and lipid metabolism. Nature. 2001;414:799–806. doi: 10.1038/414799a. - DOI - PubMed
    1. Kahn SE, Hull RL, Utzschneider KM. Mechanisms linking obesity to insulin resistance and type 2 diabetes. Nature. 2006;444:840–846. doi: 10.1038/nature05482. - DOI - PubMed
    1. Reilly SM, Saltiel AR. Adapting to obesity with adipose tissue inflammation. Nat. Rev. Endocrinol. 2017;13:633–643. doi: 10.1038/nrendo.2017.90. - DOI - PubMed