. 2024 Mar;5(3):433-447.
doi: 10.1038/s43018-023-00704-x. Epub 2024 Jan 29.

Loss of Pip4k2c confers liver-metastatic organotropism through insulin-dependent PI3K-AKT pathway activation

Affiliations

Loss of Pip4k2c confers liver-metastatic organotropism through insulin-dependent PI3K-AKT pathway activation

Meri Rogava et al. Nat Cancer. 2024 Mar.

Abstract

Liver metastasis (LM) confers poor survival and therapy resistance across cancer types, but the mechanisms of liver-metastatic organotropism remain unknown. Here, through in vivo CRISPR-Cas9 screens, we found that Pip4k2c loss conferred LM but had no impact on lung metastasis or primary tumor growth. Pip4k2c-deficient cells were hypersensitized to insulin-mediated PI3K/AKT signaling and exploited the insulin-rich liver milieu for organ-specific metastasis. We observed concordant changes in PIP4K2C expression and distinct metabolic changes in 3,511 patient melanomas, including primary tumors, LMs and lung metastases. We found that systemic PI3K inhibition exacerbated LM burden in mice injected with Pip4k2c-deficient cancer cells through host-mediated increase in hepatic insulin levels; however, this circuit could be broken by concurrent administration of an SGLT2 inhibitor or feeding of a ketogenic diet. Thus, this work demonstrates a rare example of metastatic organotropism through co-optation of physiological metabolic cues and proposes therapeutic avenues to counteract these mechanisms.


Conflict of interest statement

B.I. has received consulting fees/honoraria from Volastra Therapeutics Inc, Merck, AstraZeneca, Eisai and Janssen Pharmaceuticals and has received research funding to Columbia University from Alkermes, Arcus Biosciences, Checkmate Pharmaceuticals, Compugen, Immunocore, and Synthekine. None of these are relevant to the current work. C.G. has received consulting fees from Watershed Informatics. S.F.B. owns equity in, receives compensation from, and serves as a consultant and the Scientific Advisory Board and Board of Directors of Volastra Therapeutics Inc. L.C.C. is a co-founder, member of the SAB, and holds equity in Agios, Petra, Volastra Therapeutics Inc., Faeth, and Larkspur. These companies are developing novel therapies for cancer, though drugs from these companies are not discussed in this manuscript. DS reports grants (to institution) from Amgen, Array/Pfizer, Bristol-Myers Squibb, MSD, Novartis, and Roche; consulting fees/honoraria from 4SC, Amgen, Array Biopharma, AstraZeneca, Bristol-Myers Squibb, Daiichi Sankyo, Haystick, Immunocore, InFlarX, Innocent, LabCorp, Merck Serono, MSD, Nektar, NeraCare, Novartis, OncoSec, Pfizer, Philogen, Pierre Fabre, Replimune, Roche, Sandoz, Sanofi/Regeneron, and Sun Pharma; support for attendings meetings or travel support from Bristol-Myers Squibb, MSD, Merck Serono, Novartis, Pierre Fabre, and Sanofi; participation on drug safety monitoring or advisory boards for 4SC, Amgen, Array Biopharma, AstraZeneca, Bristol-Myers Squibb, Daiichi Sankyo, Immunocore, InFlarX, Merck Serono, MSD, Nektar, NeraCare, Novartis, OncoSec, Pfizer, Philogen, Pierre Fabre, Replimune, Roche, Sandoz, Sanofi/Regeneron, and SunPharma; and leadership roles for DeCOG, German Cancer Society, Hiege-Stiftung, Deutsche Hautkrebsstiftung, Nationale Versorgungskonferenz Hautkrebs (NVKH) and European Melanoma Registry (EuMelaReg). S.K.D., S.W. and G.S. are employees of Caris Life Sciences. The remaining authors declare no competing interests

Figures
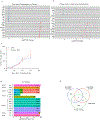
Extended Data Fig. 1
Extended Data Fig. 1. Cas9 expressing HCmel12 melanoma cell line generation, mouse kinome (Brie) library titration and kinome (Brie) sgRNA representation at different steps of tumor cell editing, primary tumor growth, and metastasis.
a, Assessment of Cas9-activity using an EGFP/EGFP-sgRNA-reporter using flow-cytometry in HCmel12 melanoma with Cas9-expression, alongside HCmel12 melanoma cells expressing Cas9 without reporter (negative control), and parental HCmel12 cells without Cas9 but with reporter (positive control). EGFP negative cells (rightmost plot) indicated activity of ~94%. b, Transduction of lentiviral library in Cas9-expressing HCmel12 melanoma cells. Percentage of tumor cells (y axis) transduced with the Brie library at virus dilutions (x axis). c, Proportion of cells calculated to be infected by one sgRNA-containing viral particle (y axis) at different dilutions of the Brie library (x axis). Filled graphs in (b,c) indicate viral concentration/dilution used for the large-scale CRISPR screen. d, Pearson correlation coefficient of the normalized sgRNA read counts from Brie plasmid pool, transduced cells in vitro edited over time (10, 14, 21, 28, 35, 42, 49, 56 days after spin infection), from primary tumors (n=8), from liver (n=14), lung (n=3), and lymph node (n=8) metastases. For each biological sample type, biological replicates (R1, R2, R3… R8), for technical replicates (R3.1, R3.2) are shown. n=8 mice for primary tumors, n=7 mice with Liver mets, n=3 mice with lung mets, n=7 mice with LN mets. e, Boxplot of the normalized sgRNA read counts as in (d). Outliers are shown as colored dots for each respective sample. f, Principal component analysis (PCA) of normalized sgRNA read counts. X- and y-axis with indicated explained variance of 49.7% and 5.4%, respectively. Samples from Brie plasmid, cells and primary tumors are shown in black while metastases are shown in red. Data is representative of two independent experiments.
Extended Data Fig. 2
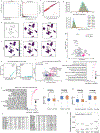
Extended Data Fig. 2. CRIPSR/Cas9 viability screen in HCmel12 melanoma cells in vitro, Identification of essential genes and genes affecting engraftment of tumor cells in vivo followed by Identification of genes affecting liver tropism.
a, b, LFC for all four individual sgRNAs targeting genes enriched (red lines) or depleted (blue lines) in cells vs plasmid (a), and primary tumor vs cells before transplantation (b), are depicted. The top and bottom 10 enriched or depleted genes are labelled with gene symbols. c, Tumor growth curves in mice transplanted with Cas9 (n = 5 mice) or Brie-transduced (Cas9 + Brie) HCmel12 melanomas (n = 10 mice) are shown; mean± s.e.m. d, Bar graphs showing enrichment of sgRNAs targeted genes in among sgRNAs in liver metastasis. For each of the 14 individual liver metastasis samples (rows) harvested from 7 individual mice, the abundances of sgRNAs reads as a proportion of all reads are shown. Only target genes with at least 2% of the total reads in a sample are shown. e, Venn diagram showing the overlap of enriched sgRNAs in indicated comparisons with FDR < 0.06. Data is representative of two independent experiments.
Extended Data Fig. 3
Extended Data Fig. 3. Generation and validation of CRISPR knockout cells in vitro.
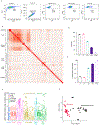
a, Immunoblot showing efficacy of CRISPR Cas9-mediated knockout of Pip4k2c using four sgRNAs. b, Resulting insertions/deletions for Pip4k2c sgRNA #194 analyzed by Sanger sequencing with Tracking of Indels by Decomposition (TIDE https://tide.nki.nl) and estimated efficiency of Cas9-mediated cuts. c, Immunoblots of phosphorylated and total AKT at two phosphorylation sites pAktS473 and pAktT308 in parental and two of Pip4k2c KO clones over time. d,e, Immunoblot showing efficacy of CRISPR Cas9-mediated knockout of PIP4K2C using guide #5 in human A375 melanoma cell lines (d) and resulting indels (e) as in (b). f, Immunoblot of HCmel12 parental or Pip4k2c KO cells treated with insulin, and/or GDC-0941 (0.1μM) or BYL-719 (1μM). Blotted is the total abundance of insulin receptor (Insr) and phosrpho-Insr. g, Effect of insulin treatment on migration potential measured by transwell assay. Shown is the mean number of migrated parental and Pip4k2c KO cells with and without insulin treatment. n=3 replicates per condition; mean ± s.e.m. h, Same as in (g) for A375 melanoma cell lines. i,j, Proliferation assay of HCmel12 (i) or A375 (j) Pip4k2c WT and Pip4k2c KO melanoma cells at different insulin concentrations over time. Cell counts were normalized to t0 proliferation is shown as fold change. n=3 replicates per condition; mean± s.e.m. k, Gene set enrichment analysis of RNA-seq data comparing Pip4k2c KO with parental cells stimulated with insulin. Exemplary pathway enrichment for mTORC1 is shown. l, Amino acid sequence of wild-type ORF (top) and allosteric domain deficient (AD) Pip4k2c. m,n, Immunoblots showing phosphor-AKT in parental, Pip4k2c KO, and Pip4k2c KO rescued with either wild-type Pip4k2c allele (Pip4k2c Rec) or allosteric domain-deficient (Pip4k2c AD) and combinatorial exposure to insulin (250ng/ml, first row) and PI3K inhibitor GDC-0941 (0.1μM, second row) or BYL-719 (1μM, third row) in murine HCmel12 (m) or human A375 (n) melanoma models. Samples are derived from the same experiment and gels/blots were processed in parallel. o, Incidence of liver metastasis in mice bearing A375 PIP4K2C WT and PIP4K2C KO melanoma cells, n=10 mice per group; p, C-peptide levels (in pM) for Pip4k2c WT and Pip4k2c KO HCmel12 tumor-bearing animals with and without GDC-0941 treatment. Plasma was collected after 2 hours of treatment with GDC-0941 and vehicle treatment was used as control, n=5 mice per group. Statistical significance was determined using 2-way ANOVA Tukey’s multiple comparisons test for (g,h,p). Data is representative of two independent experiments (g,h,i,j,o,p). Significance levels as indicated.
Extended Data Fig. 4
Extended Data Fig. 4. Validation of findings in mouse and human metastatic samples using scRNA-seq and Bulk RNA-seq.
a-c, Quality control plots for single cell RNA sequence data. Cells were filtered based on (a) cumulative number of transcript counts, (b) fraction of mitochondrial mRNA detected per cell and (c) cell complexity as described in the methods; shown here for one representative library. d, Kernel Density Estimate (KDE) plots showing distribution across cells of total number of transcripts (top) and mitochondrial fraction (bottom) for each sample. e,f, UMAP projections showing the tumor cell population, mean log-transformed gene expression of tumor cell marker gene signature, and log-transformed expression of select individual tumor cell marker genes. g, Top differentially expressed genes in liver metastasis (pink) vs lung metastasis (purple) tumor cells. Genes are projected by the −log10(p_adj) by the averagelog2(FC) and the most significant DEGs are labelled (padj < 0.05, Wilcoxon test). h, PCA of LM biopsy data across cancer types from Met500 and additional LM from melanoma patient biopsies (LM15) generated in this study pre- or post-batch correction with ComBat_seq (Methods). i, Differentially expressed genes in liver (n=78, Met500; n=15, LM15, pink) vs lung (n=16, Met500, purple) metastases from patients across cancer types. Genes are projected by average log2 Fold Change by the -log10(FDR) with genes significantly enriched (FDR q-value <0.05, Mann-Whitney test) in liver (pink) and in lung (purple) metastasis tumor samples, with specific genes of interest labelled. j, Pathway enrichment analysis (FDR q-value < 0.05, GSEA) in liver (n=41, Met500; n=15, LM15, pink) vs non-liver (n=100, Met500, purple) metastases including only with 70% tumor cell purity. k, Pathway enrichment analysis (FDR q-value < 0.05, GSEA) in liver (n=41, Met500; n=15, LM15, pink) vs lung (n=9, Met500, purple) metastases including only with 70% tumor cell purity. l,m, Expression levels of PIP4K2A/B in primary tumors vs. liver metastases (l) and liver vs. lung metastases (m). n, Frequency of genomic alterations across primary cutaneous melanomas and liver metastases from Caris melanoma patient cohort. The left table summarizes the frequencies between primary tumors and liver metastases for selected genes in the PI3K/AKT pathway, along with adjusted p and q values (methods), and the right table indicates unbiased analyses across all interrogated gene mutations among the same sites. o, Expression of Pip4k2c in primary prostate cancers, lymph node, lung, bone and liver metastases from the Arriaga et al. cohort; for all boxplots, n refers to the number of samples, and p refers to the p-value. The center line indicates the median, the box limits denote the first and third quartiles, and the whiskers indicate the lowest or highest data points at the first quartile minus or plus 1.5 times the interquartile range. Statistical significance was determined using Frequency of genomic alterations: Mann-Whitney U Two-tailed test for (l, m) and chi-square or Fisher’s Exact for (n). Significance as indicated.
Extended Data Fig. 5
Extended Data Fig. 5. Metastatic site influences tumor cell metabolic state.
a, Score plot of a PCA analysis of all putatively identified metabolites by LC-MS in positive ionization mode. b, Score plot of a PLS-DA analysis of putatively identified metabolites by LC-MS in negative ionization mode comparing liver and lung metastatic samples from animals with A375 human melanomas with indicated genotypes (Methods). c, VIP score plot generated based on a PLS-DA of putatively identified metabolites by LC-MS in negative ionization mode comparing liver and lung metastatic samples from animals with A375 human melanomas with indicated genotypes, showing a strong change in lactic acid, glutamic acid and a hexose (e.g. glucose) that is causing the separation of the groups in (b). d, Heat map of results from a suspected targeted analysis. Compounds were manually identified in the LC-MS data based on MS1 accurate mass and MS2-spectrum. The corresponding peaks were integrated, and the results normalized by 13 C2-Citric acid that was spiked to the sample as an internal standard. The compounds were selected based on the multivariate data analysis indicating a change in the glycolysis and/or TCA cycle. disease site, liver (n=8 specimens) vs. lung (n=10 specimens); and genotype, parental [PIP4K2C WT] and PIP4K2C KO. Statistical significance was determined using Two-tailed t-test for (d), Lactate (p=2.36727E-05), Pyruvate (p=0.03), Citrate (p=0.25), a-Ketoglutarate (p=0.18), Succinate (p=0.004), Fumarate (p=0.04), Malate (p=0.04), Hexose (p= 6.72275E-06). e, Extracted ion chromatograms (left) and corresponding MS2 spectra of the putatively identified hexose (e.g. glucose) with an accurate mass for the [M-H]- ion of 179.5610 (top) and of lactic acid with an accurate mass for the [M-H]- ion of 89.0244 (bottom). Much lower intensities were detected in the lung samples compared to the liver samples (Right).
Extended Data Fig. 6
Extended Data Fig. 6. Role of Pip4k2c loss in primary tumor growth and response to systemic therapies.
a, Immunoblots in matched cell lines with indicated genotypes (top) and combinatorial exposure to insulin (250ng/ml, first row), PI3K inhibitors GDC-0941 (0.1μM, second row), and Doxycycline (1μg/ml, third row). b, Combined tumor diameter at day 24 in treatment groups across genotypes; n=10 mice per condition. Box plots denote the minima, maxima and median. Experiment was repeated twice with similar results. Statistical significance was determined using One-way ANOVA Tukey’s multiple comparisons test. Data is representative of two independent experiments (b). Significance levels as indicated.
Figure 1.
Figure 1.. In vivo CRISPR-Cas9 screen identifies drivers of liver metastasis.
a, Experimental design of in vivo CRISPR-Cas9 screen. b, Photographs of representative livers removed from animals in different groups as indicated. Yellow arrowheads indicate pigmented and non-pigmented liver metastases. c, Hematoxylin and Eosin staining of representative sections of livers from indicated groups, scale bar 2mm, 40x magnification (n=2 independent experiments). d, Stack bar plots indicate fraction of animals bearing liver metastases across different experimental groups. e,f Liver metastasis count (e) and calculated liver metastasis disease burden (f) across experimental groups. g, Lung metastasis count in corresponding animals from (f); (d-g), n=9 mice per group; bars represent mean ± s.e.m.; One-Way ANOVA Tukey’s multiple comparisons test. Data is representative of two independent experiments (d-g). Significance levels as indicated on top of each comparison. h, Exemplary distribution of sgRNA read fractions in three animals from the in vivo CRISPR-Cas9 metastasis screen. Pie charts show the fraction of the most abundant sgRNAs (sgRNAs with >2% of total reads) in each individual liver metastatic lesion next to each animal. i, Summary of fractions of enriched sgRNAs across all lesions from (h) within the individual mouse (larger pie charts below each animal).
Figure 2.
Figure 2.. Loss of Pip4k2c enhances sensitivity to insulin and promotes liver metastasis, but not lung metastasis.
a,b, Immunoblots showing phosphorylated and total protein of key signaling nodes of pAktS473 and pAktT308 in WT or Pip4k2cKO cells in (a) HCmel12 and (b) A375 melanoma cell models with (+) or without (-) insulin (250ng/ml) stimulation. c,d, Liver metastasis disease burden (in mm3) and lung metastases count following tail vein injection of parental and Pip4k2c KO HCmel12 melanoma in C57BL/6 mice. e,f, Liver and lung metastasis burden following tail vein injection of parental and PIP4K2C KO A375 melanoma cells in NSG mice. g, Incidence of macroscopic liver metastasis in animals following orthotopic injection of parental or Pip4k2c KO CT26 colorectal cancer cells in BALB/c mice. h, Comparison of tumor weight of primary tumors from experiment shown in (g); (c-f) n=10 mice per group; (g-h) n=4–5 mice per group; mean ±s.e.m. One-Way ANOVA Tukey’s multiple comparisons test for (c,d) and Mann-Whitney Two-tailed test for (e-g). Data are representative of three (c,d), two (e,f) or one (h,g) independent experiments. Significance levels as indicated on top of each comparison.
Figure 3.
Figure 3.. Systemic feedback loop induced by PI3K inhibitor treatment in vivo promotes liver organotropism in Pip4k2c-deficient tumors in an insulin-dependent manner.
a, Liver metastasis disease burden (in mm3) upon tail vein injection of parental and Pip4k2c KO HCmel12 melanoma cells with and without GDC-0941 treatment (daily, 5 days a week, 100mg/kg). b, Lung metastasis burden (metastasis count) in corresponding animals from (a). n = 10 mice per group; mean ±s.e.m; c, Blood glucose levels (in mg/dL) in mice following treatment with GDC-0941 or vehicle control over time (minutes). D, C-peptide levels (in pM) in corresponding animals from (c); n = 10 mice per group; mean ±s.e.m; 2-way ANOVA Tukey’s multiple comparisons test for (a-b) and Mann-Whitney Two-tailed test for (c-d). Significance levels as indicated. E, f, Quantification of FDG-μPET (18F-Fluorodeoxyglucose in per cent of injected dose (ID) per gram of (e)) and corresponding liver metastasis uptake (f) 60 min after GDC-0941 administration or vehicle control. Yellow arrows indicate individual liver metastatic lesions. Cardiac FDG-uptake is visualized (asterisk); n=3 mice per group, mean ±s.e.m; unpaired two-sided-t-test (e). g, Insulin levels (in pg/ul) in liver and lung tissues from non-tumor bearing mice. n=10 mice per group, mean ±s.e.m; Mann-Whitney Two-tailed test. h, Schematic illustrating the insulin pad experiment in mice; i, j, Percentage of metastasis surface area in liver (i) and lung (j) of animals implanted with a control pad or insulin pad, and followed by injection of tumor cells via tail vein in NSG mice. k, Ratio of lung over liver metastatic burden from experiment in (i,j); n=5 mice per group; mean ± s.e.m; Mann-Whitney Two-tailed test; Data are representative of three (a-d), two (e-k) independent experiments. Significance levels as indicated on top of each comparison.
Figure 4.
Figure 4.. multi-omics analysis of human and mouse liver and lung metastasis.
a, Top enriched pathways (adjusted p value < 0.05, top 5 pathways per gene set ranked by NES) of cancer cells isolated from concurrent liver (n=8 specimens, pink) vs lung (n=8 specimens, purple) metastases in mice injected with HCmel12 melanoma cells. b, Pathway enrichment (FDR q-value < 0.05) within Arriaga et al., cohort comparing liver (n=7 specimens, pink) vs. lung (n=14 specimens, purple) metastases in a prostate cancer metastasis model. c, Enriched pathways (FDR q-value < 0.05) in liver (n=78 patients, Met500; n=15 patients, LM15, pink) vs lung (n=16 patients, Met500, purple) metastases across tumors. d, Enriched pathways (adjusted p value < 0.05) in liver (n=364) vs lung (n=743) metastases in patients with melanoma tumors; FDR value for GSEA was obtained by Benjamin-Hochberg correction. e,f, Expression of PIP4K2C in melanoma patient tumors comparing primary cutaneous tumors (n=2,404 patients) vs liver (n=364) (e), and liver (n=364 patients) vs lung (n= 743 patients). Mann-Whitney Two-tailed test. g, Expression of Pip4k2c from the Arriaga et al., cohort comparing liver (n=7 specimens) vs lung (n=14 specimens), Wilcoxon rank-sum test. For all boxplots, n refers to the number of samples, and p refers to the p-value. The center line indicates the median, the box limits denote the first and third quartiles, and the whiskers indicate the lowest or highest data points at the first quartile minus or plus 1.5 times the interquartile range; Significance levels as indicated. h, Cumulative results of selected top differentially abundant metabolites in animals with liver and/or lung metastases following injection with either parental (PIP4K2CWT) or PIP4K2CKO A375 human melanoma cells; n=5 mice per group; unpaired two-sided-t-test. Lactate (p=2.36727E-05), Pyruvate (p=0.03), Citrate (p=0.25), a-Ketoglutarate (p=0.18), Succinate (p=0.004), Fumarate (p=0.04), Malate (p=0.04), Hexose (p= 6.72275E-06).
Figure 5.
Figure 5.. Genetic, dietary or pharmacological strategies disrupting systemic host effects of PI3K-inhibition reduces metastatic liver organotropism.
a, Immunoblot probing Insr in Pip4k2cKO/InsrshIR cells prior to use for in vivo experiments (in b-c). b, Liver metastasis disease burden (in mm3) following tail vein injection of Pip4k2cKO/InsrshIR without dox, GDC-0941 alone, dox-induced Insr knockdown alone, and combination of dox-induced Insr knockdown and GDC-0941. c, Lung metastasis burden (metastasis count) in corresponding animals from (b); n=10 mice per group. d, Blood glucose levels (in mg/dL) measured in mice (n=7 mice per group) following treatment with indicated diet or drugs (30 minutes post-administration) or vehicle control. e, C-peptide levels (in pM) following treatment with indicated combinations of GDC-0941 with SGLT2 inhibition or animals fed with ketogenic diet (n=11 mice per group). f, Liver metastasis disease burden (in mm3) following tail vein injection of Pip4k2cKO cells with drug treatments (SGLT2i, GDC-0941), ketogenic diet or combinations thereof in indicated groups. g, Lung metastasis burden (metastasis count) in corresponding animals from (f); n=10 mice per group, mean± s.e.m.; h, Tumor growth of subcutaneously injected HCmel12 parental or Pip4k2c KO melanoma cell lines following no treatment, treatment with GDC-0941 alone, or combination of GDC-0941 plus SGLT2 inhibition; n=5 mice per group, mean± s.e.m. i, Tumor diameter at day 24 in indicated treatment and genotype groups from (h). Box plots denote the minima, maxima and median in (h). Statistical significance was determined using One-Way ANOVA Tukey’s multiple comparisons test for (b-h). Data are representative of three (b-g) and two (h, i) independent experiments. Significance levels as indicated.
Figure 6.
Figure 6.. Schematic of Liver metastatic organotropism.
Model illustrating increased liver metastatic burden in animals injected with Pip4k2cKO cells, (1) effects of systemic PI3K inhibition, and strategies to overcome compensatory feedback loop and increased liver metastatic burden with either (2) ketogenic diet or (3) SGLT2-inhibition.

Similar articles

Cited by

References

    1. Chaffer CL & Weinberg RA A Perspective on Cancer Cell Metastasis. Science 331, 1559–1564 (2011). - PubMed
    1. Gao Y et al. Metastasis Organotropism: Redefining the Congenial Soil. Developmental Cell 49, 375–391 (2019). - PMC - PubMed
    1. Tsilimigras DI et al. Liver metastases. Nat Rev Dis Primers 7, 27 (2021). - PubMed
    1. Lee JC et al. Regulatory T cell control of systemic immunity and immunotherapy response in liver metastasis. Sci. Immunol 5, eaba0759 (2020). - PMC - PubMed
    1. Tumeh PC et al. Liver Metastasis and Treatment Outcome with Anti-PD-1 Monoclonal Antibody in Patients with Melanoma and NSCLC. Cancer Immunol Res 5, 417–424 (2017). - PMC - PubMed

Publication types

Substances