. 2024 Jan 29;15(1):864.
doi: 10.1038/s41467-024-45144-y.

Two way workable microchanneled hydrogel suture to diagnose, treat and monitor the infarcted heart

Affiliations

Two way workable microchanneled hydrogel suture to diagnose, treat and monitor the infarcted heart

Fangchao Xue et al. Nat Commun. .

Abstract

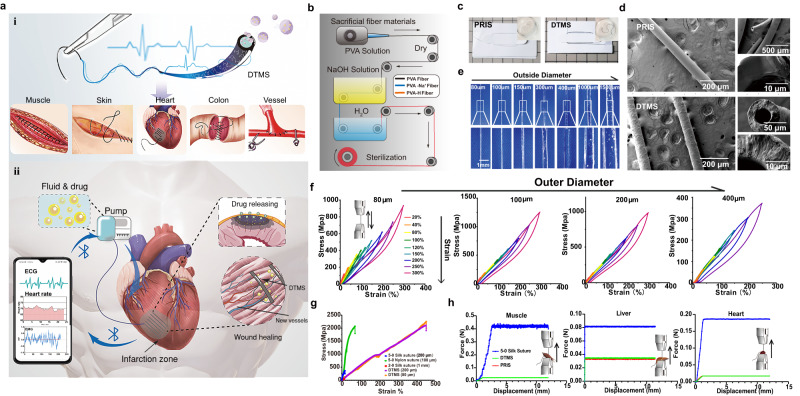
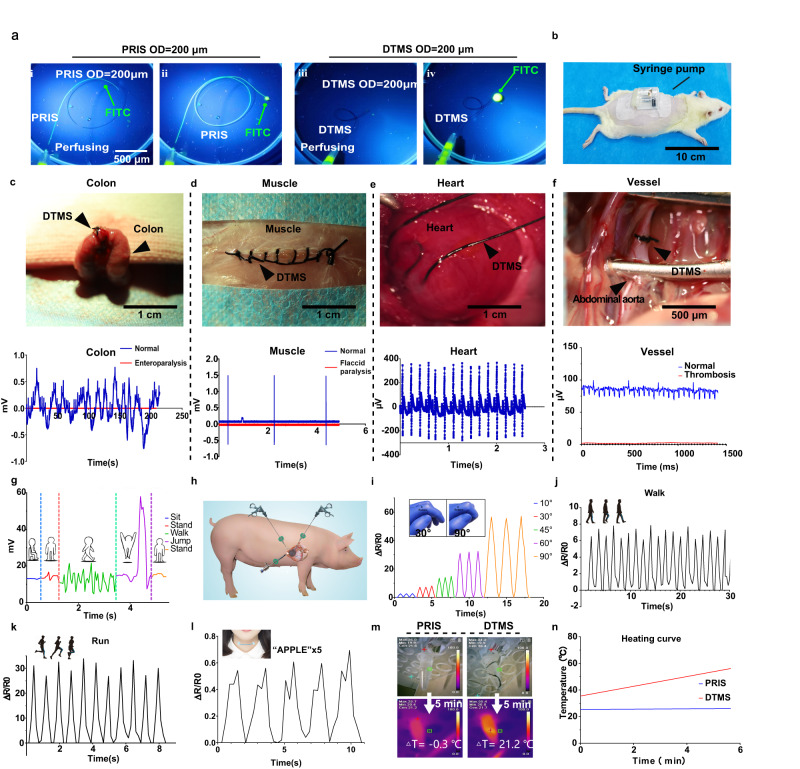
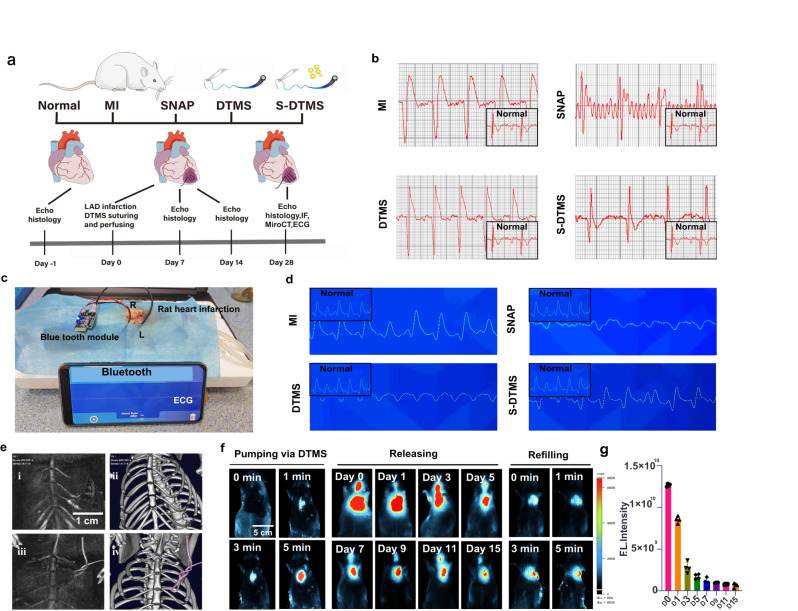
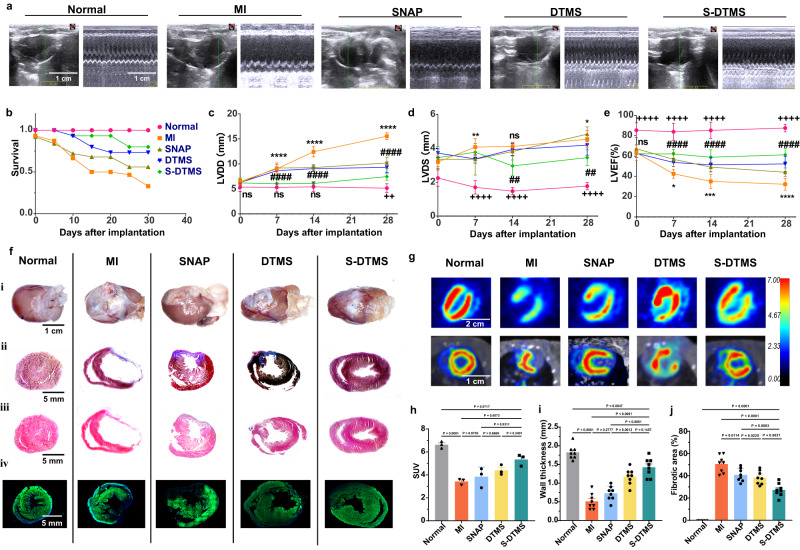
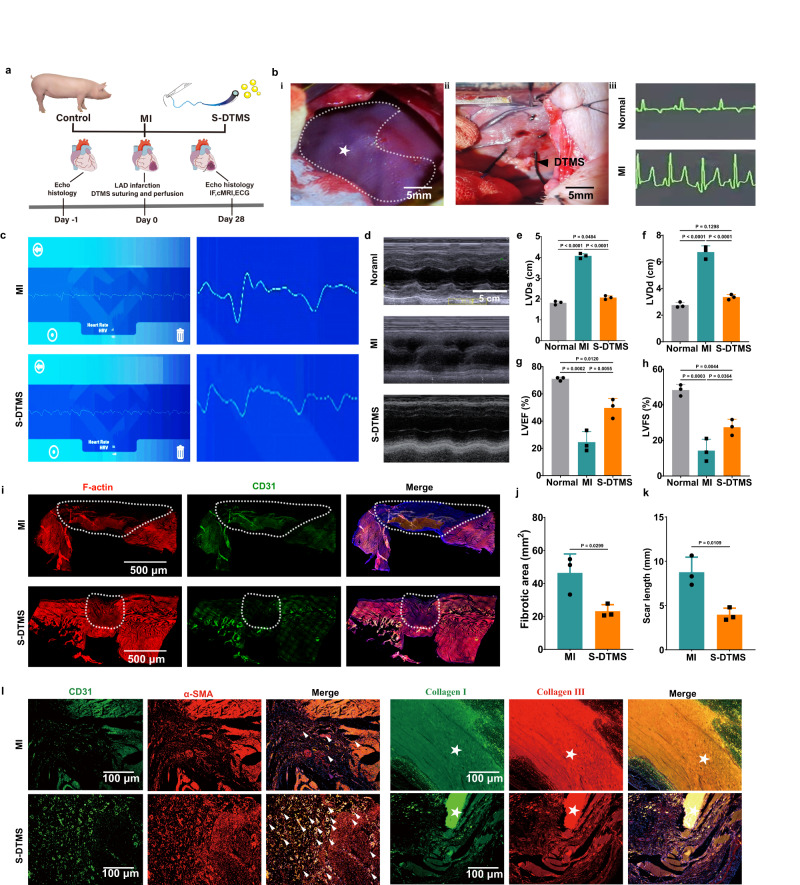
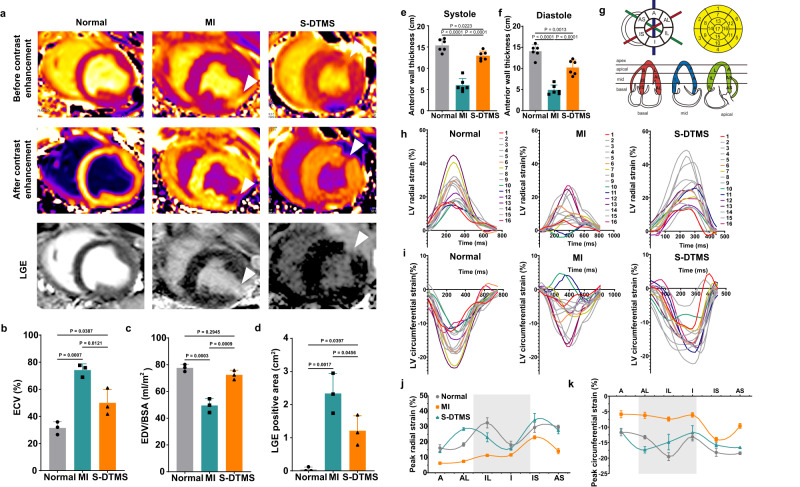
During myocardial infarction, microcirculation disturbance in the ischemic area can cause necrosis and formation of fibrotic tissue, potentially leading to malignant arrhythmia and myocardial remodeling. Here, we report a microchanneled hydrogel suture for two-way signal communication, pumping drugs on demand, and cardiac repair. After myocardial infarction, our hydrogel suture monitors abnormal electrocardiogram through the mobile device and triggers nitric oxide on demand via the hydrogel sutures' microchannels, thereby inhibiting inflammation, promoting microvascular remodeling, and improving the left ventricular ejection fraction in rats and minipigs by more than 60% and 50%, respectively. This work proposes a suture for bidirectional communication that acts as a cardio-patch to repair myocardial infarction, that remotely monitors the heart, and can deliver drugs on demand.


Conflict of interest statement

The authors declare no competing interests.

Figures

Fig. 1
Fig. 1. Concept design, preparation, and physical characterization of DTMS.
a The diagnosis, treatment, and monitoring suture (DTMS) in the scheme for different tissues (i), DTMS conducting signals of infarcted hear and delivering drugs on demand (ii). b Manufacturing process of PVA hydrogel suture. c DTMS and PRIS (Primary Suture). d Scanning electron microscope (SEM) of DTMS and PRIS (Primary Suture), n = 4 independent replications with similar results. e Transparent PRIS with outer diameter (OD) of 80 μm, 150 μm, 300 μm, 400 μm, 1000 μm, 1.5 mm and inner diameter (ID) of 50 μm, 80 μm, 150 μm, 300 μm, 400 μm, 1000 μm. f Loading and unloading curve of DTMS with OD = 100,200 and 400 μm with the same ID of 80 μm. g Breaking strength of DTMS (ID = 50 μm, OD = 80 and 200 μm), silk suture® (diameter = 200 μm and 1 mm), nylon suture® (diameter = 100 μm) h Pulling resistance test of sutures from skeletal muscle, liver, and myocardium. (DTMS and PRIS with ID = 80 μm and OD = 200 μm), silk suture® (diameter = 200 μm).
Fig. 2
Fig. 2. Multi-physical functions of DTMS.
a Fluorescein 5-isothiocyanate (FITC) solution perfusion via PRIS and DTMS, OD = 200 μm, ID = 80 μm. b The micro pump connected DTMS on the rat. c DTMS and Bluetooth module sensing the electrophysiological waveform of intestinal peristalsis and detecting paralysis. d DTMS and Bluetooth module sensing in the skeletal muscle sensing the electromyography (EMG) of normal muscle and detecting soft paralysis. e DTMS and Bluetooth module in the myocardium for electrocardiogram (ECG) signal sensing. f DTMS in the rat abdominal aorta to monitor electrophysiological signals of vascular pulsation and detect vascular occlusion. g Body surface electromyography signals received by the Bluetooth module in different states. h Potential myocardial laparoscopic surgery using DTMS. il DTMS as a biomechanical sensor in joint movement figure curing i, walking j, running k, the vocal cords vibration l. m NIR photothermal experiment of DTMS and PRIS, n Heating curve of DTMS’s photothermal experiment.
Fig. 3
Fig. 3. DTMS monitoring and intervening myocardial infarction (MI).
a Scheme illustration: Normal group: normal rats; MI group: no intervention after MI; SNAP group: single SNAP treatment after MI; DTMS group: DTMS treated MI; S-DTMS group: SNAP and DTMS treated MI b Surface ECG signals of rats in each group measured by electrophysiology workstation after 1 month. c, d ECG signals of rats in each group remotely measured by DTMS and Bluetooth module after 1 month. e Micro-CT imaging of DTMS which passed through the chest wall and myocardial tissue, finally exited the body. (i) Soft tissue image prior to iohexol perfusion. (ii) High-density images prior to iohexol perfusion. (iii) Soft tissue image after iohexol perfusion. (iv) High-density images after iohexol perfusion. f Fluorescence imaging of BSA-DIR via DTMS by micro-pump on demand for two times (100 μL/min). g Quantification of average radiation efficiency micro-pumped DTMS perfusion. N = 4 biologically independent replicates. All values are presented as mean ± SD.
Fig. 4
Fig. 4. DTMS improving positively remodeling rat ventricle after MI.
a 2D and M-mode echocardiography on day 28. b Survival rate of each group in 1 month. ce Cardiac function of each group. Quantitative analysis of Left Ventricular Diastolic Dysfunction (LVDd) c, Left Ventricular Systolic Dimension (LVDs) d, and Left Heart Ejection Fraction (LVEF) e evaluated by echocardiography on days 0, 7, 14, 28. N = 5 biologically independent replicates. Two-way ANOVA with multiple comparison tests. All values are presented as mean ± SD. ####P < 0.0001 ###P < 0.001, ##P < 0.01 and #P < 0.05, S-DTMS compared with MI group. ****P < 0.0001 and ***P < 0.001, **P < 0.01 and *P < 0.05, S-DTMS compared with DTMS group. ++++P < 0.0001 and +++P < 0.001, ++P < 0.01 and +P < 0.05, S-DTMS compared with Normal group. f (i) Gross images of the heart. (ii) Section Masson staining, (iii) Sliced H&E staining. (iv) a-SMA staining. g Positron emission computed tomography (PET-CT) images in cardiac long-axis and short axis on day 28. N = 3 biologically independent replicates. h Standardized uptake value (SUV) of cardiomyocytes. One-way ANOVA with multiple comparison tests. All values are presented as mean ± SD. N = 3 biologically independent replicates. i, j Quantitative analysis of left ventricular wall thickness i and myocardial fibrosis area j of rats after 1 month. i, j One-way ANOVA with multiple comparison tests. All values are presented as mean ± SD. N = 8 biologically independent replicates.
Fig. 5
Fig. 5. DTMS promoting angiogenesis and improving the blood supply of MI area.
a Top differentially expressed gene heatmap of rats’ heart after 1 week with different treatments. (red, up-regulated; blue, down-regulated; N = 3 biologically independent replicates). b Transcriptome characteristics of infarcted tissue (i, iii): KEGG pathway enrichment analyze of different groups. (i) MI group vs S-DTMS group;(iii) DTMS group vs S-DTMS group. ii, iv: Top differentially expressed gene volcanic map of different groups. (ii) MI group vs S-DTMS group. (iv) DTMS group vs S-DTMS group.) N = 3 biologically independent replicates. c Macrophage immunofluorescence staining of myocardial tissue of the rat heart after 1-week treatment. The white arrows indicate the positive immunofluorescence staining macrophages. d, e Quantification of the CD86 + d and CD163 + e cells, one-way ANOVA with multiple comparison tests. All values are presented as mean ± SD. N = 8 biologically independent replicates. f, g Quantification of IL-6 f, TNF-a g in the myocardial tissue homogenates after 1 month. One-way ANOVA with multiple comparison tests. All values are presented as mean ± SD. N = 8 biologically independent replicates. h After 1 month, angiography and histological staining of the rat heart. From top to bottom: Overall and local features of the rat hearts’ coronary perfusion. Contrast-enhanced coronary artery micro-CT. α-SMA/CD31 immunofluorescence staining of myocardium after treatment for 1 month. i and j Quantitative analysis of the and CD31+ vessels i, α- SMA+ vessels j, one-way ANOVA with multiple comparison tests. All values are presented as mean ± SD. N = 8 biologically independent replicates.
Fig. 6
Fig. 6. S-DTMS treating porcine myocardial infarction.
a Scheme of the treatment of myocardial infarction in minipigs. b (i) Ligated the Left Anterior descending artery (LAD). (ii) The myocardium was ischemic and S-DTMS was sutured in the ischemic area. Differences in the ECG of pigs before and after ligation of LAD. N = 3 biologically independent replicates. c One month later, the ECG of pigs was measured by the Bluetooth ECG connected with the S-DTMS. N = 3 biologically independent replicates. d Representative images of M-mode ultrasound of pigs after one month. eh After 1 month, LVDd e, LVDs f, LVEF g, and LVFS h of pigs were assessed by echocardiography. N = 3 biologically independent replicates. one-way ANOVA with multiple comparison tests. All values are presented as mean ± SD. i One month later, the myocardial tissue’s immunofluorescence staining of SNAP and MI group. From left to right, F-actin+ (red), CD31+ (green), merge. j, k Fibrosis coverage area j and absolute length of cardiac short axis scar. k Two-tailed unpaired Student’s t-test. All values are presented as mean ± SD. N = 3 biologically independent replicates. k After 1 month, immunofluorescence staining of myocardial tissue in SNAP and MI groups. CD31, α-SMA; Collagen I, CollagenIII. Arrows and asterisks, respectively indicate the areas and tissues with positive immunofluorescence staining. N = 3 biologically independent replicates.
Fig. 7
Fig. 7. Evaluation of cardiac function after myocardial infarction in pigs by cMRI.
a CMRI of pigs after 1 month. The mapping image of the pig heart before contrast enhancement, and the mapping image after contrast enhancement at the middle horizontal plane. Short axis myocardial delayed enhancement sequence (LGE). The arrow points to the infarct area. b Quantitative analysis of extracellular volume time-sharing. c Quantitative analysis of EDV/BSA. d Quantitative analysis of LGE positive area. e, f Systolic and diastolic LV wall thickness based on myocardial MRI imaging. g AHA cardiac segment grading criteria. h, i In the heart cycle, the radial h and circumferential strain (i) of all segments of the left ventricle. j, k Radial strain j and circumferential strain k peaks in different segments of the middle segment of the left ventricle. bf One-way ANOVA with multiple comparison tests. All values are presented as mean ± SD. N = 3 biologically independent replicates.

Similar articles

Cited by

References

    1. Metnitz P, et al. Evaluation of the logistic organ dysfunction system for the assessment of organ dysfunction and mortality in critically ill patients. Intensive Care Med. 2001;27:992. doi: 10.1007/s001340100888. - DOI - PubMed
    1. Karamchandani K, Carr ZJ, Bonavia A. Organ dysfunction after surgery in patients treated with individualized or standard blood pressure management. Jama J. Am. Med. Assoc. 2018;319:719. doi: 10.1001/jama.2017.20935. - DOI - PubMed
    1. Lee, D. S. et al. Prospective validation of the emergency heart failure mortality risk grad for acute heart failure: the acute congestive heart failure urgent care evaluation (ACUTE) study. Circulation.139, 1146–1156 (2018). - PubMed
    1. Bergmark BA, Mathenge N, Merlini PA, Lawrence-Wright MB, Giugliano RP. Acute coronary syndromes. Lancet. 2022;399:1347–1358. doi: 10.1016/S0140-6736(21)02391-6. - DOI - PMC - PubMed
    1. Zakharova L, et al. Transplantation of cardiac progenitor cell sheet onto infarcted heart promotes cardiogenesis and improves function. Cardiovasc. Res. 2010;87:40–49. doi: 10.1093/cvr/cvq027. - DOI - PMC - PubMed