. 2024 May;29(5):1427-1439.
doi: 10.1038/s41380-024-02421-y. Epub 2024 Jan 29.

N1-methylation of adenosine (m1A) in ND5 mRNA leads to complex I dysfunction in Alzheimer's disease

Affiliations

N1-methylation of adenosine (m1A) in ND5 mRNA leads to complex I dysfunction in Alzheimer's disease

Marko Jörg et al. Mol Psychiatry. 2024 May.

Abstract

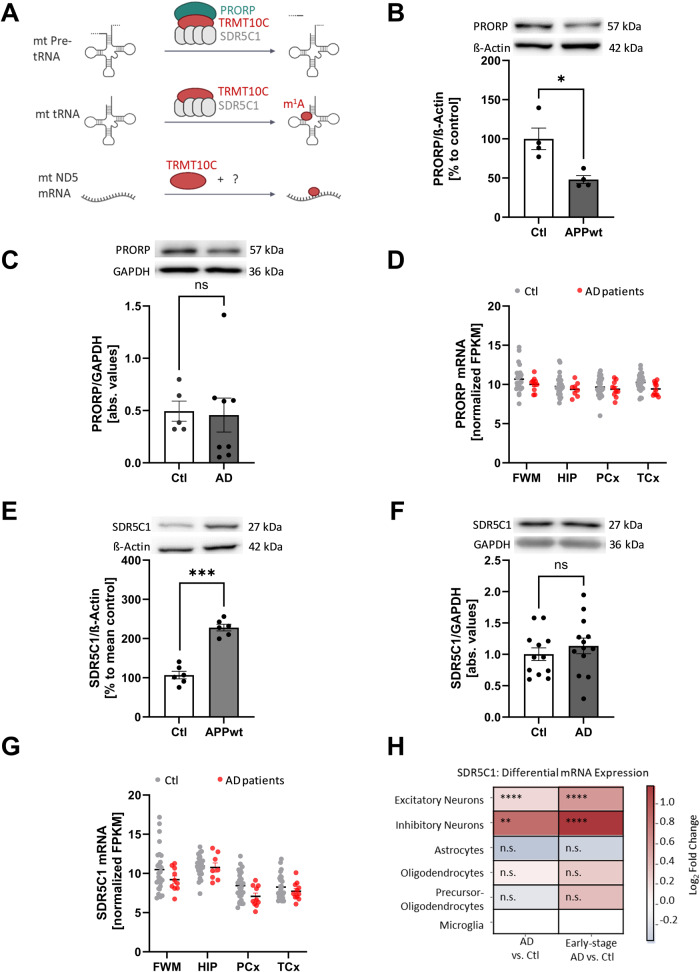
One mechanism of particular interest to regulate mRNA fate post-transcriptionally is mRNA modification. Especially the extent of m1A mRNA methylation is highly discussed due to methodological differences. However, one single m1A site in mitochondrial ND5 mRNA was unanimously reported by different groups. ND5 is a subunit of complex I of the respiratory chain. It is considered essential for the coupling of oxidation and proton transport. Here we demonstrate that this m1A site might be involved in the pathophysiology of Alzheimer's disease (AD). One of the pathological hallmarks of this neurodegenerative disease is mitochondrial dysfunction, mainly induced by Amyloid β (Aβ). Aβ mainly disturbs functions of complex I and IV of the respiratory chain. However, the molecular mechanism of complex I dysfunction is still not fully understood. We found enhanced m1A methylation of ND5 mRNA in an AD cell model as well as in AD patients. Formation of this m1A methylation is catalyzed by increased TRMT10C protein levels, leading to translation repression of ND5. As a consequence, here demonstrated for the first time, TRMT10C induced m1A methylation of ND5 mRNA leads to mitochondrial dysfunction. Our findings suggest that this newly identified mechanism might be involved in Aβ-induced mitochondrial dysfunction.


Conflict of interest statement

The authors declare no competing interests.

Figures

Fig. 1
Fig. 1. TRMT10C protein and mRNA levels are increased in AD cell and animal models and cortex samples of AD patients.
A Illustration of hypothesis and ND5 protein synthesis in mitochondria. m1A was found at position 1374 of the mitochondrial encoded ND5 mRNA transcript. m1A blocks Watson-Crick base pairing and leads to ribosome stalling, consequently the corresponding protein is translated inefficiently. It is assumed that decreased ND5 protein levels lead to complex I impairment. TRMT10C is the writer enzyme of this m1A site. B Western Blot analysis shows a highly significant overexpression of TRMT10C in HEK APPwt cells compared to control cells. Mean ± SEM, n = 8, unpaired t-test. C Western Blot analysis of human frontal cortex samples (gyrus frontalis superior 3 + 4) from AD patients and aged-matched controls, Mean ± SEM, n = 12 Ctl, n = 13 AD, unpaired t-test. D Comparison of TRMT10C mRNA expression in different brain regions of AD patients and healthy controls using the AgDemTBI database. TRMT10C mRNA is increased in all four investigated brain regions. WMPCx = White matter of Parietal Cortex, HIP = Hippocampus, PCx = Parietal Cortex, TCx = Temporal Cortex, FPKM = fragments per kilobase of exon model per million reads. Mean ± SEM, 29 controls (females 14, males 15) and 11 AD patients (females 2, male 8) were included into the analysis, unpaired multiple t-tests (age: 77–100+). E TRMT10C mRNA levels are significantly elevated in scRNA-Seq data from excitatory and inhibitory neurons, but unchanged in other brain cell types. This effect is particularly pronounced in Early-stage AD. 48 individuals (24 Ctl + 24 AD), 80 660 single-nucleus transcriptomes. F Western blot of HEK-293 cells treated with 100 nM oligomeric Aβ1–42 for 24 h showed significantly increased TRMT10C levels compared with corresponding control cells. H2O2 treatment (250 µM), 24 h tended to increase TRMT10C protein levels. Mean ± SEM, n = 5, 6, unpaired t-test. G Western Blot analysis reveals significantly decreased TRMT10C protein levels in 1 mM Vitamin C (24 h) treated HEK APPwt cells in comparison to non-treated cells (HEK APPwt). Mean ± SEM, n = 6, unpaired t-test. AG *p < 0.05, **p < 0.01, ***p < 0.001.
Fig. 2
Fig. 2. Western Blot analysis and evaluation of human databases reveal different behavior of mitochondrial RNase P subunits SDR5C1 and PRORP.
A Schematic overview about the three different functions of TRMT10C. First, a tripartite complex, constituted of PRORP, TRMT10C and SDR5C1 cleaves mitochondrial tRNAs out of the polycistronic transcript. Second, TRMT10C methylates mitochondrial tRNAs in combination with an SDR5C1 tetramer. Third, TRMT10C methylates ND5 mRNA at position 1374. B Western Blot analysis indicates significantly reduced PRORP levels in HEK APPwt cells, n = 4, Mean ± SEM, unpaired t-test. C Western Blot analysis of human frontal cortex samples from AD patients and aged-matched controls shows no significant changes in PRORP protein levels, Mean ± SEM, n = 12 Ctl, n = 13 AD, unpaired t-test. D Comparison of PRORP mRNA expression in different brain regions of AD patients using the “Aging, Dementia & TBI Study” database. No significant changes were detected in all four brain regions. Mean ± SEM, n = 13–15 Ctl n = 5–8 AD, unpaired multiple t-tests (age: 77–100+, sex: male), WMPCx= White matter of Parietal Cortex, HIP = Hippocampus, PCx = Parietal Cortex, TCx = Temporal Cortex, FPKM = fragments per kilobase of exon model per million reads. E Western Blot of HEK APPwt cells shows significantly elevated SDR5C1 levels in comparison to Ctl. Mean ± SEM, n = 6, unpaired t-test. F In Western Blot analysis of human frontal cortex samples from AD patients and aged-matched controls no alterations in SDR5C1 protein levels can be found, Mean ± SEM, n = 12 Ctl, n = 13 AD, unpaired t-test. G Comparison of SDR5C1 mRNA expression in four different brain regions of AD patients using the AgDemTBI database. SDR5C1 mRNA is no significantly altered in AD patients. Mean ± SEM, 29 controls (females 14, males 15) and 11 AD patients (females 2, male 8) were included into the analysis, unpaired multiple t-tests (age: 77–100+), WMPCx= White matter of Parietal Cortex, HIP= Hippocampus, PCx= Parietal Cortex, TCx= Temporal Cortex, FPKM= fragments per kilobase of exon model per million reads. H SDR5C1 mRNA levels are significantly elevated in scRNA-Seq data from excitatory and inhibitory neurons, but unchanged in other brain cell types. This effect is particularly pronounced in Early-stage AD. 48 individuals (24 Ctl + 24 AD), 80 660 single-nucleus transcriptomes. AH *p < 0.05, **p < 0.01, ***p < 0.001.
Fig. 3
Fig. 3. m1A levels at position 1374 in ND5 mRNA are increased in AD model cells and in primary visual cortex samples from human patients.
A m1A-induced misincorporation and jumps are significantly elevated in APPwt cells in comparison to Ctl. Shown are single replicate values, misincorporation split into individual bases and jump rate. Mean ± SEM, n = 7–8, unpaired t-test. B RNA isolated from mitochondrial extracts confirms enhanced m1A methylation in HEK APPwt cells in comparison to Ctl. Mean ± SEM, n = 2. C m1A-induced misincorporation and jumps are significantly increased in human AD postmortem brain samples compared to non-demented controls. Mean ± SEM, n = 5–12, unpaired t-test. AC For every data set sequencing reads at position 1374 of mt ND5 mRNA are shown as misincorporation including different biological replicates, misincorporation split into individual bases and jumprate. *p < 0.05, **p < 0.01.
Fig. 4
Fig. 4. ND5 protein levels are decreased in AD cell and animal models and in AD patients’ brains.
A Western Blot analysis reveals reduced ND5 protein levels in HEK APPwt cells. Mean ± SEM, n = 8, unpaired t-test. B ND5 protein levels are not altered between frontal cortex samples from AD patients and aged-matched controls, Mean ± SEM, n = 12 Ctl, n = 13 AD, unpaired t-test. C Comparison between AD patients at Braak stage 5 + 6 and Ctl at Braak stage 0–3 reveals significantly reduced ND5 levels Mean ± SEM. D ND5 mRNA expression in HEK APPwt cells not different to HEK Ctl cells. Determined using qPCR, Mean ± SEM, n = 10, unpaired t-test. E ND5 mRNA levels increased in frontal cortex samples from AD patients and aged-matched controls using RT-qPCR, Mean ± SEM, n = 12 Ctl, n = 13 AD, unpaired t-test. F Comparison between AD patients at Braak stage 5 + 6 and Ctl at Braak stage 0–3 still shows increased ND5 mRNA levels Mean ± SEM. G No changes in ND5 mRNA expression in parietal cortex samples using AgDemTBI RNAseq data from human AD patients in comparison to healthy controls. Mean ± SEM, 29 controls (females 14, males 15) and 11 AD patients (females 2, male 8) were included into the analysis, unpaired multiple t-test (age: 77–100+, sex: male), WMPCx = White matter of Parietal Cortex, HIP = Hippocampus, PCx = Parietal Cortex, TCx = Temporal Cortex, FPKM = fragments per kilobase of exon model per million reads. H Protein levels of mt-ND5 in HEK-293 cells treated with 100 nM oligomeric Aβ1–42 and 250 µM H2O2 for 24 h were significantly decreased compared to the untreated control. Mean ± SEM, n = 6, unpaired t-test. I Protein levels of mt-ND5 in Vitamin C treated HEK APPwt cells were significantly increased compared to non-treated HEK APPwt cells. Mean ± SEM, n = 6. A–F *p < 0.05, **p < 0.01, ***p < 0.001.
Fig. 5
Fig. 5. Tetracycline-induced overexpression of TRMT10C and its effects on m1A, ND5, SDR5C1, PRORP protein levels and mitochondrial function.
A Western Blot of pTRMT10C cells and control cell line after incubation with different tetracycline concentrations. n = 1. B Misincorporation and jump rate at position 1374 of mitochondrial ND5 mRNA after RT-PCR with SSIV, Mean + SEM, n = 4, unpaired t-test. C Western Blot analysis reveals significantly reduced ND5 protein levels in pTRMT10C cells after addition of tetracycline in comparison to Ctl. Mean ± SEM, n = 3 Ctl, n = 5 pTRMT10C, unpaired t-test. D SDR5C1 expression is unchanged in Western Blots of pTRMT10C cells and Ctl after addition of tetracycline. Mean + SEM, n = 4. E Western Blot analysis shows no changes of PRORP expression in pTRMT10c cells and Ctl after addition of tetracycline. Mean + SEM, n = 4. A–E unpaired t-test *p < 0.05, **p < 0.01. F Representative oxygen consumption curve of Ctl and pTRMT10C cells, measured in the XF96 Extracellular Flux analyzer. Violine plots for Basal Respiration are shown from three individual experiments. n = 3, nested analysis. G Oxygen consumption after addition of different chemical compounds in the roboros oxygen electrode. Oligo. = Oligomycin, ETS = Electron Transport System, Rot. = Rotenone, Anti. = Antimycin, Mean ± SD, n = 8. H TMRM staining reveals that mitochondrial membrane potential is significantly decreased in pTRMT10C cells after addition of 1 µg/mL tetracycline in comparison to Ctl, Mean ± SEM, data points represent values of every individual well from n = 4 different days. Unpaired t-test.
Fig. 6
Fig. 6. siRNA induced knockdown of TRMT10C and its effects on m1A mismatch and jump rate and mt-ND5 protein levels.
A Western Blot of siRNA induced TRMT10C KD cells. Mean ± SEM, n = 8, unpaired t-test. B, C Misincorporation rate at position 1374 of mitochondrial ND5 mRNA after RT-PCR with SS-IV after KD siRNA induced KD of TRMT10C. For every data set sequencing reads at position 1374 of mt ND5 mRNA are shown as misincorporation including different biological replicates. Mean ± SEM, n = 6, 7, unpaired t-test. D Western Blot analysis reveals significantly increased ND5 protein levels in siRNA induced TRMT10C KD cells in comparison to non-KD cells. Mean ± SEM, n = 7- 8, E Measurement of human Aβ1-40 levels in HEK APPwt cells compared to control cells. Mean ± SEM, n = 3-4. F Analysis of human Aβ1-40 levels in siRNA induced TRMT10C KD cells in comparison to non-KD cells. Mean ± SEM, n = 4.  unpaired t-test. A–D *p < 0.05, **p < 0.01, ***p < 0.001.

Similar articles

Cited by

References

    1. Motorin Y, Helm M. RNA nucleotide methylation: 2021 update. Wiley Interdiscip Rev RNA. 2022;13:1–37. doi: 10.1002/wrna.1691. - DOI - PubMed
    1. Freund I, Eigenbrod T, Helm M, Dalpke AH. RNA modifications modulate activation of innate toll-like receptors. Genes. 2019;10:92. doi: 10.3390/genes10020092. - DOI - PMC - PubMed
    1. Ruggieri A, Helm M, Chatel-Chaix L. An epigenetic ‘extreme makeover’: the methylation of flaviviral RNA (and beyond) RNA Biol. 2021;18:696–708. doi: 10.1080/15476286.2020.1868150. - DOI - PMC - PubMed
    1. Helm M, Alfonzo JD. Post-transcriptional RNA modifications: playing metabolic games in a cell’s chemical legoland. Chem Biol. 2014;21:174–85. doi: 10.1016/j.chembiol.2013.10.015. - DOI - PMC - PubMed
    1. Chen AY, Owens MC, Liu KF. Coordination of RNA modifications in the brain and beyond. Mol Psychiatry. 2023;28:2737–49. doi: 10.1038/s41380-023-02083-2. - DOI - PMC - PubMed