. 2024 Mar;21(3):292-308.
doi: 10.1038/s41423-023-01118-6. Epub 2024 Jan 29.

Id2 epigenetically controls CD8+ T-cell exhaustion by disrupting the assembly of the Tcf3-LSD1 complex

Affiliations

Id2 epigenetically controls CD8+ T-cell exhaustion by disrupting the assembly of the Tcf3-LSD1 complex

Yiming Li et al. Cell Mol Immunol. 2024 Mar.

Abstract

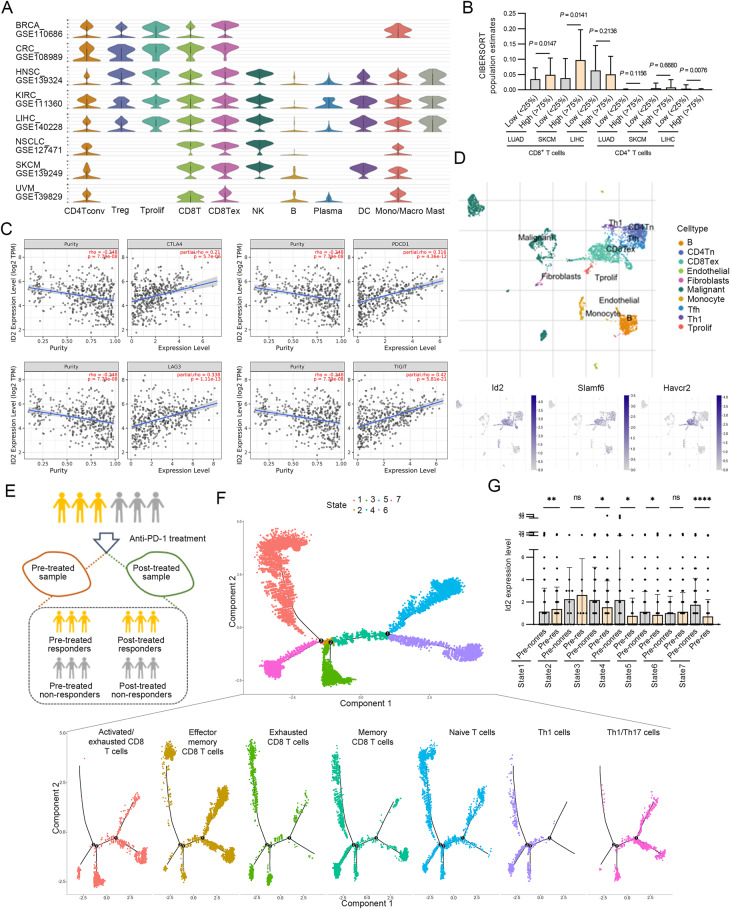
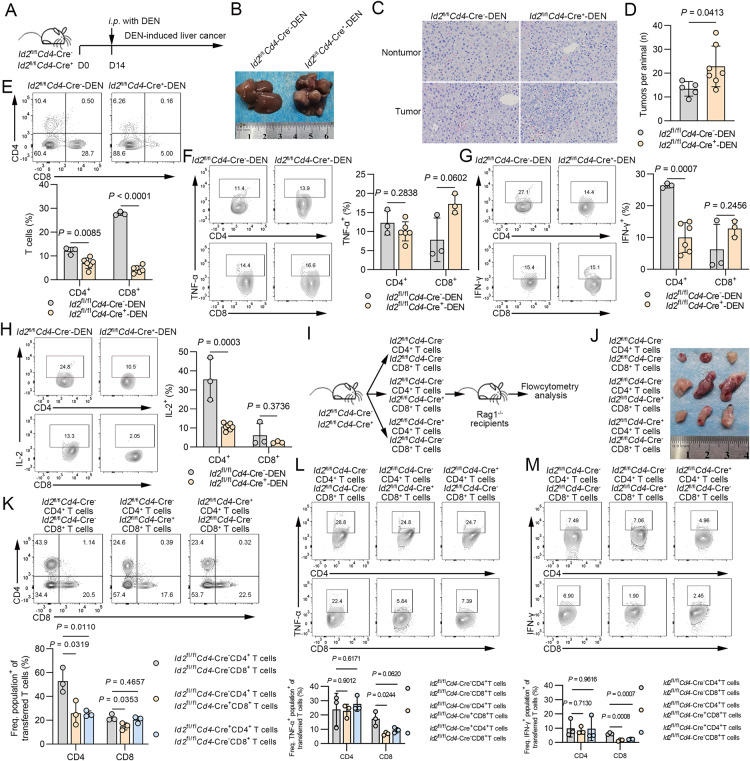
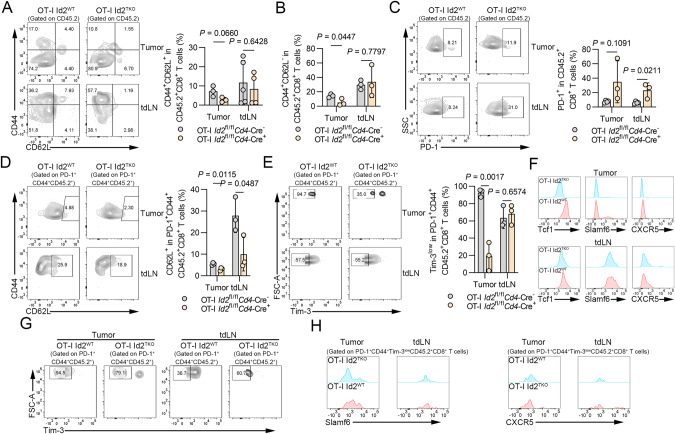
CD8+ T-cell exhaustion is a state of dysfunction that promotes tumor progression and is marked by the generation of Slamf6+ progenitor exhausted (Texprog) and Tim-3+ terminally exhausted (Texterm) subpopulations. Inhibitor of DNA binding protein 2 (Id2) has been shown to play important roles in T-cell development and CD8+ T-cell immunity. However, the role of Id2 in CD8+ T-cell exhaustion is unclear. Here, we found that Id2 transcriptionally and epigenetically regulates the generation of Texprog cells and their conversion to Texterm cells. Genetic deletion of Id2 dampens CD8+ T-cell-mediated immune responses and the maintenance of stem-like CD8+ T-cell subpopulations, suppresses PD-1 blockade and increases tumor susceptibility. Mechanistically, through its HLH domain, Id2 binds and disrupts the assembly of the Tcf3-Tal1 transcriptional regulatory complex, and thus modulates chromatin accessibility at the Slamf6 promoter by preventing the interaction of Tcf3 with the histone lysine demethylase LSD1. Therefore, Id2 increases the abundance of the permissive H3K4me2 mark on the Tcf3-occupied E-boxes in the Slamf6 promoter, modulates chromatin accessibility at the Slamf6 promoter and epigenetically regulates the generation of Slamf6+ Texprog cells. An LSD1 inhibitor GSK2879552 can rescue the Id2 knockout phenotype in tumor-bearing mice. Inhibition of LSD1 increases the abundance of Slamf6+Tim-3- Texprog cells in tumors and the expression level of Tcf1 in Id2-deleted CD8+ T cells. This study demonstrates that Id2-mediated transcriptional and epigenetic modification drives hierarchical CD8+ T-cell exhaustion, and the mechanistic insights gained may have implications for therapeutic intervention with tumor immune evasion.

Keywords: Epigenetic modification; Id2; Immune evasion; T-cell exhaustion.


Conflict of interest statement

The authors declare no competing interests.

Figures

Fig. 1
Fig. 1
Id2 is selectively upregulated in tumor-infiltrating CD8+ T cells. A Distribution of Id2 expression in different immune cell types across datasets (BRCA_GSE110686, CRC_GSE108989, HNSC_GSE139324, KIRC_GSE111360, LIHC_GSE140228_10X, NSCLC_GSE127471, SKCM_GSE139249, and UVM_GSE139829). CD4Tconv, conventional CD4+ T cells; Treg, regulatory T cells; Tprolif, proliferative T cells; CD8T, CD8+ T cells; CD8Tex, exhausted CD8+ T cells; NK, natural killer cells; B, B cells; plasma, plasma cells; DC dendritic cells, Mono/Macro monocytes or macrophages, Mast mast cells. B Relative abundances of tumor-infiltrating immune cell populations determined by the CIBERSORT tool in LUAD, SKCM and LIHC patients with varying Id2 expression levels based on RNA-seq data in TCGA. LUAD, lung adenocarcinoma, n = 532; SKCM, skin cutaneous melanoma, n = 102; LIHC, liver hepatocellular carcinoma, n = 370. C Correlations of Id2 expression with the expression of inhibitory receptors (Pdcd1, Ctla4, Lag3 and Tigit) in SKCM. The degree of correlation is the purity-adjusted partial Spearman’s rho value. D Id2 expression profiles visualized on a tSNE plot of major immune cell types in the SKCM TME. The GSE72056 dataset contains data from 19 patients (4645 cells). E Schematic of the procedure for single-cell RNA-seq analysis of samples obtained before and after anti-PD-1 therapy in patients with basal cell carcinoma (GSE123813). F Trajectory analysis of T-cell subsets in responders and nonresponders. G Id2 expression levels in seven states in responders and nonresponders. ns, not significant; ****P < 0.0001; **P < 0.01; *P < 0.05
Fig. 2
Fig. 2
Id2 ablation in T cells promotes tumor development by suppressing the immune response. A Tumor growth in Id2fl/flCd4-Cre- mice and Id2fl/flCd4-Cre+ mice injected subcutaneously (s.c.) with 2 × 105 B16-F10 melanoma cells. ***P < 0.001. B Survival curves of Id2fl/flCd4-Cre- mice and Id2fl/flCd4-Cre+ mice injected subcutaneously (s.c.) with 2 × 105 B16-F10 melanoma cells. **P < 0.01. C Flow cytometric analysis of the frequencies of CD4+ T cells and CD8+ T cells in the tumors of Id2fl/flCd4-Cre- mice and Id2fl/flCd4-Cre+ mice injected s.c. with B16-F10 melanoma cells (Day 14). The data are presented as representative plots and summary graphs. D Flow cytometric analysis of the frequencies of TNF-α-expressing CD4+ T cells and CD8+ T cells in the tumors of Id2fl/flCd4-Cre- mice and Id2fl/flCd4-Cre+ mice injected s.c. with B16-F10 melanoma cells (Day 14). The data are presented as representative plots and summary graphs. E Flow cytometric analysis of the frequencies of IFN-γ-expressing CD4+ T cells and CD8+ T cells in the tumors of Id2fl/flCd4-Cre- mice and Id2fl/flCd4-Cre+ mice injected s.c. with B16-F10 melanoma cells (Day 14). The data are presented as representative plots and summary graphs. F Summary graphs of IL-2-expressing CD4+ T cells and CD8+ T cells in the tumors of Id2fl/flCd4-Cre- mice and Id2fl/flCd4-Cre+ mice injected s.c. with B16-F10 melanoma cells (Day 14). G Tumor growth in Id2fl/flCd4-Cre- mice and Id2fl/flCd4-Cre+ mice injected subcutaneously (s.c.) with 2 × 106 LLC lung cancer cells. ***P < 0.001; ****P < 0.0001. H Survival curves of Id2fl/flCd4-Cre- mice and Id2fl/flCd4-Cre+ mice injected subcutaneously (s.c.) with 2 × 106 LLC lung cancer cells. *P < 0.05. I Flow cytometric analysis of the frequencies of CD4+ T cells and CD8+ T cells in the tumors of Id2fl/flCd4-Cre- mice and Id2fl/flCd4-Cre+ mice injected s.c. with LLC lung cancer cells (Day 14). The data are presented as representative plots and summary graphs. J Flow cytometric analysis of the frequencies of TNF-α-expressing CD4+ T cells and CD8+ T cells in the tumors of Id2fl/flCd4-Cre- mice and Id2fl/flCd4-Cre+ mice injected s.c. with LLC lung cancer cells (Day 14). The data are presented as representative plots and summary graphs. K Flow cytometric analysis of the frequencies of IFN-γ-expressing CD4+ T cells and CD8+ T cells in the tumors of Id2fl/flCd4-Cre- mice and Id2fl/flCd4-Cre+ mice injected s.c. with LLC lung cancer cells (Day 14). The data are presented as representative plots and summary graphs. L Summary graphs of IL-2-expressing CD4+ T cells and CD8+ T cells in the tumors of Id2fl/flCd4-Cre- mice and Id2fl/flCd4-Cre+ mice injected s.c. with LLC lung cancer cells (Day 14)
Fig. 3
Fig. 3
Id2 ablation restrains T-cell-mediated immune surveillance in both DEN-induced and murine models of hepatoma. A Id2fl/flCd4-Cre mice and Id2fl/flCd4-Cre+ mice were administered diethylnitrosamine (DEN) on postnatal day 14 and sacrificed after 40 weeks. B, C Macroscopic and microscopic evaluations of tumor formation were conducted 40 weeks after DEN injection. D The tumor numbers were assessed in every liver lobe. E Flow cytometric analysis of the frequencies of hepatic CD4+ T cells and CD8+ T cells in DEN-induced tumors of Id2fl/flCd4-Cre mice and Id2fl/flCd4-Cre+ mice. The data are presented as representative plots and summary graphs. F Flow cytometric analysis of the frequencies of hepatic TNF-α-expressing CD4+ T cells and CD8+ T cells in DEN-induced tumors of Id2fl/flCd4-Cre mice and Id2fl/flCd4-Cre+ mice. All cells derived from tumors were stimulated with phorbol 12-myristate 13-acetate (PMA) and ionomycin for 6 h and then subjected to intracellular staining. The data are presented as representative plots and summary graphs. G Flow cytometric analysis of the frequencies of hepatic IFN-γ-expressing CD4+ T cells and CD8+ T cells in DEN-induced tumors of Id2fl/flCd4-Cre mice and Id2fl/flCd4-Cre+ mice. All cells derived from tumors were stimulated with phorbol 12-myristate 13-acetate (PMA) and ionomycin for 6 h and then subjected to intracellular staining. The data are presented as representative plots and summary graphs. H Flow cytometric analysis of the frequencies of hepatic IL-2-expressing CD4+ T cells and CD8+ T cells in DEN-induced tumors of Id2fl/flCd4-Cre mice and Id2fl/flCd4-Cre+ mice. All cells derived from tumors were stimulated with phorbol 12-myristate 13-acetate (PMA) and ionomycin for 6 h and then subjected to intracellular staining. The data are presented as representative plots and summary graphs. I Schematic of the analysis of Rag1−/− mice injected s.c. with 2 × 106 Hepa1-6 hepatoma cells after adoptive transfer of 2 × 106 Id2fl/flCd4-Cre or Id2fl/flCd4-Cre+ CD8+ T cells along with 2 × 106 Id2fl/flCd4-Cre CD4+ T cells. J Gross assessment of tumors in the Rag1−/− model. K Flow cytometric analysis of the frequencies of adoptive CD4+ T cells and CD8+ T cells in the tumors of Rag1−/− mice injected s.c. with Hepa1-6 hepatoma cells (Day 14). The data are presented as representative plots and summary graphs. L Flow cytometric analysis of the frequencies of adoptive TNF-α-expressing CD4+ T cells and CD8+ T cells in the tumors of Rag1−/− mice injected s.c. with Hepa1-6 hepatoma cells (Day 14). All cells derived from Hepa1-6 tumors were stimulated with phorbol 12-myristate 13-acetate (PMA) and ionomycin for 6 h and then subjected to intracellular staining. The data are presented as representative plots and summary graphs. M Flow cytometric analysis of the frequencies of adoptive IFN-γ-expressing CD4+ T cells and CD8+ T cells in the tumors of Rag1−/− mice injected s.c. with Hepa1-6 hepatoma cells (Day 14). All cells derived from Hepa1-6 tumors were stimulated with phorbol 12-myristate 13-acetate (PMA) and ionomycin for 6 h and then subjected to intracellular staining. The data are presented as representative plots and summary graphs
Fig. 4
Fig. 4
Id2 ablation inhibits the expansion and cytokine production of therapeutic CD8+ T cells. A Schematic of the analysis of tumor-bearing mice after OT-I CD8+ T-cell transfer. Tumor and tumor-draining lymph nodes (tdLNs) were analyzed 11 to 14 days after T-cell therapy. B Flow cytometric analysis of the frequencies of adoptive CD8+ T cells in Id2fl/flCd4-Cre- mice and Id2fl/flCd4-Cre+ mice in B16-OVA tumors and tdLNs. The data are presented as representative plots and summary graphs. C Representative flow cytometric plots of the frequencies of adoptive Ki-67-expressing CD8+ T cells of Id2fl/flCd4-Cre- mice and Id2fl/flCd4-Cre+ mice in B16-OVA tumors and tdLNs. D Flow cytometric analysis of the frequencies of adoptive TNF-α-expressing CD8+ T cells in Id2fl/flCd4-Cre- mice and Id2fl/flCd4-Cre+ mice in B16-OVA tumors and tdLNs. The data are presented as representative plots and summary graphs. E Flow cytometric analysis of the frequencies of adoptive IFN-γ-expressing CD8+ T cells in Id2fl/flCd4-Cre- mice and Id2fl/flCd4-Cre+ mice in B16-OVA tumors and tdLNs. The data are presented as representative plots and summary graphs. F Flow cytometric analysis of the frequencies of adoptive TNF-α+IFN-γ+ CD8+ T cells in Id2fl/flCd4-Cre- mice and Id2fl/flCd4-Cre+ mice in B16-OVA tumors and tdLNs. The data are presented as representative plots and summary graphs. G Flow cytometric analysis of the frequencies of adoptive granzyme B-expressing CD8+ T cells in Id2fl/flCd4-Cre- mice and Id2fl/flCd4-Cre+ mice in B16-OVA tumors and tdLNs. The data are presented as representative plots and summary graphs
Fig. 5
Fig. 5
Id2 ablation attenuates the maintenance of stem cell-like CD8+ T cells after T-cell therapy. A, B Flow cytometric analysis of the frequencies of adoptive CD44+CD62L+ and CD44+CD62L- CD8+ T cells in B16-OVA tumors and tdLNs of Id2fl/flCd4-Cre- mice and Id2fl/flCd4-Cre+ mice. The data are presented as representative plots and summary graphs. C Flow cytometric analysis of the frequencies of adoptive PD-1-expressing CD8+ T cells in B16-OVA tumors and tdLNs of Id2fl/flCd4-Cre- mice and Id2fl/flCd4-Cre+ mice. The data are presented as representative plots and summary graphs. D Flow cytometric analysis of the frequencies of adoptive CD62L-expressing CD8+ T cells gated on PD-1+CD44+CD45.2+ cells in B16-OVA tumors and tdLNs of Id2fl/flCd4-Cre- mice and Id2fl/flCd4-Cre+ mice. The data are presented as representative plots and summary graphs. E Flow cytometric analysis of the frequencies of adoptive Tim-3low CD8+ T cells gated on PD-1+CD44+CD45.2+ cells in B16-OVA tumors and tdLNs of Id2fl/flCd4-Cre- mice and Id2fl/flCd4-Cre+ mice. The data are presented as representative plots and summary graphs. F Representative histograms of Tcf1, Slamf6 and CXCR5 expression in adoptive CD8+ T cells in B16-OVA tumors and tdLNs from Id2fl/flCd4-Cre- mice and Id2fl/flCd4-Cre+ mice. G Representative flow cytometric plots of adoptive Tim-3low CD8+ T cells gated on PD-1+CD44+CD45.2+ cells in B16-OVA tumors and tdLNs of Id2fl/flCd4-Cre- mice and Id2fl/flCd4-Cre+ mice. H Representative histograms of Slamf6 or CXCR5 expression in adoptive CD8+ T cells gated on PD-1+CD44+Tim-3lowCD45.2+ cells in B16-OVA tumors and tdLNs from Id2fl/flCd4-Cre- mice and Id2fl/flCd4-Cre+ mice
Fig. 6
Fig. 6
Id2 regulates the generation of Slamf6+ progenitor cells and their conversion to terminally exhausted CD8+ T cells in tumors. A Scatter plot comparing the global gene expression profiles of Id2fl/flCd4-Cre- (WT) and Id2fl/flCd4-Cre+ (TKO) CD8+ T cells stimulated with anti-CD3 and anti-CD28 antibodies for 24 h. Transcripts with a log10 (fold change) of >0.5 and adjusted p value of <0.05 in TKO CD8+ T cells are shown in red (upregulated expression, 227 genes) or blue (downregulated expression, 113 genes). B Top 20 enriched GO terms in the comparison of Id2fl/flCd4-Cre- CD8+ T cells and Id2fl/flCd4-Cre+ CD8+ T cells. C A heatmap of upregulated and downregulated immune checkpoint genes, including Pdcd1, Ctla4, Lag3, Tigit, Cd244, Cd160 and Klrc1, in Id2fl/flCd4-Cre+ CD8+ T cells compared with Id2fl/flCd4-Cre- CD8+ T cells. Each column shows data for one sample. A heatmap of upregulated and downregulated effector molecule-encoding genes, including Ifng, Gzmb, Prf1, Tnfsf10, Fasl and Tnf, in Id2fl/flCd4-Cre+ CD8+ T cells compared to Id2fl/flCd4-Cre- CD8+ T cells. Each column shows data for one sample. D Schematic of the procedure for cotransfer of CD45.1.2 OT-I Id2WT CD8+ T cells and CD45.2 OT-I Id2TKO CD8+ T cells. E Flow cytometric analysis of the frequencies of cotransferred CD8+ T cells from CD45.1.2 OT-I Id2WT mice and CD45.2 OT-I Id2TKO mice in B16-OVA tumors and tdLNs. The data are presented as representative plots and summary graphs. F Representative flow cytometric plots of the frequencies of cotransferred Slamf6+Tim-3- and Slamf6-Tim-3+ CD8+ T cells from CD45.1.2 OT-I Id2WT mice and CD45.2 OT-I Id2TKO mice in B16-OVA tumor and tdLNs. The data are presented as representative plots and summary graphs. G Schematic of the procedures for the in vitro conversion and CFSE proliferation assays using cotransferred CD45.1.2 OT-I Id2WT CD8+ T cells and CD45.2 OT-I Id2TKO CD8+ T cells isolated 15-18 days after B16-OVA tumor cell injection. H Summary graphs of the frequencies of cotransferred Slamf6+Tim-3-, Slamf6+Tim-3+, and Slamf6-Tim-3+ CD8+ T cells from CD45.1.2 OT-I Id2WT mice and CD45.2 OT-I Id2TKO mice in B16-OVA tumors on Day 5. The data are presented with reference to Slamf6+ cells. I Quantification of cell divisions following in vitro stimulation (anti-CD3/CD28 antibodies with IL-2) of CFSE-labeled Slamf6+ CD45.1.2 OT-I Id2WT CD8+ T cells and CD45.2 OT-I Id2TKO CD8+ T cells isolated on Day 5. J Schematic of the procedure for anti-PD-1 treatment of Id2fl/flCd4-Cre- and Id2fl/flCd4-Cre+ mice (intraperitoneal injection with an anti-PD-1 antibody or control antibody on Days 5, 8 and 11). K Tumor growth curves for Id2fl/flCd4-Cre- mice and Id2fl/flCd4-Cre+ mice injected subcutaneously with 2 × 105 B16-F10 melanoma cells or 2 × 106 LLC lung cancer cells prior to intraperitoneal injection of the anti-PD-1 antibody on Days 5, 8 and 11. IgG, control antibody. Survival curves of Id2fl/flCd4-Cre- mice and Id2fl/flCd4-Cre+ mice injected subcutaneously with 2 × 105 B16-F10 melanoma cells or 2 × 106 LLC lung cancer cells prior to intraperitoneal injection of the anti-PD-1 antibody on Days 5, 8 and 11. IgG, control antibody
Fig. 7
Fig. 7
Id2 interacts with Tcf3 and disrupts the formation of the Tcf3-Tal1 complex. A Slamf6 promoter activity was evaluated by a dual luciferase reporter assay in HEK-293 cells. A plasmid containing the Slam6 promoter fused to the luciferase promoter gene was cotransfected with the Tcf3-GV219, Id2-GV219, or Id2-ΔHLH-GV219 expression plasmid or the empty GV219 vector alone and in combination. After 20 h, the cells were left untreated (UT) or treated with PMA plus ionomycin (PI) for 4 h. The transfection efficiency was controlled by cotransfection of a plasmid constitutively expressing Renilla luciferase. The results are presented as the ratio of firefly luciferase activity to Renilla luciferase activity. Asterisks from left to right: Group 1 (UT) vs. Group 2 (UT); Group 1 (PI) vs. Group 2 (PI); Group 2 (UT) vs. Group 5 (UT); Group 2 (PI) vs. Group 5 (PI); Group 5 (UT) vs. Group 6 (UT); Group 5 (PI) vs. Group 6 (PI). ns, not significant; *P < 0.05; ***P < 0.001; ****P < 0.0001. HLH, helix-loop-helix domain. B Structural schematics showing the structure of the Slamf6 gene with the E-boxes (putative Tcf3-Tal1 binding elements). The human genomic sequence is shown as the base sequence on the x-axis. The four red boxes indicate the E-boxes, the blue box indicates the exon (only one exon within +3 kb) and the green triangle indicates the transcription start site (TSS). * indicates nucleotides conserved between Homo sapiens and Macaca mulatta. C Chromatin immunoprecipitation (ChIP) assay of Tcf3 binding to the E-boxes in the Slamf6 promoter in GFP-Id2WT and GFP-Id2ΔHLH Jurkat cells. The purified DNA fragments were analyzed by gel electrophoresis and real-time quantitative PCR. ***P < 0.001; ****P < 0.0001. D The Tcf3 expression plasmid was cotransfected with a series of 5’-deletion mutants of the human Slamf6 promoter or a series of four E-box mutants of the human Slamf6 promoter fused to the luciferase gene into HEK-293 cells. After 20 h, the cells were left untreated (UT) or treated with PMA plus ionomycin (PI) for 4 h. The transfection efficiency was controlled by cotransfection of a plasmid constitutively expressing Renilla luciferase. The results are presented as the ratio of firefly luciferase activity to Renilla luciferase activity. The full-length Slamf6-promoter luciferase construct (−2000/+71) was cloned and inserted into the GV238 vector. Slamf6 promoter subregions (−1703/+71, which contains all four E-boxes; −1062/+71, which contains three E-boxes; −871/+71, which contains two E-boxes; −607/+71, which contains only one E-box; and −596/+71, which contains none of the four E-boxes) were cloned and inserted into the GV238 vector. The four Slamf6 promoter E-boxes were disrupted by introducing mutations into their respective sequences using a mutagenesis kit according to the manufacturer’s instructions. Four mutated Slamf6 promoter sequences were also cloned and inserted into the GV238 vector: mutation of the fourth E-box mutation, 5’-CAACCATCTGAT-3’ → 5’-CAACTGTCGTAT-3’; mutation of the third E-box mutation, 5’-ACAACAGATGCT-3’ → 5’-ACAATGGAGTCT-3’; mutation of the second E-box mutation, 5’-GACACATGCAC-3’ → 5’-GATGCAGTCAC-3’; and mutation of the first E-box, 5’-AGAACACATGGA-3’ → 5’-AGAATGCAGTGA-3’. E Immunoblot analysis of Id2 and Tcf3 protein expression in GFP-Id2WT and GFP-Id2ΔHLH Jurkat cells treated with the anti-CD3 antibody. IB, immunoblot. F, G Confocal microscopy analysis of GFP-Id2 and mCherry-Tcf3 localization in GFP-Id2WT and GFP-Id2ΔHLH Jurkat cells with or without anti-CD3 antibody treatment. H Coimmunoprecipitation (IP) assay of the Id2-Tcf3 interaction in Jurkat cells. I Coimmunoprecipitation (IP) assay of the Id2-Tcf3 interaction in PI-stimulated HEK-293 cells and anti-CD3 antibody-stimulated Jurkat cells. J Coimmunoprecipitation (IP) assay of the Id2-Tcf3 interaction in GFP-Id2WT and GFP-Id2ΔHLH Jurkat cells. K Coimmunoprecipitation (IP) assay of the Id2-Tal1 interaction and Tal1-Tcf3 interaction in Jurkat cells. L Immunoblots showing the binding of Id2 and Tal1 to Tcf3. HEK-293 cells were transfected with a fixed concentration of Flag-Tcf3 and Tal1 and increasing concentrations of Id2
Fig. 8
Fig. 8
Id2ΔHLH allows the Tcf3-Tal1 complex to recruit LSD1 to alter chromatin accessibility during the Texprog-to-Texterm conversion. A LC/MS analysis of Tcf3-associated proteins in Jurkat cells after the Tcf3 pull-down assay. From top to bottom: LSD1, Tal1 and HDAC1. B ATAC-seq analysis of splenic Id2fl/flCd4-Cre- and Id2fl/flCd4-Cre+ CD8+ T cells stimulated with anti-CD3/CD28 antibodies for 24 h. C Sites of Tal1, LSD1, Gata1 and Gata2 occupancy at the chromosomal locus of Slamf6 were obtained from Cistrome DB, a ChIP-seq database. D The LSD1 complex associated with Tcf3 was pulled down from Jurkat cells. E Coimmunoprecipitation (IP) assay of the Tal1-Tcf3 interaction, LSD1-Tcf3 interaction and Tal1-LSD1 interaction in GFP-Id2WT and GFP-Id2ΔHLH Jurkat cells. F Immunoblot analysis of cytosolic and nuclear extracts from GFP-Id2WT and GFP-Id2ΔHLH Jurkat cells treated with or without the anti-CD3 antibody. Markers for the soluble fraction: GAPDH and actin; markers for the chromatin fraction: HDAC1 and HDAC2. G Coimmunoprecipitation (IP) assay of the Tal1-Tcf3 interaction and LSD1-Tcf3 interaction in the chromatin and soluble fractions extracted from GFP-Id2WT and GFP-Id2ΔHLH Jurkat cells with or without anti-CD3 antibody stimulation. H Slamf6 promoter activity was evaluated by a dual luciferase reporter assay in HEK-293 cells. A plasmid containing the Slam6 promoter fused to the luciferase promoter gene was cotransfected with either the Tcf3-GV712, Tal1-GV712, LSD1 (WT)-GV712 or LSD1 (ΔC)-GV712 expression plasmid or the empty GV712 vector alone or in combination. The transfection efficiency was controlled by cotransfection of a plasmid constitutively expressing Renilla luciferase. The results are presented as the ratio of firefly luciferase activity to Renilla luciferase activity. C, C-terminal amine oxidase domain. *P < 0.05. I ChIP assay of Tal1 binding to E-boxes in the Slamf6 promoter in GFP-Id2WT and GFP-Id2ΔHLH Jurkat cells. The purified DNA fragments were analyzed by gel electrophoresis and real-time quantitative PCR. ns, not significant. J H3 lysine 4 (H3K4) and H3 lysine 9 (H3K9) methylation scores of the Slamf6 gene in Jurkat and K562 cells. The data were derived from Cistrome DB. K Immunoblot analysis of histone H3 (lysine 4) dimethylation in GFP-Id2WT and GFP-Id2ΔHLH Jurkat cells stimulated with the anti-CD3 antibody or with PMA plus ionomycin. L ChIP assay of H3K4me2 binding to E-boxes in the Slamf6 promoter in GFP-Id2WT and GFP-Id2ΔHLH Jurkat cells. The purified DNA fragments were analyzed by gel electrophoresis and real-time quantitative PCR. * P < 0.05; ** P < 0.01; *** P < 0.001. M Global H3K4me2 level in antigen-experienced OT-I CD8+ T cells in B16-OVA tumors. WT, Id2fl/flCd4-Cre-; KO, Id2fl/flCd4-Cre+. N Experimental design for daily treatment with the chemical LSD1 inhibitor GSK2879552 to rescue the Id2 deletion phenotype. Assessment of Texprog and Texterm cells among adoptive Id2fl/flCd4-Cre+ OT-I CD8+ T cells in MC38-OVA tumors from mice treated with corn oil or GSK2879552. O Assessment of Tcf1 in adoptive Id2fl/flCd4-Cre+ OT-I CD8+ T cells in MC38-OVA tumors from mice treated with corn oil or GSK2879552

Similar articles

Cited by

References

    1. Wherry EJ. T cell exhaustion. Nat Immunol. 2011;12:492–9. doi: 10.1038/ni.2035. - DOI - PubMed
    1. Zajac AJ, Blattman JN, Murali-Krishna K, Sourdive DJ, Suresh M, Altman JD, et al. Viral immune evasion due to persistence of activated T cells without effector function. J Exp Med. 1998;188:2205–13. doi: 10.1084/jem.188.12.2205. - DOI - PMC - PubMed
    1. Wherry EJ, Kurachi M. Molecular and cellular insights into T cell exhaustion. Nat Rev Immunol. 2015;15:486–99. doi: 10.1038/nri3862. - DOI - PMC - PubMed
    1. Wherry EJ, Ha SJ, Kaech SM, Haining WN, Sarkar S, Kalia V, et al. Molecular signature of CD8+ T cell exhaustion during chronic viral infection. Immunity. 2007;27:670–84. doi: 10.1016/j.immuni.2007.09.006. - DOI - PubMed
    1. Ahmadzadeh M, Johnson LA, Heemskerk B, Wunderlich JR, Dudley ME, White DE, et al. Tumor antigen-specific CD8 T cells infiltrating the tumor express high levels of PD-1 and are functionally impaired. Blood. 2009;114:1537–44. doi: 10.1182/blood-2008-12-195792. - DOI - PMC - PubMed