. 2024 Mar;31(3):309-321.
doi: 10.1038/s41418-024-01257-x. Epub 2024 Jan 29.

Deubiquitinase USP7 stabilizes KDM5B and promotes tumor progression and cisplatin resistance in nasopharyngeal carcinoma through the ZBTB16/TOP2A axis

Affiliations

Deubiquitinase USP7 stabilizes KDM5B and promotes tumor progression and cisplatin resistance in nasopharyngeal carcinoma through the ZBTB16/TOP2A axis

Bin Zhang et al. Cell Death Differ. 2024 Mar.

Abstract

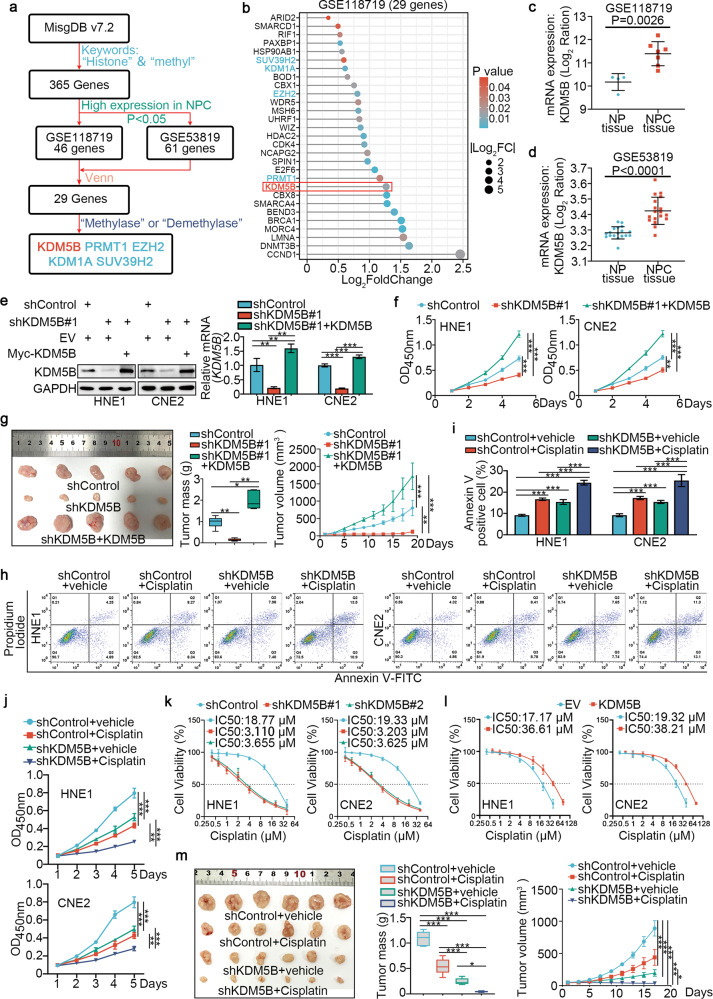
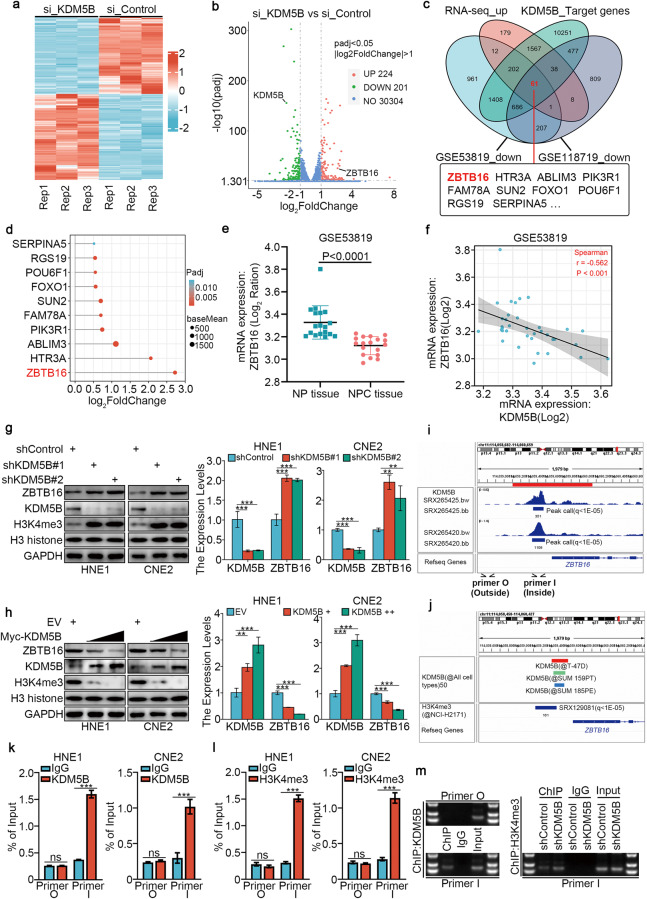
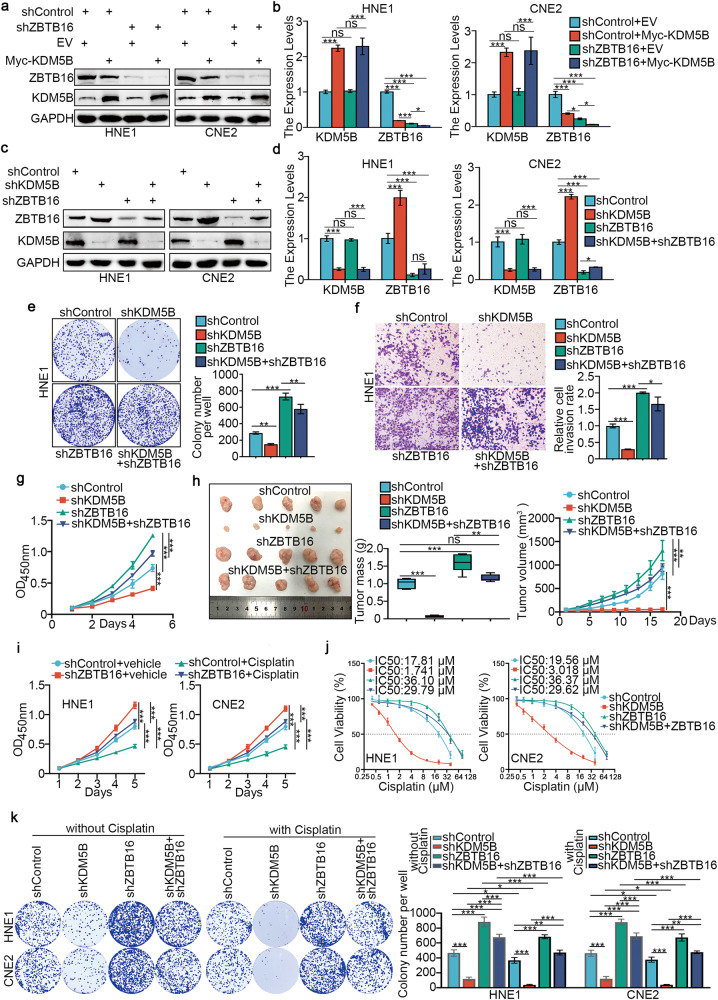
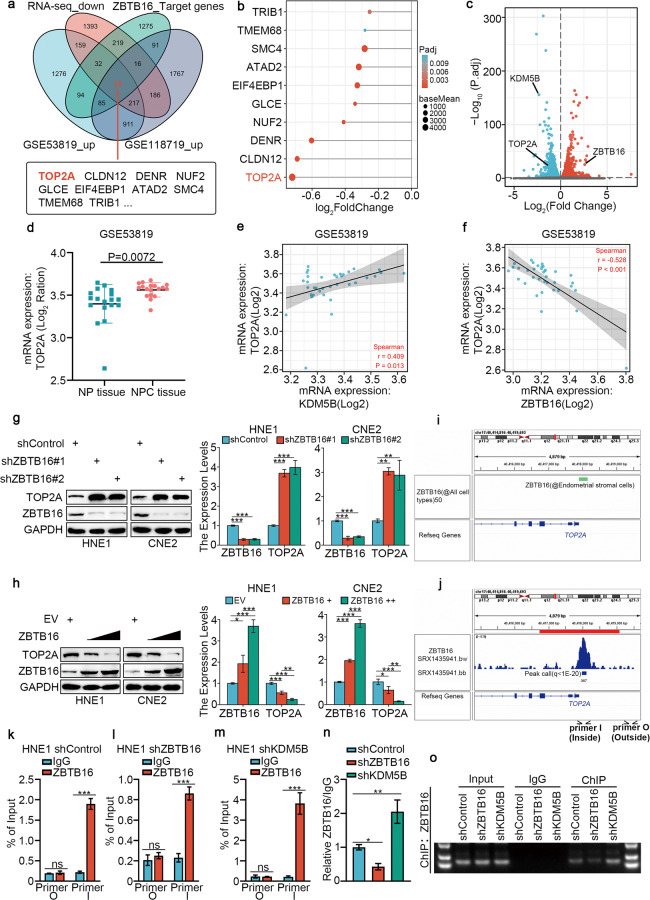
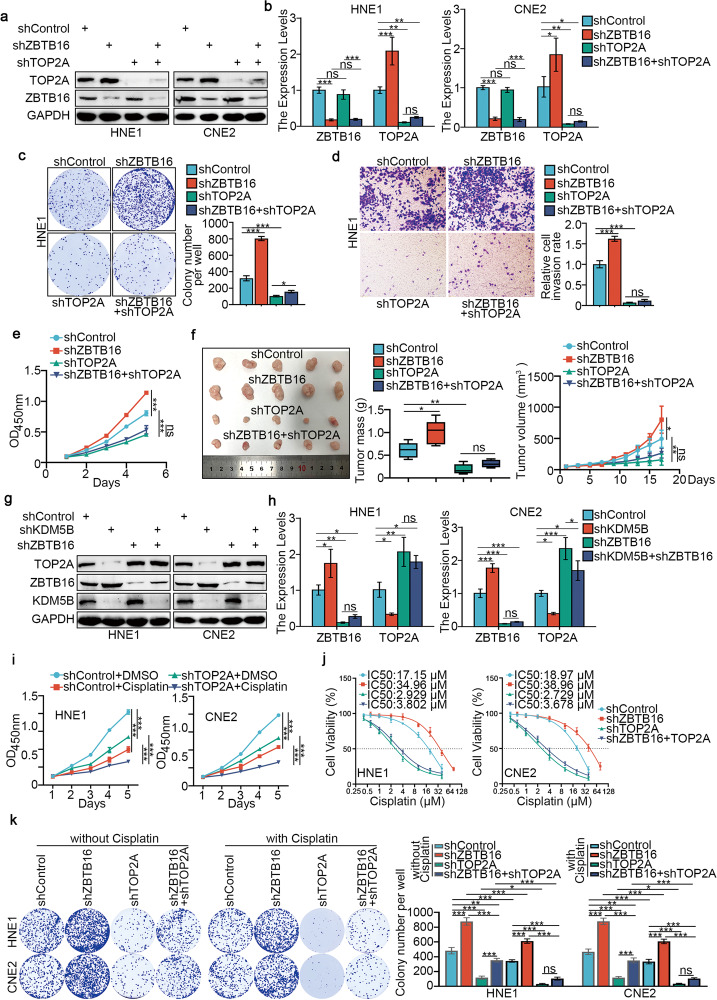
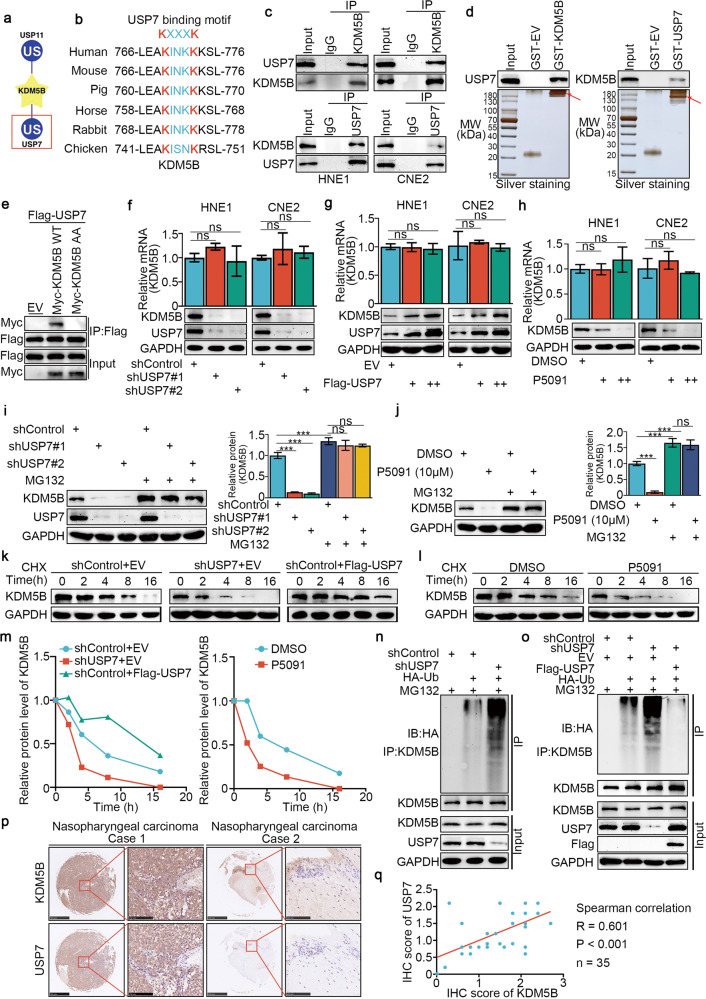
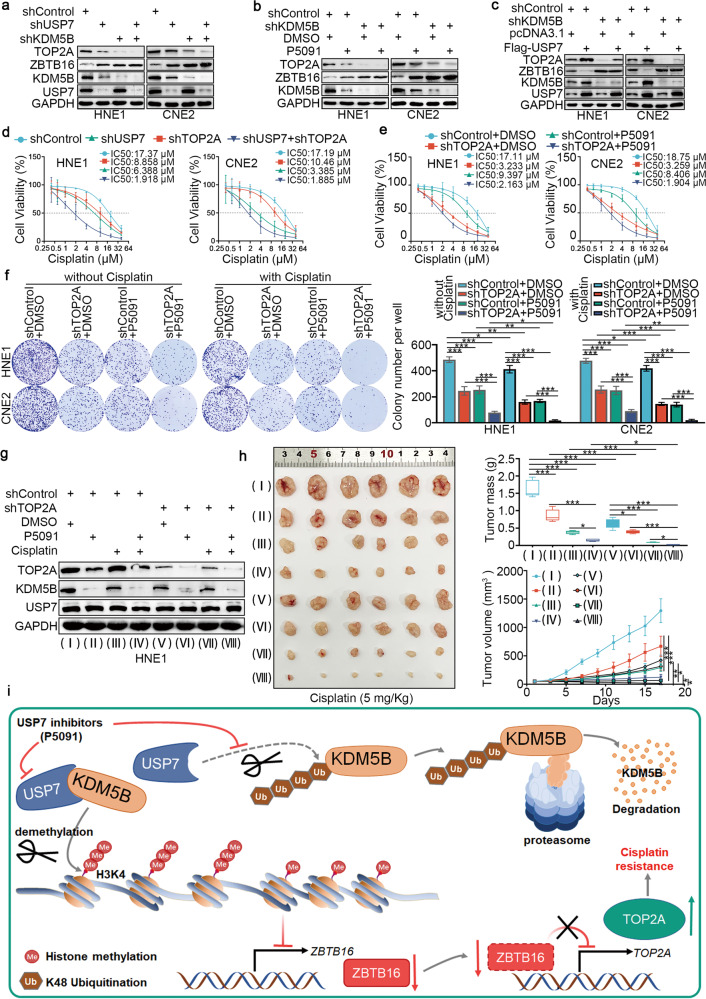
Cisplatin-based chemotherapy improves the control of distant metastases in patients with nasopharyngeal carcinoma (NPC); however, around 30% of patients fail treatment due to acquired drug resistance. Epigenetic regulation is known to contribute to cisplatin resistance; nevertheless, the underlying mechanisms remain poorly understood. Here, we showed that lysine-specific demethylase 5B (KDM5B) was overexpressed and correlates with tumor progression and cisplatin resistance in patients with NPC. We also showed that specific inhibition of KDM5B impaired the progression of NPC and reverses cisplatin resistance, both in vitro and in vivo. Moreover, we found that KDM5B inhibited the expression of ZBTB16 by directly reducing H3K4me3 at the ZBTB16 promoter, which subsequently increased the expression of Topoisomerase II- α (TOP2A) to confer cisplatin resistance in NPC. In addition, we showed that the deubiquitinase USP7 was critical for deubiquitinating and stabilizing KDM5B. More importantly, the deletion of USP7 increased sensitivity to cisplatin by disrupting the stability of KDM5B in NPC cells. Therefore, our findings demonstrated that USP7 stabilized KDM5B and promoted cisplatin resistance through the ZBTB16/TOP2A axis, suggesting that targeting KDM5B may be a promising cisplatin-sensitization strategy in the treatment of NPC.


Conflict of interest statement

The authors declare no competing interests.

Figures

Fig. 1
Fig. 1. Abnormal KDM5B expression promotes proliferation, invasion and cisplatin resistance of NPC cells.
a The flow chart of how to identify KDM5B responsible for regulating histone methylation in NPC. b The bar chart showing the 29 genes ranking according to Log2FC value. c, d Differential expression analyses of KDM5B between tumor and normal tissues in GSE118719 (c) and GSE53829 (d) datasets. e, f HNE1 and CNE2 cells infected with lentivirus vectors expressing KDM5B specific shRNAs or shKDM5B + KDM5B plasmid, after puromycin selection cells were harvested for Western blotting analysis (e), RT-qPCR analysis (e), CCK-8 assay (f). Statistical significance was determined by one-way ANOVA followed by Tukey’s multiple comparisons test. Data presented as Mean ± SD with three replicates. NS not significant; **P < 0.01; ***P < 0.001. g HNE1 cells were transfected with indicated constructs. After puromycin selection, cells were injected subcutaneously into the nude mice for xenografts assay. Tumor volumes were measured every 3 days. Tumors were harvested, photographed, and weighed. Statistical significance was determined by one-way ANOVA followed by Tukey’s multiple comparisons test. Data presented as Mean ± SD with five replicates. *P < 0.05; **P < 0.01; ***P < 0.001. hj HNE1 and CNE2 cells were infected with shControl or shKDM5B plasmid for 48 h. then cells were treated with or without cisplatin (4 μg/ml) for another 48 h. Cells were collected for fluorescein isothiocyanate (FITC)/PI flow cytometry (h, i) and CCK-8 assay (j). Statistical significance was determined by one-way ANOVA followed by Tukey’s multiple comparisons test. Data presented as Mean ± SD with three replicates. **P < 0.01; ***P < 0.001. k HNE1 and CNE2 cells were infected with shControl or shKDM5B for 72 h. Cells were treated with a serial dose of cisplatin. Then, these cells were collected for CCK-8 assay and subjected to measure the IC50 values of cisplatin. l HNE1 and CNE2 cells were transfected with EV or myc-KDM5B for 72 h. Cells were treated with a serial dose of cisplatin. Then, these cells were collected for CCK-8 assay and subjected to measure the IC50 values of cisplatin. Statistical significance was determined by one-way ANOVA followed by Tukey’s multiple comparisons test. Data presented as Mean ± SD with three replicates. m HNE1 cells were transfected with indicated constructs. After puromycin selection, cells were injected subcutaneously into the nude mice for xenografts assay. These mice were treated with or without cisplatin (5 mg·kg−1·day−1, 10 days). Tumor volumes were measured every 3 days. Tumors were harvested, photographed, and weighed. Statistical significance was determined by one-way ANOVA followed by Tukey’s multiple comparisons test. Data presented as Mean ± SD with six replicates. *P < 0.05; ***P < 0.001.
Fig. 2
Fig. 2. KDM5B negatively regulates ZBTB16 expression in NPC.
a, b HNE1 cells infected by siControl or siKDM5B were harvested for Transcriptome RNA sequencing. Heatmap (a) and volcano plot (b) were used to show the differential expressed genes. c Venn diagrams showing numbers of target genes of KDM5B and downregulated genes in the GSE118719 and GSE53819 databases. d The bar chart showing the top of 10 genes ranking according to Log2FC value. e Differential expression analyses of ZBTB16 between tumor and normal tissues in GSE53819 databases. f ZBTB16 was negatively correlated with KDM5B in GSE53819 databases. g HNE1 and CNE2 cells were infected with shControl, shKDM5B #1, or shKDM5B #2 for 72 h. Cells were collected for Western blotting analysis and RT-qPCR analysis. h HNE1 and CNE2 cells were infected with indicated plasmids for 72 h. Cells were collected for Western blotting analysis and RT-qPCR analysis. Statistical significance was determined by one-way ANOVA followed by Tukey’s multiple comparisons test. Data presented as Mean ± SD with three replicates. **P < 0.01; ***P < 0.001. i, j The ChIP-seq of KDM5B on the promoter region of ZBTB16. km The ChIP-qPCR of KDM5B on the promoter region of ZBTB16 in HNE1 and CNE2 cells (k, l). And the DNA electrophoresis of the products from the ChIP assay (m). Statistical significance was determined by two-side Student t-test. Data presented as Mean ± SD with three replicates. ***P < 0.001.
Fig. 3
Fig. 3. KDM5B promotes the progression and cisplatin resistance of NPC by directly inhibiting the expression of ZBTB16.
a, b HNE1 and CNE2 cells were infected with shControl or shZBTB16 for 48 h. Then, cells were transfected with pcDNA3.1 or myc-KDM5B as indicated. After 24 h, cells were harvested for Western blotting analysis (a) and RT-qPCR analysis (b). Statistical significance was determined by one-way ANOVA followed by Tukey’s multiple comparisons test. Data presented as Mean ± SD with three replicates. NS not significant; *P < 0.05; ***P < 0.001. cg HNE1 and CNE2 cells were infected with indicated shRNAs for 72 h. Cells were collected for Western blotting analysis (c), RT-qPCR analysis (d), colony-formation assay (e, only HNE1 cells) and transwell assay (f, only HNE1 cells) and MTS assay (g, only HNE1 cells). Statistical significance was determined by one-way ANOVA followed by Tukey’s multiple comparisons test. Data presented as Mean ± SD with three replicates. NS not significant; *P < 0.05; ***P < 0.001. h HNE1 cells were infected with indicated shRNAs. After 72 h puromycin selection, cells were harvested and subcutaneously injected into nude mice for xenografts assay. Tumor volumes were measured every 3 days. Tumors were harvested, photographed, and weighed. Statistical significance was determined by one-way ANOVA followed by Tukey’s multiple comparisons test. Data presented as Mean ± SD with five replicates. NS not significant; **P < 0.01; ***P < 0.001. i HNE1 and CNE2 cells were infected with shControl or shZBTB16 plasmid for 48 h. then cells were treated with or without cisplatin (4 μg/ml) for another 48 h. Cells were collected for CCK-8 assay. j HNE1 and CNE2 cells were infected with indicated shRNAs for 72 h. Cells were treated with a serial dose of cisplatin. Then, these cells were collected for CCK-8 assay and subjected to measure the IC50 values of cisplatin. k HNE1 and CNE2 cells were infected with indicated shRNAs for 48 h. then cells were treated with or without cisplatin (4 μg/ml) for another 48 h. Cells were collected for colony-formation assay. Statistical significance was determined by one-way ANOVA followed by Tukey’s multiple comparisons test. Data presented as Mean ± SD with three replicates. *P < 0.05; **P < 0.01; ***P < 0.001.
Fig. 4
Fig. 4. ZBTB16 negatively regulates TOP2A expression in NPC.
a Venn diagrams showing numbers of target genes of ZBTB16 and upregulated genes in the GSE118719 and GSE53819 databases. b The bar chart showing the top of 10 genes ranking according to Log2FC value. c volcano plot was used to show the differential expressed genes from RNA-seq. d Differential expression analyses of TOP2A between tumor and normal tissues in GSE53819 databases. e TOP2A was negatively correlated with ZBTB16 in GSE53819 databases. f TOP2A was positively correlated with KDM5B in GSE53819 databases. g HNE1 and CNE2 cells were infected with shControl, shZBTB16 #1, or shZBTB16 #2 for 72 h. Cells were collected for Western blotting analysis and RT-qPCR analysis. h HNE1 and CNE2 cells were infected with indicated plasmids for 72 h. Cells were collected for Western blotting analysis and RT-qPCR analysis. Statistical significance was determined by one-way ANOVA followed by Tukey’s multiple comparisons test. Data presented as Mean ± SD with three replicates. **P < 0.01; ***P < 0.001. i, j The ChIP-seq of ZBTB16 on the promoter region of TOP2A. ko HNE1 cells infected with shControl, shZBTB16, shKDM5B, were harvested for ChIP-qPCR using ZBTB16 antibody (km). The relative quantification of ChIP-qPCR in different groups was presented (n). And the DNA electrophoresis of the products from the ChIP assay (o). Statistical significance was determined by two-side Student t-test. Data presented as Mean ± SD with three replicates. NS not significant; *P < 0.05; **P < 0.01. ***P < 0.001.
Fig. 5
Fig. 5. KDM5B promotes progression and cisplatin resistance in NPC cells through ZBTB16-mediated transcriptional inhibition of TOP2A.
ae HNE1 and CNE2 cells were infected with indicated shZBTB16 or shTOP2A for 72 h. Cells were collected for Western blotting analysis (a), RT-qPCR analysis (b), colony-formation assay (c, only HNE1 cells) and transwell assay (d, only HNE1 cells) and MTS assay (e, HNE1 cells). Statistical significance was determined by one-way ANOVA followed by Tukey’s multiple comparisons test. Data presented as Mean ± SD with three replicates. NS not significant; *P < 0.05; **P < 0.01. ***P < 0.001. f HNE1 cells were infected with indicated shRNAs. After 72 h puromycin selection, cells were harvested and subcutaneously injected into nude mice for xenografts assay. Tumor volumes were measured every 3 days. Tumors were harvested, photographed, and weighed. Statistical significance was determined by one-way ANOVA followed by Tukey’s multiple comparisons test. Data presented as Mean ± SD with five replicates. NS not significant; *P < 0.05; **P < 0.01. g, h HNE1 and CNE2 cells were infected with indicated shKDM5B or shZBTB16 for 72 h. Cells were collected for Western blotting analysis (g), RT-qPCR analysis (h). Statistical significance was determined by one-way ANOVA followed by Tukey’s multiple comparisons test. Data presented as Mean ± SD with three replicates. NS not significant; *P < 0.05; **P < 0.01. ***P < 0.001. i HNE1 and CNE2 cells were infected with shControl or shTOP2A plasmid for 48 h. then cells were treated with or without cisplatin (4 μg/ml) for another 48 h. Cells were collected for CCK-8 assay. j HNE1 and CNE2 cells were infected with indicated shRNAs for 72 h. Cells were treated with a serial dose of cisplatin. Then, these cells were collected for CCK-8 assay and subjected to measure the IC50 values of cisplatin. k HNE1 and CNE2 cells were infected with indicated shRNAs for 48 h. then cells were treated with or without cisplatin (4 μg/ml) for another 48 h. Cells were collected for colony-formation assay. Statistical significance was determined by one-way ANOVA followed by Tukey’s multiple comparisons test. Data presented as Mean ± SD with three replicates. NS not significant; *P < 0.05; **P < 0.01; ***P < 0.001.
Fig. 6
Fig. 6. USP7 promoted the stability of the KDM5B protein in NPC by deubiquitinating KDM5B.
a UbiBrowser showed deubiquitinationases (DUBs) that might interact with KDM5B. b A schematic diagram depicted that the USP7 deubiquitination consensus motif of KDM5B. c HNE1 and CNE2 cells were harvested and immunoprecipitated with IgG and USP7 or KDM5B antibodies. d Western blot analysis for USP7 and KDM5B in HNE1 cells after GST, GST-KDM5B or GST-CBX7 pulldown. The bottom panel shows the Silver staining of GST, GST-KDM5B or GST-CBX7 protein input. e HEK293T cells were transfected with the indicated plasmids and harvested 48 h after transfection. Co-IP experiments were performed and blotted with the indicated antibodies. f, g HNE1 and CNE2 cell lines were infected with constructed plasmids (shUSP7 #1, shUSP7 #2, Flag-USP7). After infecting 48 h and 72 h, all cells were harvested for RT-qPCR and Western Blotting analysis. All data were showed as Means ± SD (n = 3). Ns not significant. h HNE1 and CNE2 cell lines were treated with or without USP7 inhibitors P5091 (10 μM) for 48 h. Then cells were harvested for RT-qPCR and Western Blotting analysis. All data were showed as Means ± SD (n = 3). Ns not significant. i, j HNE1 and CNE2 cell lines were infected with constructed plasmids (shUSP7 #1, shUSP7 #2). After infecting 48 h and 72 h, the corresponding groups were treated with MG132 for another 4 h. All cells were harvested for Western Blotting analysis. k HNE1 cells were infected with indicated plasmids (shUSP7 and Flag-USP7). After infecting 72 h, cells were treated with Cycloheximide (CHX) and all cells were collected for Western Blotting analysis at different time points. l HNE1 cells were treated with or without USP7 inhibitors P5091 (10 μM) for 48 h. Cells were treated with MG132 for another 4 h. Then all cells were collected for Western Blotting analysis. m Statistical line chart of half-life of KDM5B protein. n HNE1 cells were infected with indicated plasmids (shUSP7, HA- Ub). After 24 h, cells were treated with MG132 for 4 h. Then all cells were collected for Western Blotting analysis. o HNE1 cells were treated with indicated plasmids (shUSP7, Flag-USP7, HA-Ub) for 24 h. Then cells were treated with MG132 for 4 h. All cells were collected for Western Blotting analysis. p, q The tissue microarray of NPC was stained with USP7 and KDM5B, respectively (n = 35). The typical IHC images stained with USP7 and KDM5B were shown in panel (p). The size of the scale bar on microscopy images as indicated in the figure. The correlation of these two proteins was shown in panel (q). Spearman correlation was used to determine statistical significance, P < 0.001.
Fig. 7
Fig. 7. The USP7/KDM5B/ZBTB16/TOP2A axis modulates cisplatin resistance in NPC cells.
ac HNE1 and CNE2 cell lines were infected with constructed plasmids (shUSP7, shKDM5B, Flag-USP7). Cells were treated with USP7 inhibitors P5091 (10 μM) in (b). After infecting or treating 72 h, all cells were harvested for Western Blotting analysis. d HNE1 and CNE2 cells were infected with indicated shRNAs for 72 h. Cells were treated with a serial dose of cisplatin. Then, these cells were collected for CCK-8 assay and subjected to measure the IC50 values of cisplatin. e HNE1 and CNE2 cells were infected with shControl or shTOP2A plasmid for 48 h. Then cells were treated with USP7 inhibitors P5091 (10 μM) in a serial dose of cisplatin. Then, these cells were collected for CCK-8 assay and subjected to measure the IC50 values of cisplatin. f HNE1 and CNE2 cells were infected with shControl or shTOP2A plasmid for 48 h. Then cells were treated with USP7 inhibitors P5091 (10 μM) for colony-formation assay in the presence or absence of cisplatin. Statistical significance was determined by one-way ANOVA followed by Tukey’s multiple comparisons test. Data presented as Mean ± SD with three replicates. *P < 0.05; **P < 0.01; ***P < 0.001. g, h HNE1 cells were infected with indicated shRNAs for 72 h. After puromycin selection, cells were harvested for western blot analysis (g) and subcutaneously injected into the nude mice. The western blot analysis was repeated for three replicates. The mice were treated with or without cisplatin (5 mg·kg−1·day−1, 10 days) or USP7 inhibitors (10 mg·kg−1, twice a week). Representative tumor images, tumor weights, and tumor growth curves are shown. Data are shown as mean ± SD (n = 6). Statistical analyses were performed with one‐way ANOVA followed by Tukey’s multiple comparisons tests. Ns not significant; *P < 0.05; ***P < 0.001. The ruler on the top of the representative tumor images on panel h was used to indicate the specific size of tumors. i The schematic diagram for USP7 stabilizing KDM5B to inhibit the expression of ZBTB16, which subsequently increased the expression of TOP2A and promoted NPC cell proliferation and resistance to cisplatin.

References

    1. Siegel RL, Miller KD, Jemal A. Cancer statistics, 2019. CA Cancer J Clin. 2019;69:17–48. doi: 10.3322/caac.21551. - DOI - PubMed
    1. Colevas AD, Yom SS, Pfister DG, Spencer S, Adelstein D, Adkins D, et al. NCCN guidelines insights: head and neck cancers, version 1.2018. J Natl Compr Canc Netw. 2018;16:479–90. doi: 10.6004/jnccn.2018.0026. - DOI - PubMed
    1. Ribassin-Majed L, Marguet S, Lee AWM, Ng WT, Ma J, Chan ATC, et al. What is the best treatment of locally advanced nasopharyngeal carcinoma? An individual patient data network meta-analysis. J Clin Oncol. 2017;35:498–505. doi: 10.1200/JCO.2016.67.4119. - DOI - PMC - PubMed
    1. Zhou C, Shen G, Yang F, Duan J, Wu Z, Yang M, et al. Loss of AKR1C1 is a good prognostic factor in advanced NPC cases and increases chemosensitivity to cisplatin in NPC cells. J Cell Mol Med. 2020;24:6438–47. doi: 10.1111/jcmm.15291. - DOI - PMC - PubMed
    1. Kelland L. The resurgence of platinum-based cancer chemotherapy. Nat Rev Cancer. 2007;7:573–84. doi: 10.1038/nrc2167. - DOI - PubMed

Publication types

MeSH terms