. 2024 Mar;43(5):754-779.
doi: 10.1038/s44318-024-00036-1. Epub 2024 Jan 29.

Optineurin provides a mitophagy contact site for TBK1 activation

Affiliations

Optineurin provides a mitophagy contact site for TBK1 activation

Koji Yamano et al. EMBO J. 2024 Mar.

Abstract

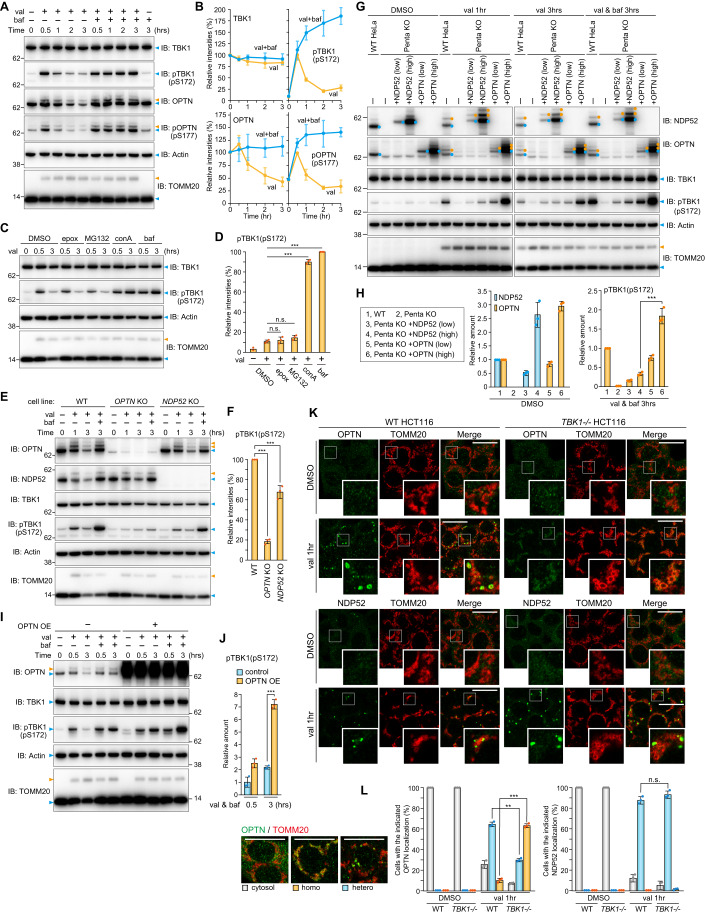
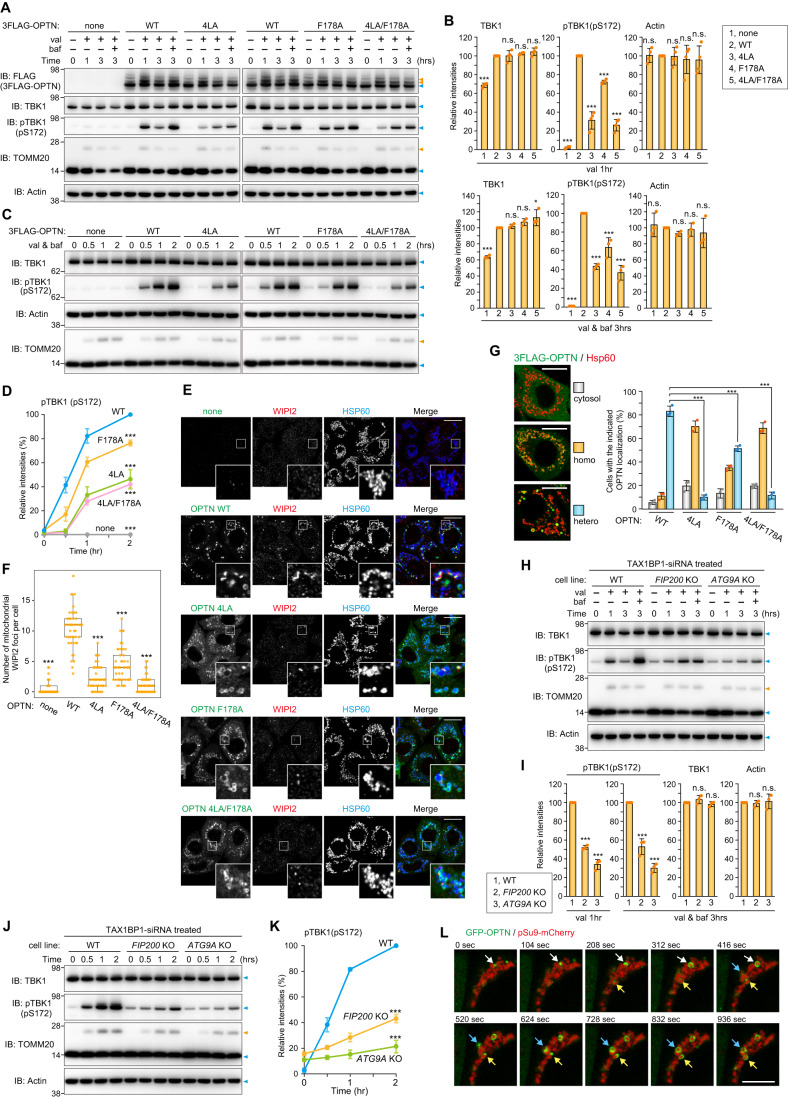
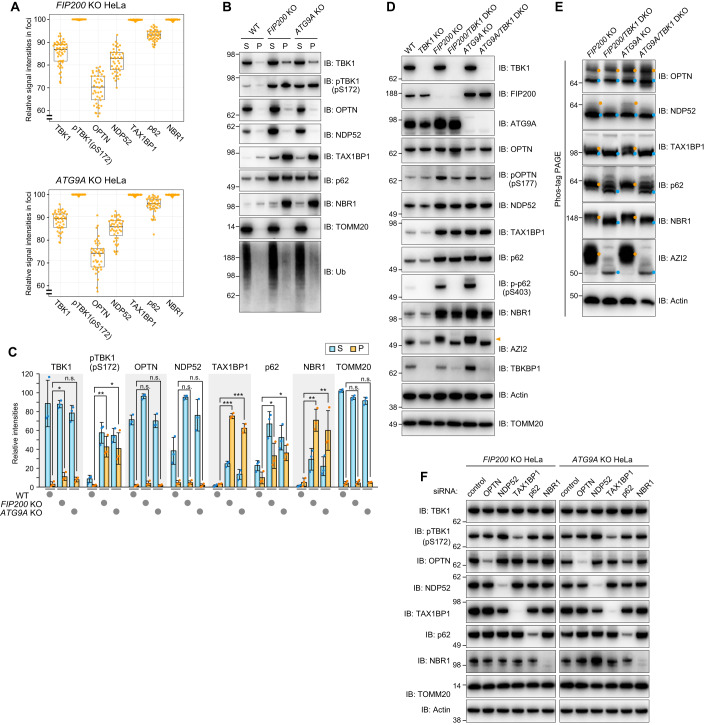
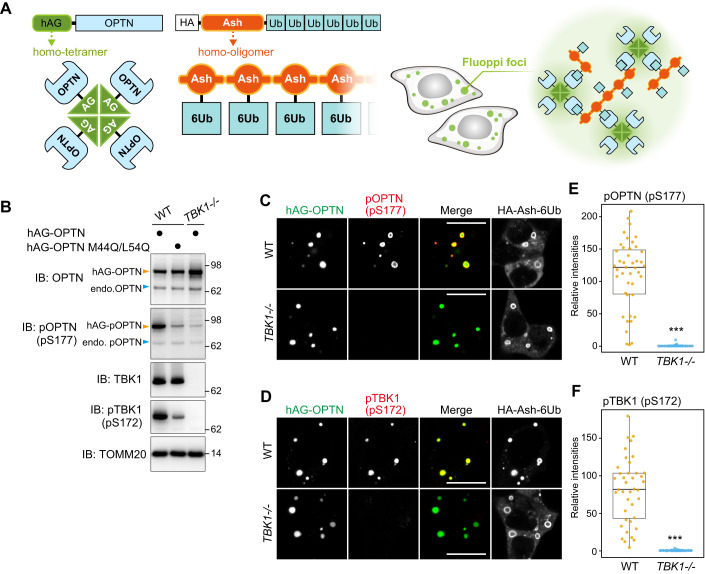
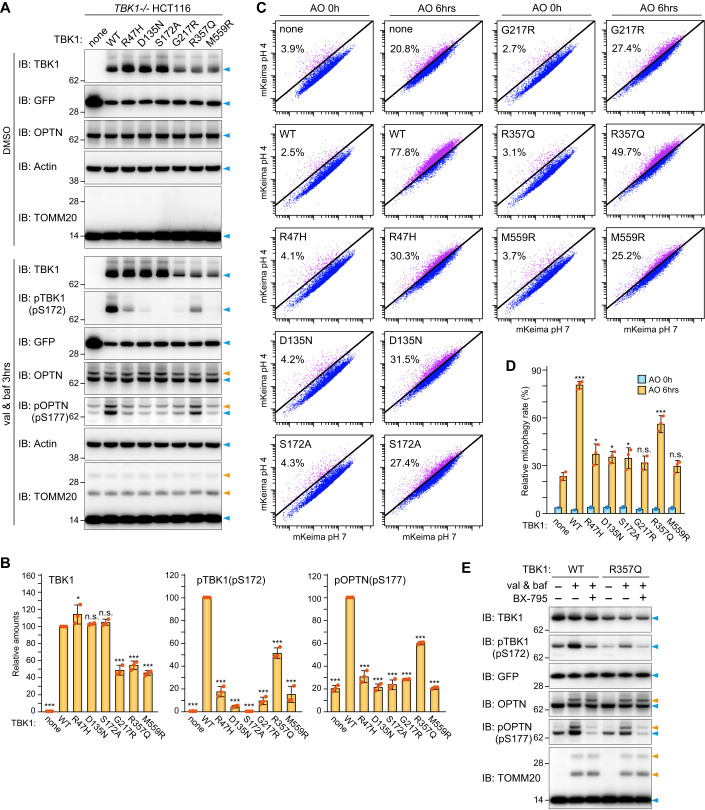
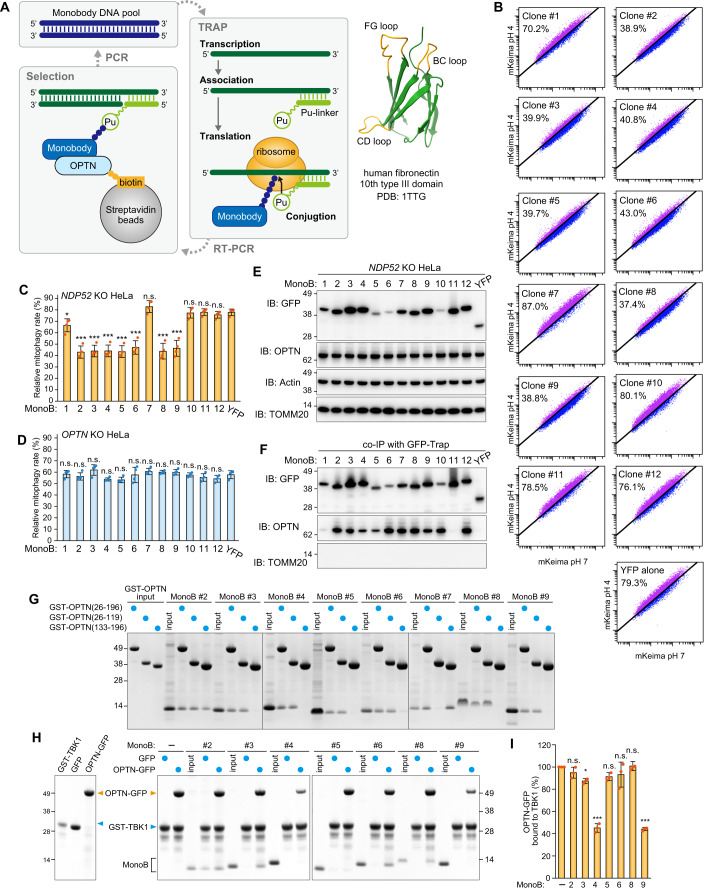
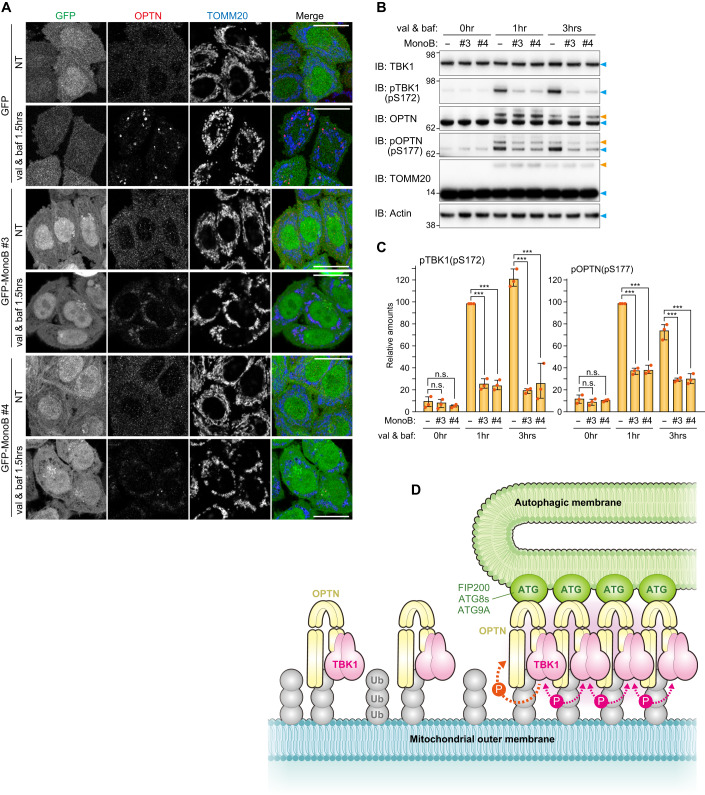
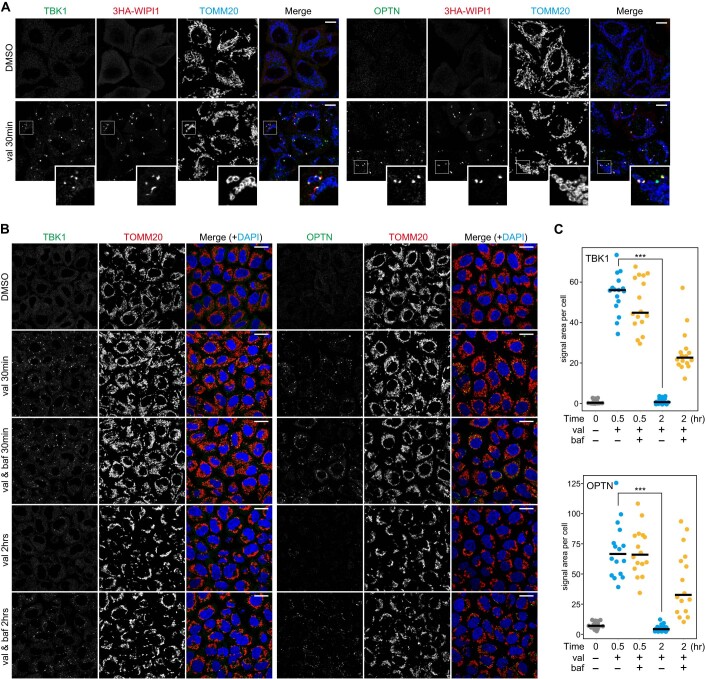
Tank-binding kinase 1 (TBK1) is a Ser/Thr kinase that is involved in many intracellular processes, such as innate immunity, cell cycle, and apoptosis. TBK1 is also important for phosphorylating the autophagy adaptors that mediate the selective autophagic removal of damaged mitochondria. However, the mechanism by which PINK1-Parkin-mediated mitophagy activates TBK1 remains largely unknown. Here, we show that the autophagy adaptor optineurin (OPTN) provides a unique platform for TBK1 activation. Both the OPTN-ubiquitin and the OPTN-pre-autophagosomal structure (PAS) interaction axes facilitate assembly of the OPTN-TBK1 complex at a contact sites between damaged mitochondria and the autophagosome formation sites. At this assembly point, a positive feedback loop for TBK1 activation is initiated that accelerates hetero-autophosphorylation of the protein. Expression of monobodies engineered here to bind OPTN impaired OPTN accumulation at contact sites, as well as the subsequent activation of TBK1, thereby inhibiting mitochondrial degradation. Taken together, these data show that a positive and reciprocal relationship between OPTN and TBK1 initiates autophagosome biogenesis on damaged mitochondria.

Keywords: Autophagy; Mitochondria; PINK1; Parkin; Ubiquitin.


Conflict of interest statement

The authors declare no competing interests.

Figures

Figure 1
Figure 1. Activated TBK1 induced by OPTN during mitophagy is rapidly degraded via autophagy.
(A) HeLa cells stably expressing Parkin were treated with valinomycin (val) and bafilomycin (baf) for the indicated times. Total cell lysates were analyzed by immunoblotting (IB). (B) The levels of proteins indicated in (A) were quantified. TBK1 and OPTN levels without valinomycin were set to 100. pTBK1(pS172) and pOPTN(pS177) levels after 0.5 h val were set to 100. Error bars represent mean ± s.d. of three independent experiments. (C) Parkin-expressing HeLa cells treated with the indicated inhibitors in the presence of val were analyzed by IB. Epox; Epoxomicin, conA; Concanamycin A. (D) pTBK1(pS172) levels after 3 h val treatment in (C) were quantified. Error bars represent mean ± s.d. of three independent experiments. (E) WT, OPTN KO, and NDP52 KO HeLa cells stably expressing Parkin were treated with val and baf for the indicated times. Total cell lysates were analyzed by IB. (F) pTBK1(pS172) levels after 3 h val and baf treatment in (E) were quantified. Error bars represent mean ± s.d. of three independent experiments. (G) Parkin-expressing WT HeLa, Parkin-expressing Penta KO HeLa, or those expressing 3FLAG-NDP52 and 3FLAG-OPTN at different levels (indicated as low and high) were treated with DMSO and val with or without baf for the indicated times, and then analyzed by IB. (H) NDP52 and OPTN in cells treated with DMSO and pTBK1(pS172) in cells treated with val and baf for 3 h in (G) were quantified. Protein levels in WT cells were set to 1. Error bars represent mean ± s.d. of three independent experiments. (I) Parkin-expressing HeLa cells with or without 3FLAG-OPTN overexpression (OE) were treated with val and baf for the indicated times and analyzed by IB. (J) pTBK1(pS172) levels in Parkin-expressing HeLa cells with or without OPTN OE in (I) were quantified. Error bars represent mean ± s.d. of three independent experiments. pTBK1 levels in control cells after 0.5 h val and baf treatment were set to 1. (K) WT and TBK1-/- HCT116 cells stably expressing Parkin were treated with DMSO or val for 1 h and then immunostained with the indicated antibodies. Bars, 10 μm. (L) OPTN and NDP52 localization in cells in (K) were quantified manually. Heterogenous denotes that the protein is assembled on mitochondria and unevenly distributed, whereas homogenous denotes that the protein localizes uniformly on mitochondria. The examples of OPTN distribution are shown in the left. Bars, 10 μm. Error bars represent mean ± s.d. of three independent experiments. Data information: n.s. not significant, **P < 0.01, ***P < 0.001 by two-tailed Student’s t-test (H,J,L) and two-tailed Dunnett’s test (D,F). The light blue and orange arrowheads/dots indicate unmodified and ubiquitinated bands, respectively (A,C,E,G,I). Source data are available online for this figure.
Figure 2
Figure 2. TBK1 activation requires OPTN-autophagic machinery associations.
(A) Penta KO HeLa cells stably co-expressing Parkin and 3FLAG-OPTN WT or the indicated mutants were treated with valinomycin (val) and bafilomycin (baf) for the indicated times. Total cell lysates were analyzed by immunoblotting (IB). (B) The levels of proteins indicated in (A) were quantified. The protein levels in cells expressing OPTN WT were set to 100. Error bars represent mean ± s.d. of three independent experiments. (C) The cells in (A) were treated with val in the presence of baf for the indicated times. Total cell lysates were analyzed by IB. (D) pTBK1(pS172) levels in (C) were quantified. pTBK1 levels in cells expressing OPTN WT after 2 h val and baf treatment were set to 100. Error bars represent mean ± s.d. of three independent experiments. (E) The cells in (A) treated with val for 1 h were immunostained. OPTN was detected with an anti-FLAG antibody. Bars, 10 μm. (F) The number of WIPI2 foci near mitochondria in (E) per cell were quantified manually. The data is shown as a box plot, with the box indicating the inter-quarter range (IQR), the whiskers showing the range of values that are within 1.5 × IQR and a horizontal line indicating the median. More than 45 cells in each cell line were examined in two independent experiments. (G) OPTN localization in cells in (E) was quantified manually. Heterogenous denotes that the protein is assembled on mitochondria and unevenly distributed, whereas homogenous denotes that the protein localizes uniformly on mitochondria. The examples of 3FLAG-OPTN distribution are shown in the left. Bars, 10 μm. Error bars represent mean ± s.d. of three independent experiments. (H) TAX1BP1 siRNA-treated WT, FIP200 KO and ATG9A KO HeLa cells stably expressing Parkin were treated with val and baf for the indicated times. Total cell lysates were analyzed by IB. (I) The levels of proteins indicated in (H) were quantified. The protein levels in WT cells were set to 100. Error bars represent mean ± s.d. of three independent experiments. (J) The cells in (H) were treated with val in the presence of baf for the indicated times. Total cell lysates were analyzed by IB. (K) pTBK1(pS172) levels in (J) were quantified. pTBK1 levels in WT cells after 2 h val and baf treatment were set to 100. Error bars represent mean ± s.d. of three independent experiments. (L) WT HeLa stably expressing GFP-OPTN and pSu9-mCherry were treated with val and analyzed by time-lapse microscopy. Selected frames at 15 min after val treatment (set to 0 s, time-interval every 104 s) are shown. OPTN recruitment to mitochondria is indicated by arrows. Bars, 10 μm. Data information: n.s. not significant, *P < 0.05, ***P < 0.001 by two-tailed Dunnett’s test (B,D,F,G,I,K). The light blue and orange arrowheads indicate unmodified and ubiquitinated bands, respectively (A,C,H,J). Source data are available online for this figure.
Figure 3
Figure 3. TAX1BP1, but not OPTN, increases TBK1 phosphorylation under basal conditions in autophagy gene KO cells.
(A) WT, FIP200 KO, and ATG9A KO HeLa cells were immunostained (see the raw data in Fig. EV5A). The ratios of the signal intensity for each protein in the Ub-condensates relative to those in the cytosol in the FIP200 KO and ATG9A KO cells were calculated as “relative signal intensities in foci”. The data is shown as a box plot, with the box indicating the inter-quarter range (IQR), the whiskers showing the range of values that are within 1.5 × IQR and a horizontal line indicating the median. More than 40 foci (more than 20 cells) in each condition were examined in two independent experiments. (B) WT, FIP200 KO, and ATG9A KO HeLa cells were solubilized using 2% Triton X-100. The supernatants (S) and pellets (P) were separated by centrifugation and then analyzed by immunoblotting (IB). (C) The amount of protein recovered in S and P in (B) was quantified. The total signal intensity (S + P) in FIP200 KO cells for each protein was set to 100. Error bars represent mean ± s.d. of three independent experiments. n.s. not significant, *P < 0.05, **P < 0.01, ***P < 0.001 by two-tailed Dunnett’s test. (D) The indicated proteins in WT, TBK1 KO, FIP200 KO, FIP200/TBK1 DKO, ATG9A KO, and ATG9A/TBK1 DKO HeLa cells were analyzed by IB. The orange arrowhead indicates a slower migrating AZI2 bands. (E) Total cell lysates prepared in (D) were analyzed by Phos-tag PAGE followed by IB. The light blue and orange dots indicate bands for unmodified proteins and proteins phosphorylated by TBK1, respectively. (F) FIP200 KO and ATG9A KO cells treated with the indicated siRNA were analyzed by IB. Source data are available online for this figure.
Figure 4
Figure 4. Artificial OPTN multimerization compensates for the autophagy requirement following TBK1 activation.
(A) Schematic representation of fluoppi foci. (B) The indicated hAG-OPTN constructs were expressed with HA-Ash-6Ub in WT and TBK1-/- HCT116 cells. Total cell lysates were analyzed by immunoblotting (IB). The light blue and orange arrowheads indicate endogenous and hAG-tagged OPTN bands, respectively. (C,D) hAG-OPTN and HA-Ash-6Ub were expressed in WT and TBK1-/- HCT116 cells. The cells were immunostained with antibodies against HA, pOPTN(pS177) for (C), and pTBK1(pS172) for (D). Bars, 10 μm. (E,F) The intensities of pOPTN(pS177) and pTBK1(pS172) in the fluoppi foci in (C) and (D), respectively, were quantified and shown as a box plot, with the box indicating the inter-quarter range (IQR), the whiskers showing the range of values that are within 1.5 × IQR and a horizontal line indicating the median. Error bars represent mean ± s.d. with 50 fluoppi foci quantified in two independent experiments. ***P < 0.001 by two-tailed Student’s t-test. Source data are available online for this figure.
Figure 5
Figure 5. Impact of ALS-associated TBK1 mutations on Parkin-mediated mitophagy.
(A) TBK1-/- HCT116 cells stably expressing Parkin, mt-Keima, and YFP alone (indicated as “none”) or YFP-P2A-TBK1 (WT or the indicated mutants) were treated with DMSO or valinomycin (val) and bafilomycin (baf) for 3 h and then analyzed by immunoblotting (IB). (B) The levels of TBK1, pTBK1(pS172), and pOPTN(pS177) after 3 h of val and baf treatment in (A) were quantified. The protein levels in cells expressing WT TBK1 were set to 100. Error bars represent mean ± s.d. of three independent experiments. (C) Cells in (A) were treated with antimycin A and oligomycin (AO) for 0 or 6 h and analyzed by FACS. Representative FACS data with the percentage of cells exhibiting lysosomal positive mt-Keima are shown. (D) Mitophagy rate (percentage of cells having lysosomal positive Keima) in (C). Error bars represent mean ± s.d. of three independent experiments. (E) TBK1-/- HCT116 cells stably expressing Parkin and YFP-P2A-TBK1 (WT or the R357Q mutant) were treated with val and baf for 3 h with or without 2 μM BX-795. Total cell lysates were analyzed by IB. Data information: n.s. not significant, *P < 0.05, **P < 0.01, ***P < 0.001 by two-tailed Dunnett’s test (B,D). The light blue and orange arrowheads indicate unmodified and ubiquitinated bands, respectively (A,E). Source data are available online for this figure.
Figure 6
Figure 6. Selection and validation of OPTN monobodies.
(A) Schematic representation of the process to select monobodies against OPTN using TRAP display. The BC, CD, and FG loops in the monobody structure (PDB: 1TTG) are shown in orange. (B) NDP52 KO HeLa cells expressing Parkin, mt-Keima, and YFP or YFP-tagged monobodies (MonoB) were treated with antimycin A and oligomycin (AO) for 5 h and analyzed by FACS. Representative FACS data with the percentage of cells exhibiting lysosomal positive mt-Keima are shown. (C) Mitophagy rate (percentage of cells having lysosomal positive Keima) in (B) were quantified. Error bars represent mean ± s.d. of four independent experiments. (D) Mitophagy rate (percentage of cells having lysosomal positive Keima) using OPTN KO HeLa cells were quantified. Error bars represent mean ± s.d. of four independent experiments. (E) NDP52 KO HeLa cells expressing Parkin and YFP or YFP-tagged MonoB were analyzed by immunoblotting (IB). (F) The cells in (E) were co-immunoprecipitated (co-IP) using GFP-Trap. The bound fractions were analyzed by IB. (G) Recombinant GST-OPTN (26–196 aa, 26–119 aa, or 133–196 aa) were incubated with recombinant MonoB. The glutathione sepharose bound fractions were analyzed by CBB staining. (H) Recombinant GST-TBK1 (677–729 aa) and MonoB were incubated with either recombinant GFP or OPTN (26–196 aa)-GFP. GST-TBK1 (677–729 aa) was pulled down with glutathione sepharose and the bound fractions were analyzed by CBB staining. (I) The levels of OPTN (26–196 aa)-GFP pulled down with GST-TBK1 (677–729 aa) in (H) were quantified. The level of OPTN (26–196 aa)-GFP pulled down without MonoB was set to 100. Error bars represent mean ± s.d. of three independent experiments. Data information: n.s. not significant, *P < 0.05, ***P < 0.001 by two-tailed Dunnett’s test (C,D,I). Source data are available online for this figure.
Figure 7
Figure 7. OPTN monobodies inhibit OPTN assembly at the mitophagy-contact sites.
(A) NDP52 KO HeLa cells expressing Parkin, GFP alone, or GFP-tagged monobodies (MonoB) were treated with or without valinomycin (val) and bafilomycin (baf) for 1.5 h. The cells were immunostained with anti-OPTN and TOMM20 antibodies. Bars, 10 μm. (B) The cells in (A) were analyzed by immunoblotting (IB). The light blue and orange arrowheads indicate unmodified and ubiquitinated protein bands, respectively. (C) The levels of pTBK1 and pOPTN in (B) were quantified. The protein levels in cells without MonoB after 1 h val and baf treatment were set to 100. Error bars represent mean ± s.d. of three independent experiments. n.s. not significant, ***P < 0.001 by two-tailed Dunnett’s test. (D) Proposed model of TBK1 activation during PINK1/Parkin-mediated mitophagy. Source data are available online for this figure.
Figure EV1
Figure EV1. TBK1 and OPTN recruitments to damaged mitochondria upon Parkin-mediated mitophagy.
(A) HeLa cells stably expressing Parkin and 3HA-WIPI1 were treated with DMSO or valinomycin (val) for 30 min and immunostained with the indicated antibodies. Magnified images are also shown for cells treated with val. Bars, 10 μm. (B) HeLa cells stably expressing Parkin were treated with DMSO or valinomycin (val) with or without bafilomycin for the indicated times and immunostained with the indicated antibodies. Nuclei were stained with DAPI. Bars, 20 μm. (C) The relative areas of TBK1 (upper) and OPTN (lower) foci on mitochondria per cell were quantified. Each dot represents the mean value determined from 18–36 cells, and the horizontal lines indicate the median. ***P < 0.001 by two-tailed Student’s t-test. Source data are available online for this figure.
Figure EV2
Figure EV2. phosphorylated TBK1 and phosphorylated OPTN productions on damaged mitochondria upon Parkin-mediated mitophagy.
(A) HeLa cells stably expressing Parkin and 3HA-WIPI1 were treated with DMSO or valinomycin (val) for 30 min and immunostained with the indicated antibodies. Magnified images are also shown for cells treated with val. Bars, 10 μm. (B) HeLa cells stably expressing Parkin were treated with DMSO or valinomycin (val) with or without bafilomycin for the indicated times and immunostained with the indicated antibodies. Nuclei were stained with DAPI. Bars, 20 μm. (C) The relative areas of pTBK1(pS172) (upper) and pOPTN(pS177) (lower) foci on mitochondria per cell were quantified. Each dot represents the mean value determined from 18–36 cells, and the horizontal lines indicate the median. ***P < 0.001 by two-tailed Student’s t-test. Source data are available online for this figure.
Figure EV3
Figure EV3. TBK1 activation during Parkin-mediated mitophagy requires autophagy core components.
(A) Depletion of the indicated proteins was confirmed by immunoblotting (IB). The orange arrowhead denotes lipidated forms of LC3B. (B) The indicated cells stably expressing Parkin were treated with val and baf for the indicated times. Total cell lysates were analyzed by IB. (C) The levels of pTBK1(pS172) in (B) were quantified. The level of pTBK1 in WT cells treated with val and baf for 3 h was set to 100. Error bars represent mean ± s.d. of three independent experiments. Signal intensities for pTBK1(pS172) specifically generated during Parkin-mediated mitophagy were determined by subtracting signals for pTBK1 in DMSO from those following val and baf for 3 h (green lines). The difference scores are indicated in the green boxes. (D) HeLa cells stably expressing Parkin treated with the indicated siRNA were analyzed by IB. (E) HeLa cells stably expressing Parkin pre-treated with the indicated siRNA were treated with val and baf for 3 h and analyzed by IB. (F) The levels of pTBK1(pS172) in (E) were quantified. The pTBK1 level in control cells was set to 100%. Error bars represent mean ± s.d. of three independent experiments. Data information: ***P < 0.001 by two-tailed Dunnett’s test (C,F). The light blue and orange arrowheads indicate unmodified and ubiquitinated bands, respectively (B,E). Source data are available online for this figure.
Figure EV4
Figure EV4. Accumulations of autophagy adaptors by loss of autophagy core components.
(A) The indicated proteins in WT, Penta KO, FIP200 KO, ATG5 KO, and ATG9A KO HeLa cells were analyzed by immunoblotting. (B) Protein levels in (A) were quantified. Protein levels in FIP200 KO cells were set to 100. Error bars represent mean ± s.d. of three independent experiments. n.s. not significant, *P < 0.05, **P < 0.01, ***P < 0.001 by two-tailed Dunnett’s test. Source data are available online for this figure.
Figure EV5
Figure EV5. Accumulations of autophagy adaptors in ubiquitin-positive condensates by loss of autophagy core components.
(A,B) WT, FIP200 KO, and ATG9A KO HeLa cells were immunostained with the indicated antibodies. Bars, 10 μm. Source data are available online for this figure.

References

    1. Adriaenssens E, Ferrari L, Martens S. Orchestration of selective autophagy by cargo receptors. Curr Biol. 2022;32:R1357–R1371. doi: 10.1016/j.cub.2022.11.002. - DOI - PubMed
    1. Alam M, Hasan GM, Hassan MI. A review on the role of TANK-binding kinase 1 signaling in cancer. Int J Biol Macromol. 2021;183:2364–2375. doi: 10.1016/j.ijbiomac.2021.06.022. - DOI - PubMed
    1. Cai X, Chiu YH, Chen ZJ. The cGAS-cGAMP-STING pathway of cytosolic DNA sensing and signaling. Mol Cell. 2014;54:289–296. doi: 10.1016/j.molcel.2014.03.040. - DOI - PubMed
    1. Cirulli ET, Lasseigne BN, Petrovski S, Sapp PC, Dion PA, Leblond CS, Couthouis J, Lu YF, Wang Q, Krueger BJ, et al. Exome sequencing in amyotrophic lateral sclerosis identifies risk genes and pathways. Science. 2015;347:1436–1441. doi: 10.1126/science.aaa3650. - DOI - PMC - PubMed
    1. Deas E, Plun-Favreau H, Gandhi S, Desmond H, Kjaer S, Loh SH, Renton AE, Harvey RJ, Whitworth AJ, Martins LM, et al. PINK1 cleavage at position A103 by the mitochondrial protease PARL. Hum Mol Genet. 2011;20:867–879. doi: 10.1093/hmg/ddq526. - DOI - PMC - PubMed

MeSH terms