. 2024 Jan 30;22(1):23.
doi: 10.1186/s12915-024-01829-w.

Migrasomal autophagosomes relieve endoplasmic reticulum stress in glioblastoma cells

Affiliations

Migrasomal autophagosomes relieve endoplasmic reticulum stress in glioblastoma cells

Seon Yong Lee et al. BMC Biol. .

Abstract

Background: Glioblastoma (GBM) is more difficult to treat than other intractable adult tumors. The main reason that GBM is so difficult to treat is that it is highly infiltrative. Migrasomes are newly discovered membrane structures observed in migrating cells. Thus, they can be generated from GBM cells that have the ability to migrate along the brain parenchyma. However, the function of migrasomes has not yet been elucidated in GBM cells.

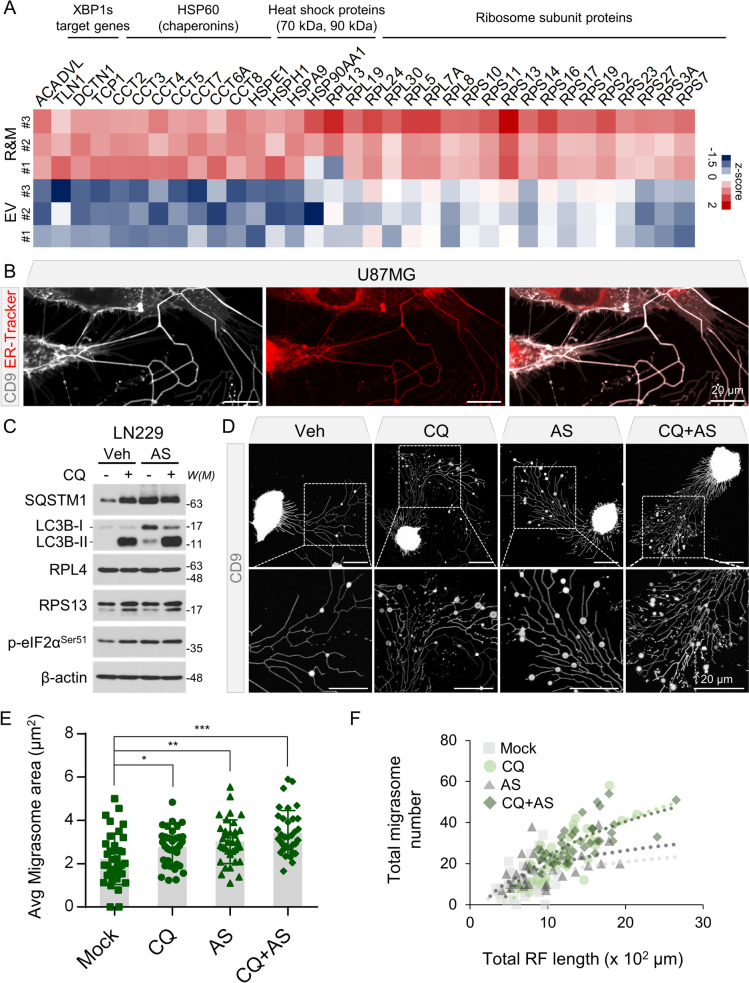
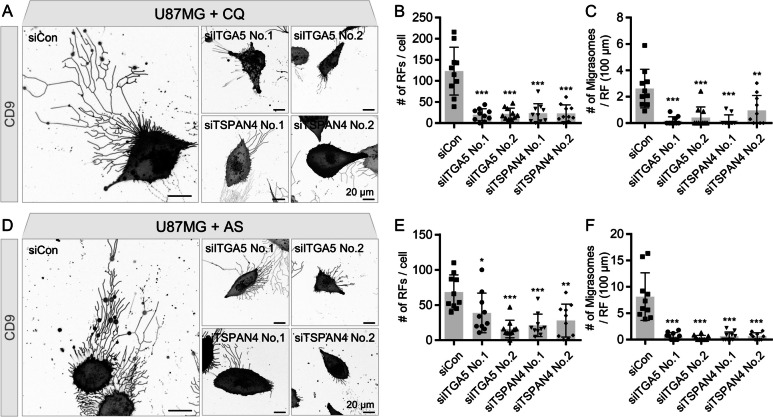
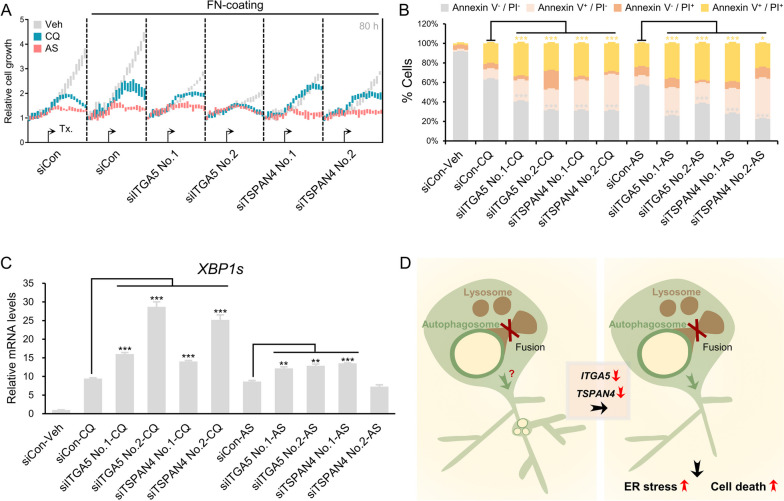
Results: Here, we describe the composition and function of migrasomes generated along with GBM cell migration. Proteomic analysis revealed that LC3B-positive autophagosomes were abundant in the migrasomes of GBM cells. An increased number of migrasomes was observed following treatment with chloroquine (CQ) or inhibition of the expression of STX17 and SNAP29, which are involved in autophagosome/lysosome fusion. Furthermore, depletion of ITGA5 or TSPAN4 did not relieve endoplasmic reticulum (ER) stress in cells, resulting in cell death.

Conclusions: Taken together, our study suggests that increasing the number of autophagosomes, through inhibition of autophagosome/lysosome fusion, generates migrasomes that have the capacity to alleviate cellular stress.

Keywords: Autophagosome; Cell death; ER stress; ITGA5; Migrasome; Retraction fiber; TSPAN4.


Conflict of interest statement

The authors declare that they have no competing interests.

Figures

Fig. 1
Fig. 1
Identifying the presence of autophagosomes within retraction fiber & migrasome (R&M) of glioblastoma cells. A Purification procedures of tumor-derived extracellular vesicle (EV) and R&M. Both samples are purified and further analyzed using liquid chromatography-high-resolution mass spectrometry (LC-HRMS, Orbitrap Exploris 480, triple technical replicates). Samples were divided into three-technically replicated subsamples. For database searching and processing, we searched mapped protein sequences against SwissProt database (release v2019_06) and Proteome discoverer v2.2. B Nanoparticle tracking analysis used for quantifying and qualifying both EV and R&M. Three biological replicates were used for analysis. C Principal component analysis (PCA) shows that EVs and R&Ms have proteins with a distinctly different composition. PCA was performed using relative protein abundance values. The raw values of each protein abundance were converted to log2 values. Then, the amount of protein was corrected using the width adjustment method
Fig. 2
Fig. 2
LC3B-positive autophagosomes are present within the retraction fiber and migrasome (R&M) of glioblastoma cells. A Based on the width-adjusted relative protein abundance values, the protein present in the first quartile or higher in each sample was specified as “Q1.” The remaining proteins, belonging to “Q2–Q4,” were excluded from the predominantly present proteins in each sample. B A scatter plot visualizing the result of Gene Ontology enrichment analysis (GO-Cellular Component v2021) for common Q1 and R&M-specific Q1 combined gene set. Plot was obtained from Enrichment Analysis Visualization Appyter v0.2.5, and it organized similar Gene Ontology gene sets into clusters using first two UMAP dimensions. We manually designated each cluster by follows: mitochondria, ribosome, stress granule, membrane, cell junction, intermediate filament, endocytic vesicle, ER/vesicle, cytoskeleton, spindle, and autophagosome/lysosome. C Western blotting of integrin α5, SQSTM1, LC3B, CD63, α-tubulin, RPL4, RPS13, and GAPDH proteins of whole cell lysate (WCL), EV, and R&M in U87MG and LN229 cells. W(M), molecular weight. D Live-cell imaging for visualizing marker proteins of major cellular organelles derived from the result of (B). White, each marker of cellular organelles; MitoTracker Deep Red for visualizing mitochondria, tdTomato-G3BP1 for visualizing stress granules, EGFP-LC3B for visualizing autophagosomes, and transferrin 488 conjugate for visualizing endocytic vesicles. Green, EGFP-CD9 or DiO/DiI lipophilic tracer. Scale bars (white), 20 μm. Scale bars (yellow), 5 μm
Fig. 3
Fig. 3
Inhibition of autophagosome/lysosome fusion induces retraction fiber and migrasome (R&M) formation. A Live-cell imaging for observing R&Ms formed in LN229 cells. Cells were treated with chloroquine (CQ; 50 μM, 12 h) or bafilomycin A1 (BafA1; 50 nM, 12 h). Gray, EGFP-CD9. Scale bars, 20 μm. B Quantification of the number of retraction fibers (RFs) per a cell. Image analyses were performed using results from (A). n = 19 for vehicle-treated condition, n = 18 for CQ- or BafA1-treated condition. C Quantification of the number of migrasomes per RF (100 μm). Image analyses were performed using the results from (A). D Tandem-fluorescent LC3B was expressed in LN229 cell. Fluorescent signal observed in both cell body and migrasome was quantified respectively. Cells were treated with CQ. Red/green, mRFP-EGFP-LC3B. Black, DiD lipophilic tracer. Scale bars (black), 20 μm. Scale bars (white), 10 μm. E Quantification of D. Total RFP+ vesicle area was quantified in each condition. F Hypothetic graphical scheme of the relationship between autophagosome/lysosome fusion and R&M formation. G In situ proximity ligation assay (PLA) was performed to examine the interaction between LC3B and ATG5 in migrasomes of LN229. Cells were treated with CQ. Red, PLA signal. Gray, EGFP-CD9. Scale bars, 20 μm. Scale bars in cropped panels, 10 μm. H Live-cell imaging for observing R&M formed in LN229 cells expressing EGFP-CD9 after transfection of STX17 or SNAP29 siRNAs. Gray, EGFP-CD9. Scale bars, 20 μm. I Quantification of the number of migrasomes per RF (100 μm). Image analyses were performed using the results from (H). n = 10 for each image. The unpaired nonparametric Mann–Whitney U-test was used to analyze the statistical significance between each group. Data are expressed as mean ± SEM. In all data, **indicates p < 0.01, and ***indicates p < 0.001. The figure is representative of three-biological replicates with similar results
Fig. 4
Fig. 4
Endoplasmic reticulum (ER)-associated proteins are abundant cargo proteins present in retraction fiber & migrasome (R&M). A Heatmap represents highly enriched ER-associated proteins in R&M portion. Relative abundance values of both extracellular vesicle (EV) and R&M samples were standardized to z-score. B Live-cell imaging of U87MG cells for visualizing ER by using ER-Tracker Red. White, EGFP-CD9. Red, ER-Tracker. Scale bars, 20 μm. C Western blotting of SQSTM1, LC3B, RPL4, RPS13, p-eIF2α (Ser51), and β-actin proteins after treatment of chloroquine (CQ; 50 μM, 12 h) or NaAsO2 (AS; 10 μM, 12 h) in LN229 cells. W(M), molecular weight. D Live-cell imaging for quantifying R&M formation in CQ (50 μM, 12 h) or AS (10 μM, 12 h) treatment condition. Green, EGFP-CD9. White, tdTomato-RPS13. Scale bars, 20 μm. E Quantification of average migrasome area (μm2) in data from (D). LN229 cell was used for observation and image analyses. *Indicates p < 0.05; **indicates p < 0.01; ***indicates p < 0.001. Data are expressed as mean ± SEM. The unpaired nonparametric Mann–Whitney U-test was used to analyze the statistical significance between each group (n = 35). F Quantification of total migrasome number and total RF length (× 102 μm) in data from (D)
Fig. 5
Fig. 5
Genetic ablation of ITGA5 or TSPAN4 decrease retraction fiber & migrasome (R&M) formation. A Live-cell imaging of ITGA5 or TSPAN4 siRNA-transfected U87MG cells. Cells were treated with chloroquine (CQ; 50 μM, 12 h) or NaAsO2 (AS; 10 μM, 12 h). Scale bars, 20 μm. B Quantification of the number of RFs per cell. Image analyses were performed using results from (A). ***Indicates p < 0.001. Data are expressed as mean ± SEM. The unpaired nonparametric Mann–Whitney U-test was used to analyze the statistical significance between each group (n = 10). C Quantification of the number of migrasomes per RF (100 μm). Image analyses were performed using results from (A). **Indicates p < 0.01. ***Indicates p < 0.001. Data are expressed as mean ± SEM. The unpaired nonparametric Mann–Whitney U-test was used to analyze the statistical significance between each group (n = 10). D Live-cell imaging of ITGA5 or TSPAN4 siRNA-transfected U87MG cells. Cells were treated with NaAsO2 (AS; 10 μM, 12 h). Scale bars, 20 μm. E Quantification of the number of RFs per a cell. Image analyses were performed using results from (D). *Indicates p < 0.05. **indicates p < 0.01. ***Indicates p < 0.001. Data are expressed as mean ± SEM. The unpaired nonparametric Mann–Whitney U-test was used to analyze the statistical significance between each group (n = 10). F Quantification of the number of migrasomes per RF (100 μm). Image analyses were performed using results from (D). ***Indicates p < 0.001. Data are expressed as mean ± SEM. The unpaired nonparametric Mann–Whitney U-test was used to analyze the statistical significance between each group (n = 10)
Fig. 6
Fig. 6
Cells restrained retraction fiber & migrasome (R&M) formation cannot alleviate ER stress. A Cell growth rate of ITGA5- or TSPAN4-depleted U87MG cells in CQ (50 μM) or AS (10 μM)-treated conditions. Relative cell growth was calculated based on cell confluence mask analyzed by using IncuCyte ZOOM. B Annexin V/PI staining for analyzing cell death of ITGA5- or TSPAN4-depleted U87MG cells in CQ- or AS-treated conditions. Cells were harvested after 72-h treatment of CQ or AS. *Indicates p < 0.05; ***indicates p < 0.001. Data are expressed as mean ± SEM. Student’s t-test was used to analyze the statistical significance between each population (n = 3 for technical replicates). C qRT-PCR data for evaluating mRNA levels of spliced XBP1. *Indicates p < 0.05. **Indicates p < 0.01. ***Indicates p < 0.001. Data are expressed as mean ± SEM. Student’s t-test was used to analyze the statistical significance between each group (n = 3). D Graphical summary of study. In ITGA5- or TSPAN4-depleted condition, cells have a decreased number of R&Ms and lower capability to relieve ER stress, resulting in increased apoptosis

References

    1. Ostrom QT, Gittleman H, Farah P, Ondracek A, Chen Y, Wolinsky Y, et al. CBTRUS statistical report: primary brain and central nervous system tumors diagnosed in the United States in 2006–2010. Neuro Oncol. 2013;15(Suppl 2):ii1–56. doi: 10.1093/neuonc/not151. - DOI - PMC - PubMed
    1. Bohn A, Braley A, Rodriguez de la Vega P, Zevallos JC, Barengo NC. The association between race and survival in glioblastoma patients in the US: a retrospective cohort study. PLoS ONE. 2018;13(6):e0198581. doi: 10.1371/journal.pone.0198581. - DOI - PMC - PubMed
    1. Stupp R, Mason WP, van den Bent MJ, Weller M, Fisher B, Taphoorn MJ, et al. Radiotherapy plus concomitant and adjuvant temozolomide for glioblastoma. N Engl J Med. 2005;352(10):987–996. doi: 10.1056/NEJMoa043330. - DOI - PubMed
    1. Stupp R, Hegi ME, Mason WP, van den Bent MJ, Taphoorn MJ, Janzer RC, et al. Effects of radiotherapy with concomitant and adjuvant temozolomide versus radiotherapy alone on survival in glioblastoma in a randomised phase III study: 5-year analysis of the EORTC-NCIC trial. Lancet Oncol. 2009;10(5):459–466. doi: 10.1016/S1470-2045(09)70025-7. - DOI - PubMed
    1. Weller M, Cloughesy T, Perry JR, Wick W. Standards of care for treatment of recurrent glioblastoma–are we there yet? Neuro Oncol. 2013;15(1):4–27. doi: 10.1093/neuonc/nos273. - DOI - PMC - PubMed

Publication types

LinkOut - more resources