

Fluorescence-Based Lateral Flow Immunoassay for Quantification of Infliximab: Analytical and Clinical Performance Evaluation
- PMID: 38287890
- PMCID: PMC11232936
- DOI: 10.1097/FTD.0000000000001176
Fluorescence-Based Lateral Flow Immunoassay for Quantification of Infliximab: Analytical and Clinical Performance Evaluation
Abstract
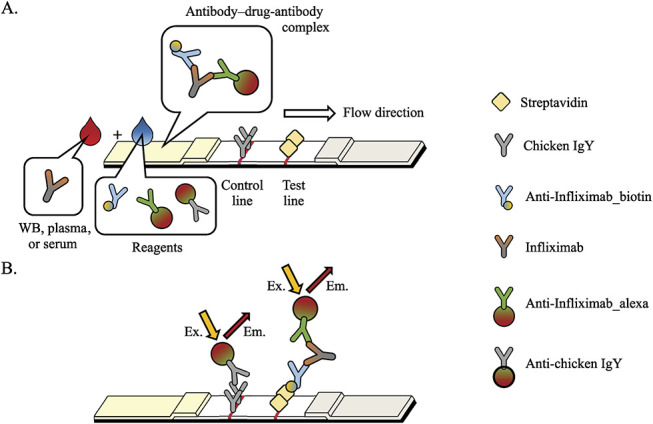
Background: Therapeutic drug monitoring of infliximab (IFX) can improve treatment outcomes; however, the temporal gap between drug concentration monitoring and subsequent availability restricts its practical application. To address this issue, an automated monitoring method, AFIAS IFX, was developed to rapidly and accurately analyze IFX concentration in blood. The analytical and clinical performances of this method were assessed to establish its clinical utility.
Methods: The analytical performance of AFIAS IFX was evaluated according to Clinical and Laboratory Standard Institute guidelines. For clinical validation, AFIAS IFX was compared with 3 established enzyme-linked immunosorbent assay kits (LISA TRACKER, RIDASCREEN, and ImmunoGuide) using 100 consecutive samples from 28 patients treated with IFX. Passing-Bablok regression and Bland-Altman analyses were performed to compare the methods.
Results: The detection and quantification limits of AFIAS IFX were 0.12 and 0.20 mcg/mL, respectively. Furthermore, AFIAS IFX analyzed samples within 10 minutes for concentrations up to 50 mcg/mL, exhibiting reproducibility (coefficient of variation [CV] ≤7.8%) and accuracy (recovery 98%-101%) with serum, plasma, and whole blood samples. Clinically, it exhibited a good correlation with the 3 established enzyme-linked immunosorbent assay kits. For patients treated with Remicade (IFX), the Passing-Bablok regression slope was 1.001-1.259, with a mean difference of -1.48 to 0.28 mcg/mL. For patients treated with CT-P13, the Passing-Bablok regression slope was 0.974-1.254, with a mean difference of -2.44 to 0.15 mcg/mL.
Conclusions: AFIAS IFX, a novel fluorescence-based lateral flow assay, exhibited excellent performance in analyzing IFX trough levels and is a potentially powerful tool for therapeutic drug monitoring in clinical settings, with opportunities for further development.
Copyright © 2024 The Author(s). Published by Wolters Kluwer Health, Inc. on behalf of the International Association of Therapeutic Drug Monitoring and Clinical Toxicology.
Conflict of interest statement
M.L. and H.C. have been involved in the development of the product discussed in this paper, only. Their involvement was limited and not extend to any other aspects of this study. The remaining authors declare no conflict of interest.
Figures


Similar articles
-
Annual Therapeutic Drug Monitoring in Patients with Inflammatory Bowel Disease During Infliximab Maintenance Therapy: Balancing Efficacy with Risk of Pharmacokinetic Failure.Dig Dis Sci. 2025 Aug;70(8):2804-2814. doi: 10.1007/s10620-025-09032-9. Epub 2025 Apr 29. Dig Dis Sci. 2025. PMID: 40299290 Free PMC article.
-
Real-World Effectiveness and Safety of Infliximab Biosimilar CT-P13 for Rheumatic Diseases: A National Observational Cohort Study (ReFLECT).Adv Ther. 2025 Sep;42(9):4659-4680. doi: 10.1007/s12325-025-03304-6. Epub 2025 Jul 28. Adv Ther. 2025. PMID: 40720061 Free PMC article.
-
Evaluating the Accuracy and Clinical Utility of AFIAS-10 Point of Care Versus Enzyme-Linked Immunosorbent Assay in Therapeutic Drug Monitoring of Infliximab and Adalimumab.Ther Drug Monit. 2025 Jun 1;47(3):346-352. doi: 10.1097/FTD.0000000000001269. Epub 2024 Nov 15. Ther Drug Monit. 2025. PMID: 40341590
-
Infliximab, adalimumab and golimumab for treating moderately to severely active ulcerative colitis after the failure of conventional therapy (including a review of TA140 and TA262): clinical effectiveness systematic review and economic model.Health Technol Assess. 2016 May;20(39):1-326. doi: 10.3310/hta20390. Health Technol Assess. 2016. PMID: 27220829 Free PMC article.
-
Impact of antibodies to infliximab on clinical outcomes and serum infliximab levels in patients with inflammatory bowel disease (IBD): a meta-analysis.Am J Gastroenterol. 2013 Jan;108(1):40-7; quiz 48. doi: 10.1038/ajg.2012.363. Epub 2012 Nov 13. Am J Gastroenterol. 2013. PMID: 23147525 Free PMC article.
Cited by
-
Measurement of Anti-TNF Biologics in Serum Samples of Pediatric Patients: Comparison of Enzyme-Linked Immunosorbent Assay (ELISA) with a Rapid and Automated Fluorescence-Based Lateral Flow Immunoassay.Pharmaceutics. 2025 Mar 26;17(4):421. doi: 10.3390/pharmaceutics17040421. Pharmaceutics. 2025. PMID: 40284416 Free PMC article.
References
-
- Prignano F, Choi J, Pieper B, et al. . Anti-tumor necrosis factor agents in psoriasis: addressing key challenges using biosimilars. Expert Opin Biol Ther. 2021;21:75–80. - PubMed
MeSH terms
Substances
LinkOut - more resources
Full Text Sources
Miscellaneous
