. 2024 Jan 15:17:1287233.
doi: 10.3389/fnins.2023.1287233. eCollection 2023.

Response to experimental cold-induced pain discloses a resistant category among endurance athletes, with a distinct profile of pain-related behavior and GABAergic EEG markers: a case-control preliminary study

Affiliations

Response to experimental cold-induced pain discloses a resistant category among endurance athletes, with a distinct profile of pain-related behavior and GABAergic EEG markers: a case-control preliminary study

Franziska Peier et al. Front Neurosci. .

Abstract

Pain is a major public health problem worldwide, with a high rate of treatment failure. Among promising non-pharmacological therapies, physical exercise is an attractive, cheap, accessible and innocuous method; beyond other health benefits. However, its highly variable therapeutic effect and incompletely understood underlying mechanisms (plausibly involving the GABAergic neurotransmission) require further research. This case-control study aimed to investigate the impact of long-lasting intensive endurance sport practice (≥7 h/week for the last 6 months at the time of the experiment) on the response to experimental cold-induced pain (as a suitable chronic pain model), assuming that highly trained individual would better resist to pain, develop advantageous pain-copying strategies and enhance their GABAergic signaling. For this purpose, clinical pain-related data, response to a cold-pressor test and high-density EEG high (Hβ) and low beta (Lβ) oscillations were documented. Among 27 athletes and 27 age-adjusted non-trained controls (right-handed males), a category of highly pain-resistant participants (mostly athletes, 48.1%) was identified, displaying lower fear of pain, compared to non-resistant non-athletes. Furthermore, they tolerated longer cold-water immersion and perceived lower maximal sensory pain. However, while having similar Hβ and Lβ powers at baseline, they exhibited a reduction between cold and pain perceptions and between pain threshold and tolerance (respectively -60% and - 6.6%; -179.5% and - 5.9%; normalized differences), in contrast to the increase noticed in non-resistant non-athletes (+21% and + 14%; +23.3% and + 13.6% respectively). Our results suggest a beneficial effect of long-lasting physical exercise on resistance to pain and pain-related behaviors, and a modification in brain GABAergic signaling. In light of the current knowledge, we propose that the GABAergic neurotransmission could display multifaceted changes to be differently interpreted, depending on the training profile and on the homeostatic setting (e.g., in pain-free versus chronic pain conditions). Despite limitations related to the sample size and to absence of direct observations under acute physical exercise, this precursory study brings into light the unique profile of resistant individuals (probably favored by training) allowing highly informative observation on physical exercise-induced analgesia and paving the way for future clinical translation. Further characterizing pain-resistant individuals would open avenues for a targeted and physiologically informed pain management.

Keywords: GABA; cold pressure test; electroencephalogram; endurance training; exercise-induced hypoalgesia; pain; pain resistance; physical exercise.


Conflict of interest statement

The authors declare that the research was conducted in the absence of any commercial or financial relationships that could be construed as a potential conflict of interest.

Figures

Figure 1
Figure 1
The cold pressure test (CPT) procedure. A continuous EEG recording was performed during the whole procedure (black right-oriented arrow on top of the figure), as well as an additional resting-state recording before and after the CPT. After 2 min of warm water immersion at 32°C (red thermometer in water), the participant immersed his right hand in iced cold-water at 4°C (blue water drop with ice) for a maximal duration of 4 min and thereafter again in warm water to recover for 15 min. The time elapsed between cold water immersion and the appearance of pain (pain threshold, THR) corresponded to the pain appearance time (PAT, blue horizontal line with double arrow), whereas the time between pain appearance and the maximal pain (pain tolerance, TOL; when the participant was required to remove his hand from the cold water) represented the pain perception time (PPT, blue horizontal double arrowed line). The cold immersion time (CIT, green double arrow) was the sum of PAT and PPT. The respective levels of pain intensity (indicating the sensory pain, S) and unpleasantness (assessing the affective pain, A) were separately measured using the numerical rating scale (NRS) at THR and at TOL. Key experimental step timing was recorded using E-Prime 3.0-generated triggers initiated by the investigator (black hand above the button) upon the participant’s indications. The illustrating cartoons (Right hand, Hot water, Cold water and Black hand pushing the button) were dowloaded as freely available images from the web links in September 2021.
Figure 2
Figure 2
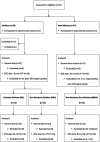
Overview of the selection procedure for participants and data at different analysis steps. In total 55 participants were screened (28 athletes and 27 non-athletes). One athlete was secondarily excluded from the primarily analysis because he was ambidextrous. In addition, 4 participants (1 athlete and 3 non-athletes) were excluded from the EEG analysis and one more non-athletes from the EEG analysis at baseline (BL) because of the poor quality their recordings. For the specific analysis of the three categories related to pain resistance (RA, NRA and NRNA), 5 resistant non-athletes were excluded because of the small sample and the same participants excluded from the EEG data analysis belonged, respectively, to the non-resistant athlete (NRA, n = 1) and to the non-athletes [NA, baseline (BL): n = 4, cold pressure test (CPT): n = 3] groups.
Figure 3
Figure 3
Electroencephalographic (EEG) global power spectra (GPS) according to frequency bands during cold and pain perceptions in athletes and non-athletes. GPS (in μV2/Hz) are presented on the y-axis as median (horizontal black line) and interquartile range (IQR, upper and lower edges of the box), while grey whiskers indicate minimum and maximum values. GPS during cold and pain perceptions are, respectively, shown in light blue and light red colors. Different frequency bands are represented on the x-axis: Low Beta (Lβ; 13-20 Hz) and High Beta (Hβ; 20–30 Hz) in A and C graphs; Alpha (α; 8–12 Hz) and Delta (δ; 2–4 Hz) in B and D graphs. The numbers at the top indicate GPS decrease (−) or increase (+) between cold and pain in percentage (%) normalized to the value during pain perception. Athletes (top panels) showed a decrease in GABAergic markers (A); respectively from 302 (122) to 285 (248) μV2/Hz (Lβ, p = 1.0) and from 331 (281) to 294 (235) μV2/Hz (Hβ, p = 0.318). In contrast, an increase was observed in the α band (from 371 (266) to 468 (560) μV2/Hz; p = 0.018) whereas δ GPS remained unchanged (from 1390 (918) to 1,390 (979); p = 0.912) (B). Non-athletes (bottom panels) displayed a systematic increase in all frequency bands: Lβ (from 287 (209) to 325 (235) μV2/Hz; p = 0.014) and Hβ (from 237 (242) to 276 (344) μV2/Hz; p = 0.903) (C); α (from 317 (281) to 396 (335) μV2/Hz; p = 0.010) and δ (from 989 (756) to 1,438 (847); p = 0.059) (D). *Indicates significant results (p < 0.05, 95% CI) from a repeated ANOVA and a Tukey tested for post-hoc differences, while at the same time correcting for multiple testing.
Figure 4
Figure 4
Electroencephalographic (EEG) global power spectra (GPS) according to frequency bands during cold and pain perceptions in resistant athletes (RA) and non-resistant non-athletes (NRNA). GPS (in μV2/Hz) are presented on the y-axis as median (horizontal black line) and interquartile range (IQR, upper and lower edges of the box), while grey whiskers indicate minimum and maximum values. GPS during cold and pain perceptions are, respectively, shown in light blue and light red colors. Different frequency bands are represented on the x-axis: Low Beta (Lβ; 13–20 Hz) and High Beta (Hβ; 20–30 Hz) in A and C graphs; Alpha (α; 8–12 Hz) and Delta (δ; 2–4 Hz) in B and D graphs. The numbers at the top indicate GPS decrease (−) or increase (+) between cold and pain in percentage (%) normalized to the value during pain perception. RA (top panels) showed a decrease in GABAergic markers (A); respectively from 288 (159) to 270 (98.1) μV2/Hz, (Lβ, p = 0.975) and from 275 (207) to 170 (180) μV2/Hz (Hβ, p = 0.183), as well as δ GPS (from 1443 (915) to 1264 (1109) μV2/Hz; p = 0.874). In contrast, an increase was observed in the α band (from 389 (371) to 477 (774) μV2/Hz; p = 0.045) (B). NRNA (bottom panels) displayed an increase in all frequency bands: Lβ (from 296 (184) to 345 (199) μV2/Hz; p = 0.030) and Hβ (from 244 (226) to 310 (264) μV2/Hz; p = 0.734) (C); α (from 355 (274) to 494 (354) μV2/Hz; p = 0.072) and δ (from 1120 (722) to 1452 (1091) μV2/Hz; p = 0.057) (D). *Indicates significant results (p < 0.05, 95% CI) from a repeated ANOVA and a Tukey tested for post-hoc differences, while at the same time correcting for multiple testing.
Figure 5
Figure 5
Electroencephalographic (EEG) global power spectra (GPS) according to frequency bands at pain threshold (THR) and at pain tolerance (TOL) in resistant athletes (RA) and non-resistant non-athletes (NRNA). GPS (in μV2/Hz) are presented on the y-axis as median (horizontal black line) and interquartile range (IQR, upper and lower edges of the box), while grey whiskers indicate minimum and maximum values. GPS at THR and TOL are, respectively, shown in bright blue and bright red colors. Different frequency bands are represented on the x-axis: Low Beta (Lβ; 13-20 Hz) and High Beta (Hβ; 20-30 Hz) in A and C graphs; Alpha (α; 8–12 Hz) and Delta (δ; 2–4 Hz) in B and D graphs. The numbers at the top indicate GPS decrease (−) or increase (+) between cold and pain in percentage (%) normalized to the value during at TOL. RA (top panels) showed a decrease in GABAergic markers (A); respectively from 269 (217) to 254 (176), μV2/Hz (Lβ, p = 0.653) and from 383 (287) to 137 (240) μV2/Hz (Hβ, p = 0.039). In contrast, an increase was observed in the α band (from 411 (254) to 444 (361) μV2/Hz; p = 0.853) and in δ GPS (from 1091 (577) to 1203 (775) μV2/Hz; p = 0.658) (B). NRNA (bottom panels) displayed an increase in all frequency bands: Lβ (from 292 (159) to 338 (276) μV2/Hz; p = 0.061) and Hβ (from 256 (238) to 334 (345) μV2/Hz; p = 0.905) (C); α (from 336 (350) to 494 (499) μV2/Hz; p = 0.037) and δ (from 999 (1534) to 2034 (1510) μV2/Hz; p = 0.655) (D). *Indicates significant results (p < 0.05, 95% CI) from a repeated ANOVA and a Tukey tested for post-hoc differences, while at the same time correcting for multiple testing.
Figure 6
Figure 6
Overview of Spearman Rho (rs) correlations between clinical indicators, psychophysical data and EEG markers in resistant athletes (RA) and in non-resistant non-athletes (NRNA). Red arrows represent negative correlations and green arrows the positive ones. Plain arrows correspond to significant correlations persisting after Benjamini Hochberg (BH) correction, while dashed arrows indicate large-effect size significant correlations that disappeared upon correction. Indicators labeled in light blue and light red were evaluated, respectively, during cold and pain perceptions; those in dark blue and dark red were calculated at threshold (THR) and tolerance (TOL) time-points, respectively. HAD=Hospital Anxiety and Depression scale for anxiety (HADA) and for depression (HADD), PCS=Pain Catastrophizing Scale, CSI=Central Sensitization Index, NRS=Numeric Rating Scale, ISI=Insomnia Severity Index. In RA (A, top panel), PCS correlated to the weekly training duration (rs = −0.569, p = 0.043) and to HADA (rs = −0.563, p = 0.045). HADA was correlated to ISI (rs = 0.619, p = 0.024). Pain appearance time and pain perception time were correlated one to each other (rs = −1.0, p < 0.001) and both with NRS Unpleasantness at TOL (rs = −0.674, p = 0.011 and rs = 0.674, p = 0.011, respectively). In addition, Lβ GPS at THR correlated with NRS Intensity at TOL (rs = −0.780, p = 0.002) and PCS (rs = −0.637, p = 0.019). Lβ GPS at TOL correlated with NRS Intensity at TOL (rs = −0.588, p = 0.034), Hβ GPS at THR with PCS (rs = −0.692, p = 0.009) and NRS Intensity at TOL (rs = −0.693, p = 0.009). A correlation was noticed between α GPS during cold and NRS Unpleasantness at THR (rs = 0.566, p = 0.044) and between δ GPS during pain and PCS (rs = 0.640, p = 0.018). In NRNA (B, bottom panel), CSI was correlated to HADA (rs = 0.740, p < 0.001) and to HADD (rs = 0.658, p < 0.001), the latter being correlated to the other (rs = 0.599, p = 0.003). CSI correlated with ISI (rs = 0.528, p = 0.012). NRS Intensity and NRS Unpleasantness were, respectively, correlated to each other at THR (rs = 0.732, p < 0.001) and at TOL (rs = 0.723, p < 0.001). Pain perception time correlated with HADA (rs = −0.534, p = 0.022) and pain appearance time correlated with NRS Unpleasantness at THR (rs = 0.599, p = 0.004). In addition, pain perception time correlated with the cold immersion time (rs = 0.887, p < 0.001). A correlation was seen between Hβ GPS at THR and FPQ-9 (rs = 0.540, p = 0.017), and between α GPS during cold (rs = 0.523, p = 0.022) and at THR (rs = 0.540 p = 0.017) with ISI, between α GPS during pain (rs = 0.560, p = 0.013) and at TOL (rs = 0.576, p = 0.001) with the self-reported sleep duration per night.

Similar articles

References

    1. Adams V., Linke A. (2019). Impact of exercise training on cardiovascular disease and risk. Biochim. Biophys. Acta Mol. basis Dis. 1865, 728–734. doi: 10.1016/j.bbadis.2018.08.019 - DOI - PubMed
    1. Akoglu H. (2018). User's guide to correlation coefficients. Turk J Emerg Med 18, 91–93. doi: 10.1016/j.tjem.2018.08.001, PMID: - DOI - PMC - PubMed
    1. Årnes A. P., Nielsen C. S., Stubhaug A., Fjeld M. K., Johansen A., Morseth B., et al. . (2023). Longitudinal relationships between habitual physical activity and pain tolerance in the general population. PLoS One 18:e0285041. doi: 10.1371/journal.pone.0285041, PMID: - DOI - PMC - PubMed
    1. Assa T., Geva N., Zarkh Y., Defrin R. (2019). The type of sport matters: pain perception of endurance athletes versus strength athletes. Eur. J. Pain 23, 686–696. doi: 10.1002/ejp.1335, PMID: - DOI - PubMed
    1. Barr M. S., Farzan F., Davis K. D., Fitzgerald P. B., Daskalakis Z. J. (2013). Measuring GABAergic inhibitory activity with TMS-EEG and its potential clinical application for chronic pain. J. Neuroimmune Pharmacol. 8, 535–546. doi: 10.1007/s11481-012-9383-y, PMID: - DOI - PubMed

LinkOut - more resources