

Temporal trends in hypertension related end stage renal disease mortality rates: an analysis of gender, race/ethnicity, and geographic disparities in the United States
- PMID: 38288382
- PMCID: PMC10823365
- DOI: 10.3389/fneph.2023.1339312
Temporal trends in hypertension related end stage renal disease mortality rates: an analysis of gender, race/ethnicity, and geographic disparities in the United States
Abstract
Background: According to one USA Renal Data System report, 57% of end-stage renal disease (ESRD) cases are attributed to hypertensive and diabetic nephropathy. Yet, trends in hypertension related ESRD mortality rates in adults ≥ 35 years of age have not been studied.
Objectives: The aim of this retrospective study was to analyze the different trends hypertension related ESRD death rates among adults in the United States.
Methods: Death records from the CDC (Centers for Disease Control and Prevention Wide-Ranging OnLine Data for Epidemiologic Research) database were analyzed from 1999 to 2020 for hypertension related ESRD mortality in adults ≥ 35 years of age. Age-Adjusted mortality rates (AAMRs) per 100,000 persons and annual percent change (APC) were calculated and stratified by year, sex, race/ethnicity, place of death, and geographic location.
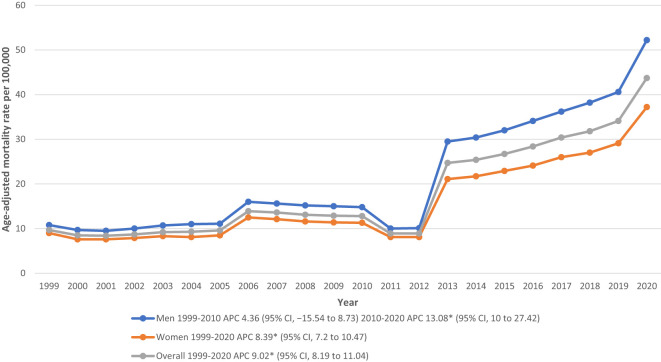
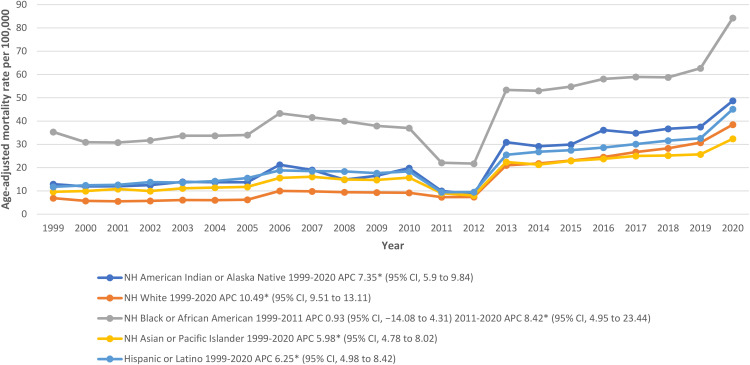
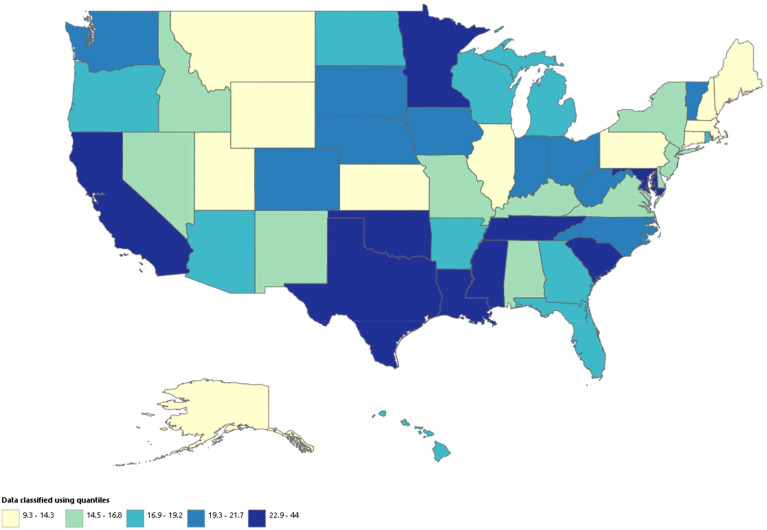
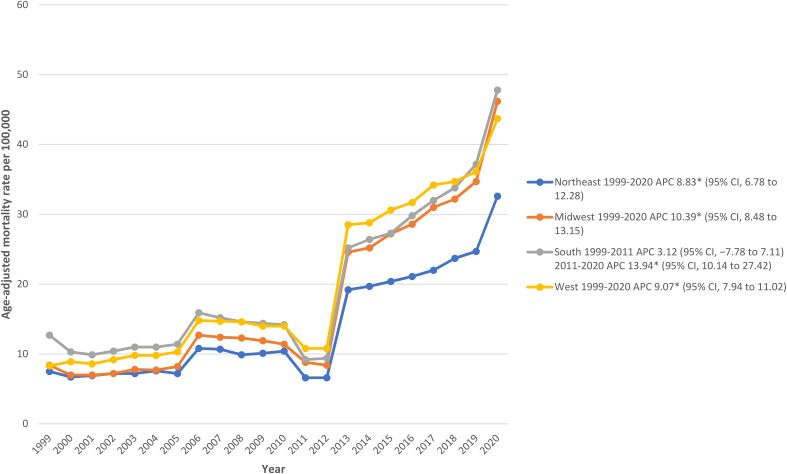
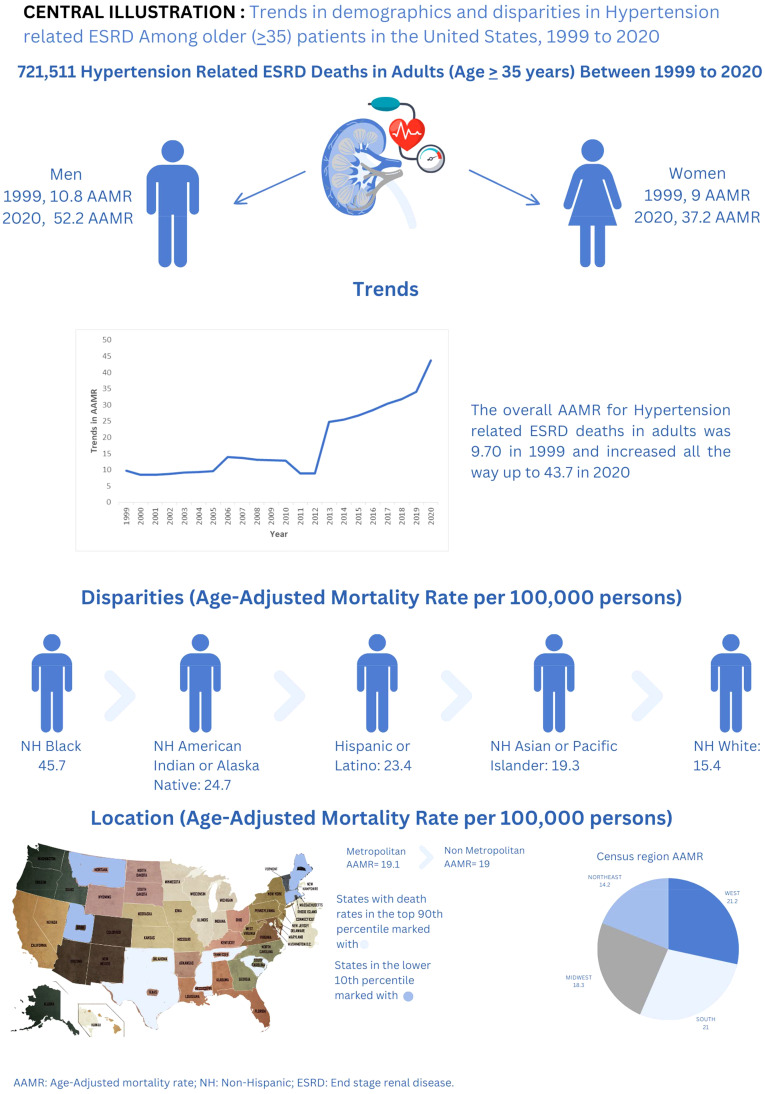
Results: Hypertension-related ESRD caused a total of 721,511 deaths among adults (aged ≥ 35 years) between 1999 and 2020. The overall AAMR for hypertension related ESRD deaths in adults was 9.70 in 1999 and increased all the way up to 43.7 in 2020 (APC: 9.02; 95% CI: 8.19-11.04). Men had consistently higher AAMRs than woman during the analyzed years from 1999 (AAMR men: 10.8 vs women: 9) to 2020 (AAMR men: 52.2 vs women: 37.2). Overall AAMRs were highest in Non-Hispanic (NH) Black or African American patients (45.7), followed by NH American Indian or Alaska Natives (24.7), Hispanic or Latinos (23.4), NH Asian or Pacific Islanders (19.3), and NH White patients (15.4). Region-wise analysis also showed significant variations in AAMRs (overall AAMR: West 21.2; South: 21; Midwest: 18.3; Northeast: 14.2). Metropolitan areas had slightly higher AAMRs (19.1) than nonmetropolitan areas (19). States with AAMRs in 90th percentile: District of Columbia, Oklahoma, Mississippi, Tennessee, Texas, and South Carolina, had roughly double rates compared to states in 10th percentile.
Conclusions: Overall hypertension related ESRD AAMRs among adults were seen to increase in almost all stratified data. The groups associated with the highest death rates were NH Black or African Americans, men, and populations in the West and metropolitan areas of the United States. Strategies and policies targeting these at-risk groups are required to control the rising hypertension related ESRD mortality.
Keywords: end-stage renal disease; hypertension; mortality; renal failure; renovascular hypertension.
Copyright © 2024 Raja, Raja, Amin, Salman, Azeem and Kumar.
Conflict of interest statement
The authors declare that the research was conducted in the absence of any commercial or financial relationships that could be construed as a potential conflict of interest.
Figures
Similar articles
-
Trends in Heart Failure-Related Mortality Among Older Adults in the United States From 1999-2019.JACC Heart Fail. 2022 Nov;10(11):851-859. doi: 10.1016/j.jchf.2022.06.012. Epub 2022 Sep 7. JACC Heart Fail. 2022. PMID: 36328654
-
The hidden epidemic: Hypertension-related mortality surges amongst younger adults in the United States.Curr Probl Cardiol. 2024 Dec;49(12):102842. doi: 10.1016/j.cpcardiol.2024.102842. Epub 2024 Sep 12. Curr Probl Cardiol. 2024. PMID: 39270766 Review.
-
Trends and regional variations in chronic ischemic heart disease and lung cancer-related mortality among American adults: Insights from retrospective CDC wonder analysis.Int J Cardiol Cardiovasc Risk Prev. 2025 Feb 14;24:200377. doi: 10.1016/j.ijcrp.2025.200377. eCollection 2025 Mar. Int J Cardiol Cardiovasc Risk Prev. 2025. PMID: 40034236 Free PMC article.
-
Disparities in epilepsy-associated mortality trends in the United States of America over two decades.J Clin Neurosci. 2025 Aug;138:111396. doi: 10.1016/j.jocn.2025.111396. Epub 2025 Jun 17. J Clin Neurosci. 2025. PMID: 40532282
-
Investigating sex, race, and geographic disparities in bronchus and lung cancer mortality in the United States: a comprehensive longitudinal study (1999-2020) utilizing CDC WONDER data.Ann Med Surg (Lond). 2024 Aug 7;86(9):5361-5369. doi: 10.1097/MS9.0000000000002387. eCollection 2024 Sep. Ann Med Surg (Lond). 2024. PMID: 39238989 Free PMC article. Review.
Cited by
-
Trends and Disparities in Hemorrhagic Stroke and Hypertension-Related Mortality in the United States From 1999 to 2023: A CDC WONDER Database Analysis.Brain Behav. 2025 Jul;15(7):e70704. doi: 10.1002/brb3.70704. Brain Behav. 2025. PMID: 40686020 Free PMC article.
-
Racial Disparities in Hypertension-Related Hospital Mortality Among Adults in the United States.Cureus. 2025 Mar 23;17(3):e81043. doi: 10.7759/cureus.81043. eCollection 2025 Mar. Cureus. 2025. PMID: 40264630 Free PMC article.
-
A meta-analytic review of the safety and efficacy of semaglutide in type 2 diabetes mellitus and chronic kidney disease patients.Ann Med Surg (Lond). 2025 Mar 27;87(4):2278-2285. doi: 10.1097/MS9.0000000000003126. eCollection 2025 Apr. Ann Med Surg (Lond). 2025. PMID: 40212218 Free PMC article.
References
-
- Hypertensive Kidney Disease - an overview | ScienceDirect Topics (2023). Available at: https://www.sciencedirect.com/topics/medicine-and-dentistry/hypertensive....
-
- Stompór T, Perkowska-Ptasinska A. Hypertensive kidney disease: a true epidemic or rare disease? Pol Arch Intern Med (2020) 130(2):130–9. - PubMed
-
- Hypertension induced by drugs and other substances (2023). - PubMed
LinkOut - more resources
Full Text Sources