. 2024 Jan 30:13:e79714.
doi: 10.7554/eLife.79714.

Stable population structure in Europe since the Iron Age, despite high mobility

Margaret L Antonio #  1 Clemens L Weiß #  2 Ziyue Gao #  3 Susanna Sawyer #  4   5 Victoria Oberreiter  4   5 Hannah M Moots  6   7 Jeffrey P Spence  2 Olivia Cheronet  4   5 Brina Zagorc  4   5 Elisa Praxmarer  4 Kadir Toykan Özdoğan  8 Lea Demetz  4 Pere Gelabert  4 Daniel Fernandes  4   5   9 Michaela Lucci  10 Timka Alihodžić  11 Selma Amrani  12 Pavel Avetisyan  13 Christèle Baillif-Ducros  14 Željka Bedić  15 Audrey Bertrand  16 Maja Bilić  17 Luca Bondioli  18 Paulina Borówka  19 Emmanuel Botte  20 Josip Burmaz  21 Domagoj Bužanić  22 Francesca Candilio  23 Mirna Cvetko  22 Daniela De Angelis  24 Ivan Drnić  25 Kristián Elschek  26 Mounir Fantar  27 Andrej Gaspari  28 Gabriella Gasperetti  29 Francesco Genchi  30 Snežana Golubović  31 Zuzana Hukeľová  26 Rimantas Jankauskas  32 Kristina Jelinčić Vučković  33 Gordana Jeremić  31 Iva Kaić  22 Kevin Kazek  34 Hamazasp Khachatryan  35 Anahit Khudaverdyan  36 Sylvia Kirchengast  4 Miomir Korać  31 Valérie Kozlowski  37 Mária Krošláková  26 Dora Kušan Špalj  25 Francesco La Pastina  38 Marie Laguardia  39 Sandra Legrand  37 Tino Leleković  40 Tamara Leskovar  28 Wiesław Lorkiewicz  19 Dženi Los  21 Ana Maria Silva  9   41   42 Rene Masaryk  43 Vinka Matijević  22 Yahia Mehdi Seddik Cherifi  4   44   45 Nicolas Meyer  46 Ilija Mikić  31 Nataša Miladinović-Radmilović  31 Branka Milošević Zakić  47 Lina Nacouzi  48 Magdalena Natuniewicz-Sekuła  49 Alessia Nava  50 Christine Neugebauer-Maresch  51   52 Jan Nováček  53   54 Anna Osterholtz  55 Julianne Paige  56 Lujana Paraman  57 Dominique Pieri  58 Karol Pieta  26 Stefan Pop-Lazić  31 Matej Ruttkay  26 Mirjana Sanader  22 Arkadiusz Sołtysiak  59 Alessandra Sperduti  23   60 Tijana Stankovic Pesterac  61 Maria Teschler-Nicola  4   62 Iwona Teul  63 Domagoj Tončinić  22 Julien Trapp  64 Dragana Vulović  31 Tomasz Waliszewski  59 Diethard Walter  53 Miloš Živanović  65 Mohamed El Mostefa Filah  66 Morana Čaušević-Bully  67 Mario Šlaus  68 Dušan Borić  38   69 Mario Novak  15 Alfredo Coppa  4   38   70 Ron Pinhasi  4   5 Jonathan K Pritchard  2   71
Affiliations

Stable population structure in Europe since the Iron Age, despite high mobility

Margaret L Antonio et al. Elife. .

Abstract

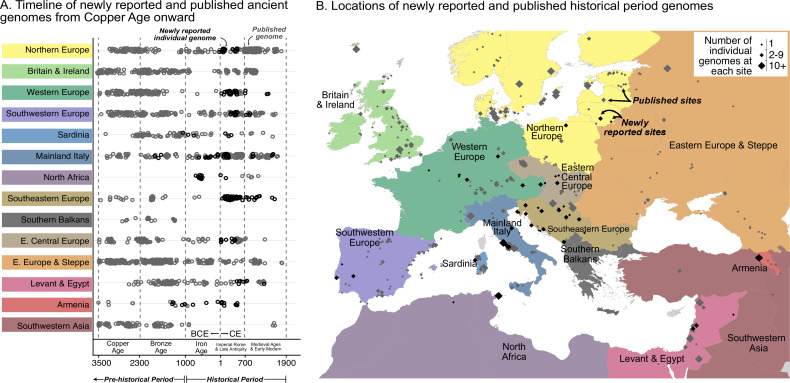
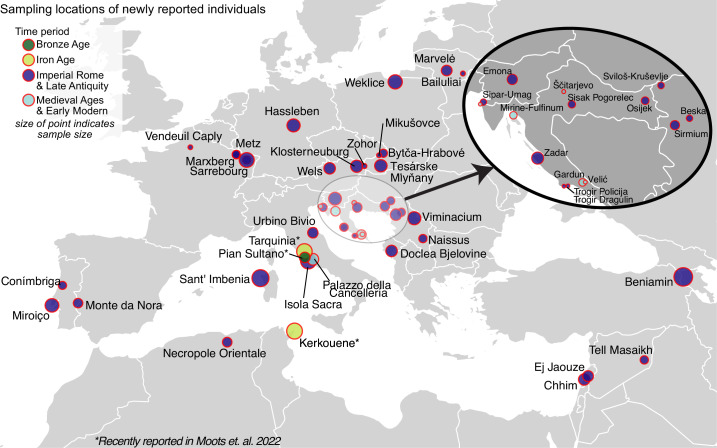
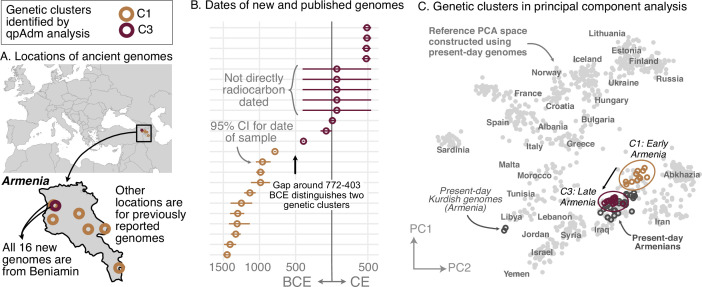
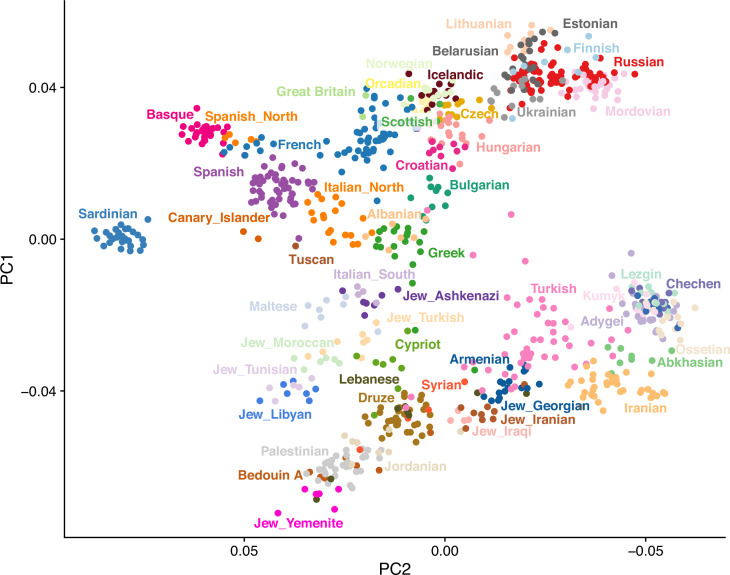
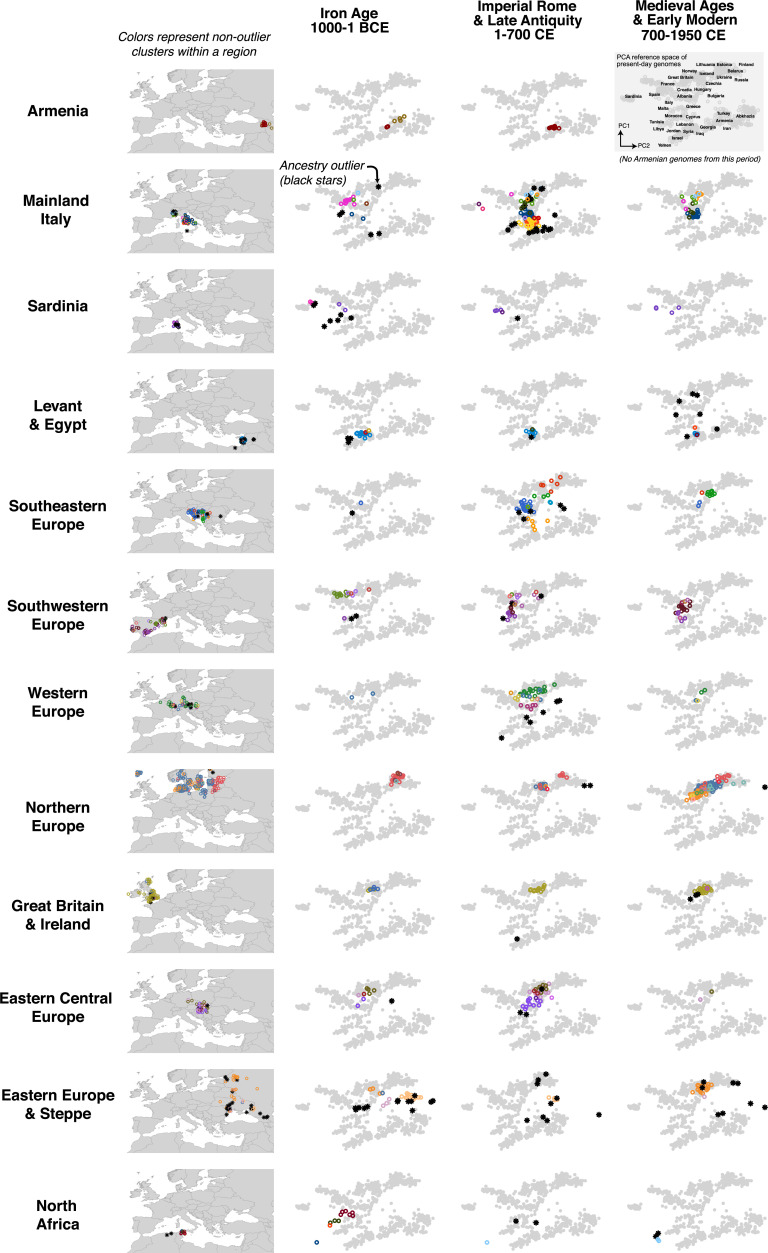
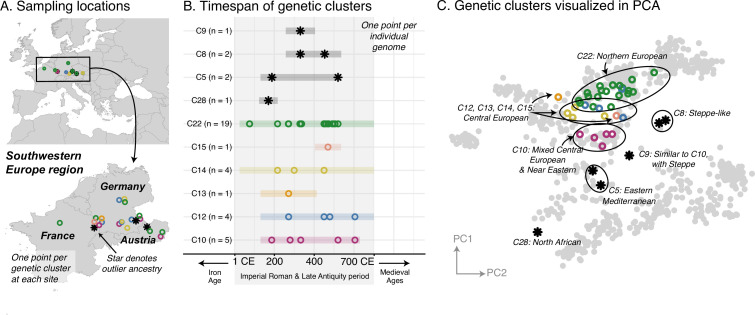
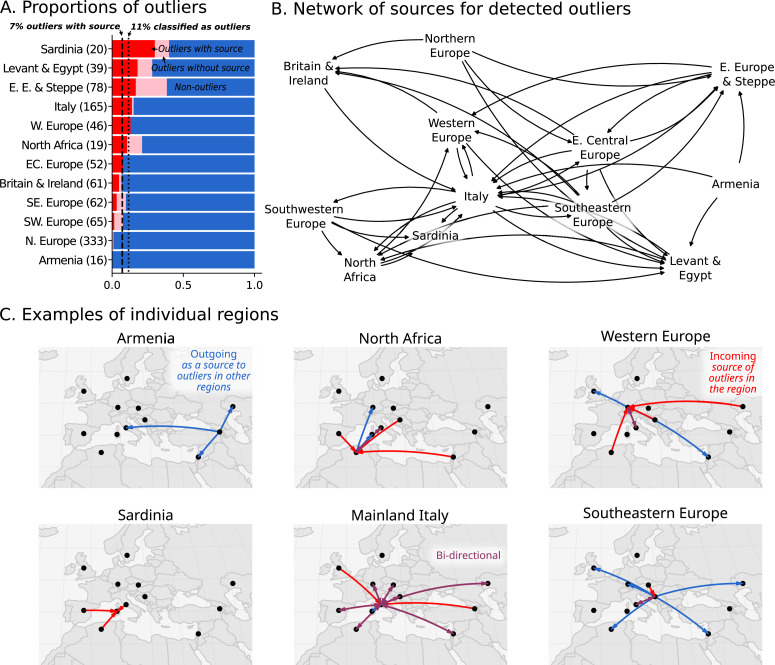
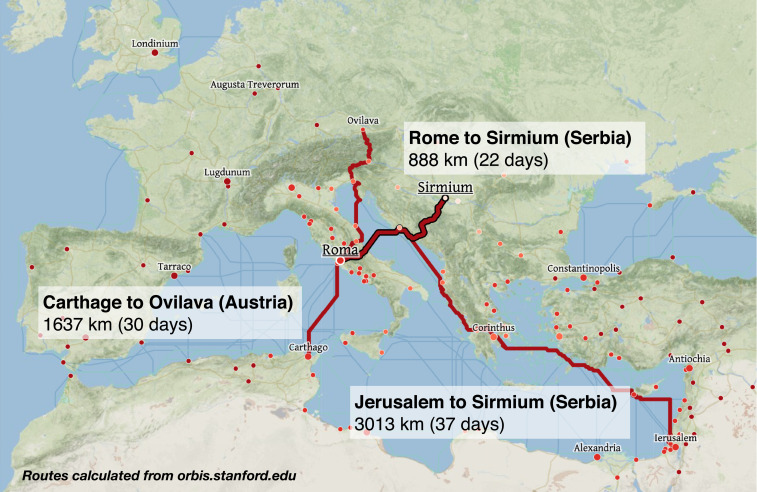
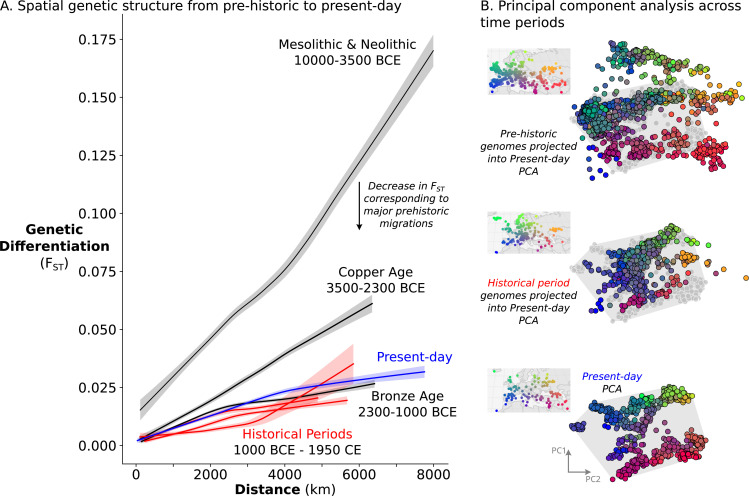
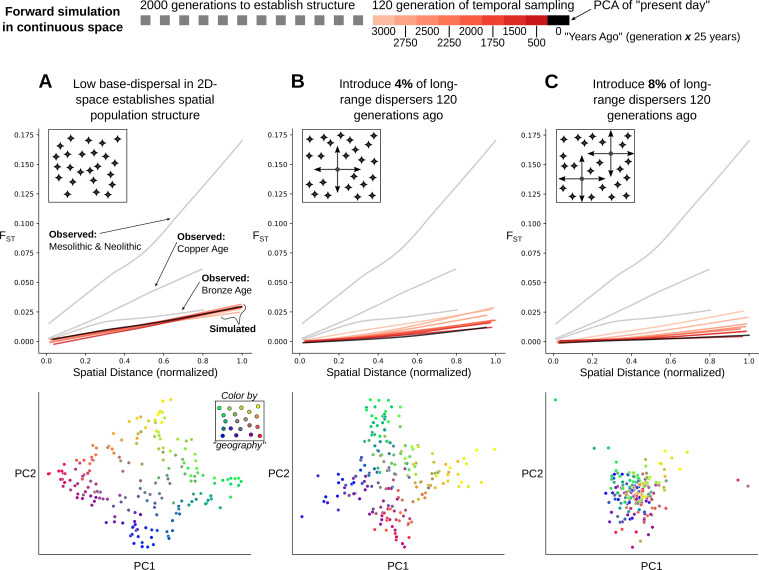
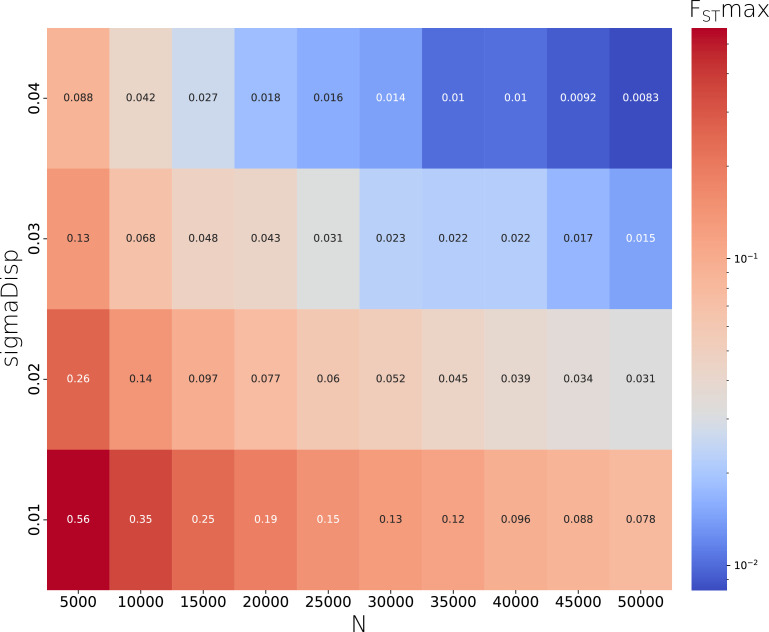
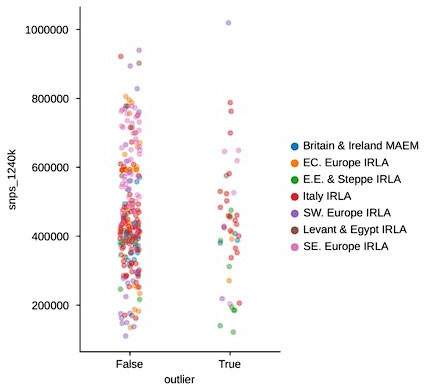
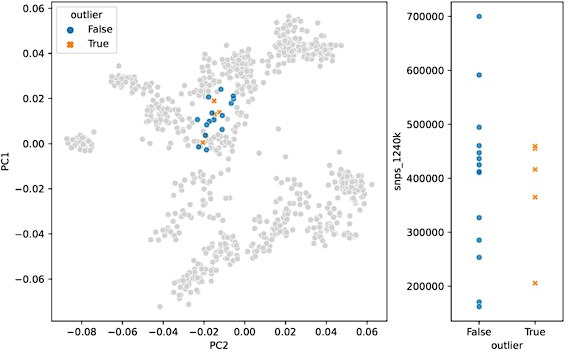
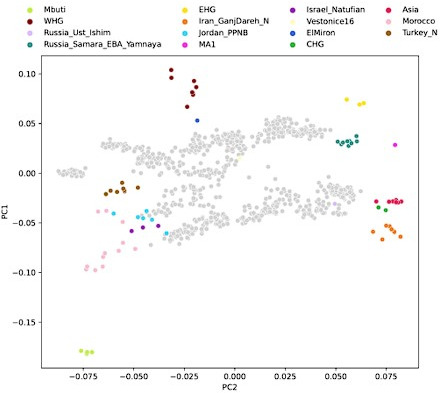
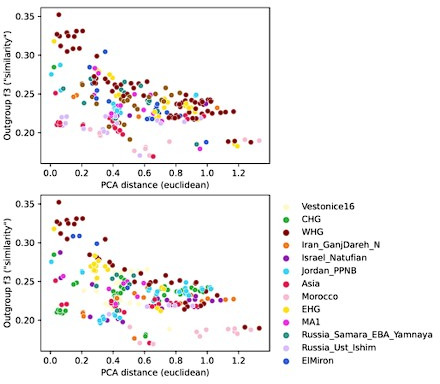
Ancient DNA research in the past decade has revealed that European population structure changed dramatically in the prehistoric period (14,000-3000 years before present, YBP), reflecting the widespread introduction of Neolithic farmer and Bronze Age Steppe ancestries. However, little is known about how population structure changed from the historical period onward (3000 YBP - present). To address this, we collected whole genomes from 204 individuals from Europe and the Mediterranean, many of which are the first historical period genomes from their region (e.g. Armenia and France). We found that most regions show remarkable inter-individual heterogeneity. At least 7% of historical individuals carry ancestry uncommon in the region where they were sampled, some indicating cross-Mediterranean contacts. Despite this high level of mobility, overall population structure across western Eurasia is relatively stable through the historical period up to the present, mirroring geography. We show that, under standard population genetics models with local panmixia, the observed level of dispersal would lead to a collapse of population structure. Persistent population structure thus suggests a lower effective migration rate than indicated by the observed dispersal. We hypothesize that this phenomenon can be explained by extensive transient dispersal arising from drastically improved transportation networks and the Roman Empire's mobilization of people for trade, labor, and military. This work highlights the utility of ancient DNA in elucidating finer scale human population dynamics in recent history.

Keywords: Roman Empire; ancient DNA; evolutionary biology; genetics; genomics; human; population structure.


Conflict of interest statement

MA, CW, SS, VO, HM, JS, OC, BZ, EP, KÖ, LD, PG, DF, ML, TA, SA, PA, CB, ŽB, AB, LB, PB, EB, DB, FC, MC, DD, ID, KE, MF, AG, GG, FG, SG, ZH, RJ, KV, GJ, IK, KK, HK, AK, SK, MK, VK, MK, DK, FL, ML, SL, TL, TL, WL, AS, VM, YC, NM, IM, NM, BM, LN, MN, AN, CN, JN, AO, JP, LP, DP, KP, SP, MR, MS, AS, AS, TS, MT, IT, DT, JT, DV, TW, DW, MŽ, MF, MČ, MŠ, DB, MN, AC, RP, JP No competing interests declared, ZG Reviewing editor, eLife, MB Affiliated with Palisada Ltd. The author has no financial interests to declare, JB, DL Affiliated with Kaducej Ltd. The author has no financial interests to declare, RM Affiliated with Skupina STIK. The author has no financial interests to declare

Figures

Figure 1.
Figure 1.. Timeline of new and published genomes.
(A) 204 newly reported genomes (black circles) are shown alongside published genomes (gray circles), ordered by time and region (colored the same way as in B). (B) Sampling locations of newly reported (black) and published (gray) genomes are indicated by diamonds, sized according to the number of genomes at each location.
Figure 1—figure supplement 1.
Figure 1—figure supplement 1.. Detailed map of locations for newly reported samples.
Each circle represents a location, the size of the circle corresponds to the number of individuals sampled from that location. Circles are colored by their time period: Bronze Age is green (Pian Sultano), Iron Age is yellow (two recently reported sites Tarquinia and Kerkouane), Imperial Rome and Late Antiquity is dark blue, Medieval Ages and Early Modern are light blue (Palazzo della Cancelleria, Velić, Gardun, Mirine-Fulfinum). Note that the Bronze Age and Iron Age sites were recently reported in Moots et al., 2022.
Figure 2.
Figure 2.. Armenia: two homogeneous genetic clusters distinguished by a temporal shift.
(A) Sampling locations of ancient genomes (open circles) colored by their genetic cluster identified using qpAdm modeling. (B) Date ranges for the genomes: each line represents the 95% confidence interval for the radiocarbon date or the upper and lower limit of the inferred date, and the point represents the midpoint of that range. (C) Projections of the genomes onto a PCA of present-day genomes (gray points labeled by their population). Present-day genomes from Armenia are shown with dark gray open circles.
Figure 2—figure supplement 1.
Figure 2—figure supplement 1.. Principal component analysis of present-day genomes from Europe and the Mediterranean.
PCA was performed on 829 individuals (480,712 snps) using smartpca v1600. The following parameters were used: 5 outlier iterations (numoutlieriter), 10 principal components along which to remove outliers (numoutlierevec), altnormstyle set to NO, with least squares projection turned on (lsqproject set to YES).
Figure 2—figure supplement 2.
Figure 2—figure supplement 2.. Ancestry clusters identified within regions.
Each row displays data from a single study region. The first column shows a map with the sampling locations for the individuals, while columns two through four show the individuals projected onto a PCA space of present-day genomes (gray points) (populations are labeled in the far right panel in row 1 and in Figure 2—figure supplement 1). Individual ancient genomes in the map and PCA panels are colored by ancestry clusters identified using qpAdm. Colors are not matched across regions. Star points are putative outliers, that is individuals with ancestry that is underrepresented in the region. They are not colored by ancestry clusters so as to reduce visual clutter.
Figure 2—figure supplement 3.
Figure 2—figure supplement 3.. SNP coverage comparison across cluster sizes and downstream outlier status.
(left) No significant correlation was detected between the median number of SNPs covered across the individuals in a cluster and cluster size. (right) There also was no significant difference in the number of SNPs covered between outlier and non-outlier clusters.
Figure 3.
Figure 3.. Southeastern Europe: highly heterogeneous Imperial Roman and Late Antiquity period population.
(A) Sampling locations of genetic clusters are represented by a single point per location. Outlier ancestries are black stars, all others are open circles colored by genetic cluster. (B) Colored bars span the minimum and maximum of the date ranges of samples (95% confidence interval from radiocarbon dating or archaeological range). Points are the mean of an individual’s date range. (C) Projections of the ancient genomes onto a PCA of present-day genomes (gray points). Population labels for the PCA reference space are shown in Figure 2C. Present-day genomes from Southeastern Europe are shown with dark gray open circles.
Figure 3—figure supplement 1.
Figure 3—figure supplement 1.. Population structure of Italy during the Imperial Roman and Late Antiquity period.
Ancient Italian genomes (colored points) from the Imperial Roman and Late Antiquity period were projected onto principal components of present-day genomes (gray points, populations labeled in Figure 2—figure supplement 1). Present-day Italian genomes are highlighted by a gray filled ellipse. Star points are outliers and circle points are non-outliers. Outlier clusters that can be modeled using contemporaneous populations are labeled with the potential source region.
Figure 4.
Figure 4.. Western Europe: heterogeneous Imperial Roman and Late Antiquity period population.
(A) Sampling locations of genetic clusters are represented by a single point per location. Outlier ancestries are black stars, all others are open circles colored by genetic cluster. (B) Colored bars span the minimum and maximum of the date ranges of samples (95% confidence interval from radiocarbon dating or archaeological range). Points are the mean of an individual’s date range. (C) Projections of the ancient genomes onto a PCA of present-day genomes (gray points). Population labels for the PCA reference space are shown in Figure 2C. Present-day genomes from Southeastern Europe are shown with dark gray open circles.
Figure 5.
Figure 5.. Ancestry outliers and their potential sources.
(A) The proportions of outliers in each region were determined by individual pairwise qpAdm modeling followed by clustering. (B) Sources were inferred by one component qpAdm modeling of resulting clusters with all genetic clusters in the dataset. In the network visualizations, nodes are regions and directed edges are drawn from sources to outliers (i.e. potential migrants). The full network of source to outlier is shown. (C) Examples of individual regions are shown in greater detail.
Figure 5—figure supplement 1.
Figure 5—figure supplement 1.. Lack of sex-bias amongst outliers with valid qpAdm sources.
The proportions of males and females do not differ significantly between outlier and non-outlier groups (p=0.4117). When outliers (with and without source) are treated as one group, there is still no significant association with outlier status and sex (p=0.633).
Figure 5—figure supplement 2.
Figure 5—figure supplement 2.. Distances of outliers to their candidate sources.
Geographic distance between the sampling locations of ‘outlier with source’ and the location of their putative source was calculated for each outlier. The mean distance was calculated if there were multiple putative sources.
Figure 5—figure supplement 3.
Figure 5—figure supplement 3.. Example routes and travel times across the Roman Empire.
Routes and travel times were approximated using orbis.stanford.edu, a geospatial network model of the Roman Empire. Routes shown are the fastest routes during Summer for civilians, utilizing road, river, coastal sea, and open sea, and by foot if on road. Routes for military individuals (not shown) are marginally faster.
Figure 6.
Figure 6.. Relatively stable population structure from Bronze Age to present-day.
(A) Overall genetic differentiation between populations (measured by FST) and its relationship to geographical distance (spatial structure) is similar from Bronze Age onward. Confidence intervals were calculated through a bootstrap procedure, using 200 bootstrap replicates. (B) In PC space, each genome is represented by a point, colored based on their origin (for present-day individuals) or sampling location (for historical samples). The PC space is established by present-day samples (bottom), onto which either historical period (middle) or prehistoric genomes (top) were projected. For projections, the present-day samples are shown in gray, and their extent is visualized by a gray polygon.
Figure 7.
Figure 7.. Simulation of population structure with and without long-range dispersal.
(A) A base model of spatial structure is established by calibrating per-generation dispersal rate to generate a maximum FST of ~0.03 across the maximal spatial distance, and visualized using PCA. In addition to this base dispersal, either 4% (B) or 8% (C) of individuals disperse longer distances, and the effect is tracked by analyzing spatial FST through time, as well as PCA after 120 generations of long-range dispersal.
Figure 7—figure supplement 1.
Figure 7—figure supplement 1.. A sigmaDisp - N parameter pair was chosen to closely approximate the observed FSTmax of ~0.03 using grid search across a range of parameter pairs.
We used the pair N=50,000 & sigmaDisp = 0.02 for all other simulations we report.
Figure 7—figure supplement 2.
Figure 7—figure supplement 2.. A sigmaDispLR parameter was chosen to qualitatively resemble long-range dispersal distances observed in the data, by comparing the distribution of distances under long-range dispersal (outliers) to randomly chosen distances given the spatial distribution of samples.
We used a value of 0.20 for all other simulations we report.
Appendix 1—figure 1.
Appendix 1—figure 1.. Armenia.
Appendix 1—figure 2.
Appendix 1—figure 2.. Mainland Italy.
Appendix 1—figure 3.
Appendix 1—figure 3.. Sardinia.
Appendix 1—figure 4.
Appendix 1—figure 4.. Levant & Egypt.
Appendix 1—figure 5.
Appendix 1—figure 5.. Southeastern Europe.
Appendix 1—figure 6.
Appendix 1—figure 6.. Southwestern Europe.
Appendix 1—figure 7.
Appendix 1—figure 7.. Western Europe.
Appendix 1—figure 8.
Appendix 1—figure 8.. Northern Europe.
Appendix 1—figure 9.
Appendix 1—figure 9.. Great Britain & Ireland.
Appendix 1—figure 10.
Appendix 1—figure 10.. Eastern Central Europe.
Appendix 1—figure 11.
Appendix 1—figure 11.. Eastern Europe & Steppe.
Appendix 1—figure 12.
Appendix 1—figure 12.. North Africa.
Author response image 1.
Author response image 1.. SNP coverage comparison between outliers and non-outliers in region-period pairings with “surprising” outliers (t-test p-value: 0.
242).
Author response image 2.
Author response image 2.. PCA projection (left) and SNP coverage comparison (right) for “surprising” outliers and surrounding non-outliers in Italy_IRLA.
Author response image 3.
Author response image 3.. Projection of qpAdm reference population individuals into present-day PCA.
Author response image 4.
Author response image 4.. Comparison of pairwise PCA projection distance to outgroup-f3 similarity across all qpAdm reference population individuals.
PCA projection distance was calculated as the euclidean distance on the first two principal components. Outgroup-f3 statistics were calculated relative to Mbuti, which is itself also a qpAdm reference population. Both panels show the same data, but each point is colored by either of the two reference populations involved in the pairwise comparison.
Author response image 5.
Author response image 5.. Comparing geographic distance to PCA distance between pairs of historical and pre-historical individuals matched by geographic space.
For each historical period individual we selected the closest pre-historical individual by geographic distance in an effort to match the distributions of pairwise geographic distance across the two time periods (left). For these distributions of individuals matched by geographic distance, we then queried the euclidean distance between their projection locations in the first two principal components (right).

Update of

  • doi: 10.1101/2022.05.15.491973

References

    1. Abulafia D. The Great Sea: A Human History of the Mediterranean. Oxford University Press; 2011. - DOI
    1. Agranat-Tamir L, Waldman S, Martin MAS, Gokhman D, Mishol N, Eshel T, Cheronet O, Rohland N, Mallick S, Adamski N, Lawson AM, Mah M, Michel M, Oppenheimer J, Stewardson K, Candilio F, Keating D, Gamarra B, Tzur S, Novak M, Kalisher R, Bechar S, Eshed V, Kennett DJ, Faerman M, Yahalom-Mack N, Monge JM, Govrin Y, Erel Y, Yakir B, Pinhasi R, Carmi S, Finkelstein I, Carmel L, Reich D. The genomic history of the bronze age southern levant. Cell. 2020;181:1146–1157. doi: 10.1016/j.cell.2020.04.024. - DOI - PMC - PubMed
    1. Allen Ancient DNA Resource Allen ancient DNA resource (AADR): downloadable genotypes of present-day and ancient DNA data. 2021. [May 24, 2021]. https://reich.hms.harvard.edu/allen-ancient-dna-resource-aadr-downloadab...
    1. Allentoft ME, Sikora M, Sjögren KG, Rasmussen S, Rasmussen M, Stenderup J, Damgaard PB, Schroeder H, Ahlström T, Vinner L, Malaspinas AS, Margaryan A, Higham T, Chivall D, Lynnerup N, Harvig L, Baron J, Della Casa P, Dąbrowski P, Duffy PR, Ebel AV, Epimakhov A, Frei K, Furmanek M, Gralak T, Gromov A, Gronkiewicz S, Grupe G, Hajdu T, Jarysz R, Khartanovich V, Khokhlov A, Kiss V, Kolář J, Kriiska A, Lasak I, Longhi C, McGlynn G, Merkevicius A, Merkyte I, Metspalu M, Mkrtchyan R, Moiseyev V, Paja L, Pálfi G, Pokutta D, Pospieszny Ł, Price TD, Saag L, Sablin M, Shishlina N, Smrčka V, Soenov VI, Szeverényi V, Tóth G, Trifanova SV, Varul L, Vicze M, Yepiskoposyan L, Zhitenev V, Orlando L, Sicheritz-Pontén T, Brunak S, Nielsen R, Kristiansen K, Willerslev E. Population genomics of bronze age Eurasia. Nature. 2015;522:167–172. doi: 10.1038/nature14507. - DOI - PubMed
    1. Alpaslan-Roodenberg S, Anthony D, Babiker H, Bánffy E, Booth T, Capone P, Deshpande-Mukherjee A, Eisenmann S, Fehren-Schmitz L, Frachetti M, Fujita R, Frieman CJ, Fu Q, Gibbon V, Haak W, Hajdinjak M, Hofmann KP, Holguin B, Inomata T, Kanzawa-Kiriyama H, Keegan W, Kelso J, Krause J, Kumaresan G, Kusimba C, Kusimba S, Lalueza-Fox C, Llamas B, MacEachern S, Mallick S, Matsumura H, Morales-Arce AY, Matuzeviciute GM, Mushrif-Tripathy V, Nakatsuka N, Nores R, Ogola C, Okumura M, Patterson N, Pinhasi R, Prasad SPR, Prendergast ME, Punzo JL, Reich D, Sawafuji R, Sawchuk E, Schiffels S, Sedig J, Shnaider S, Sirak K, Skoglund P, Slon V, Snow M, Soressi M, Spriggs M, Stockhammer PW, Szécsényi-Nagy A, Thangaraj K, Tiesler V, Tobler R, Wang CC, Warinner C, Yasawardene S, Zahir M. Ethics of DNA research on human remains: five globally applicable guidelines. Nature. 2021;599:41–46. doi: 10.1038/s41586-021-04008-x. - DOI - PMC - PubMed