

Population pharmacokinetics and humanized dosage regimens matching the peak, area, trough, and range of amikacin plasma concentrations in immune-competent murine bloodstream and lung infection models
- PMID: 38289076
- PMCID: PMC10916399
- DOI: 10.1128/aac.01394-23
Population pharmacokinetics and humanized dosage regimens matching the peak, area, trough, and range of amikacin plasma concentrations in immune-competent murine bloodstream and lung infection models
Abstract
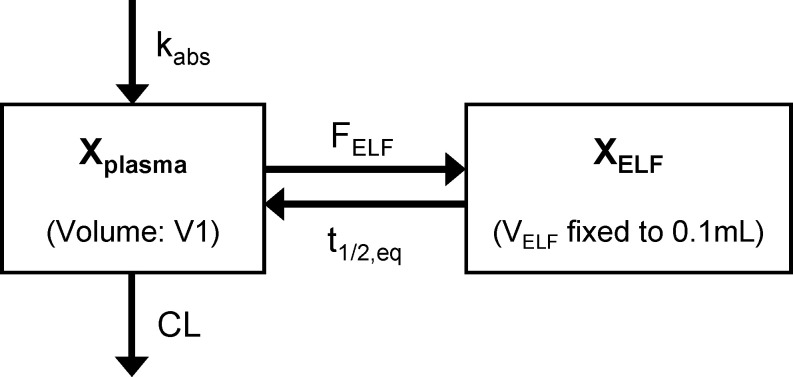
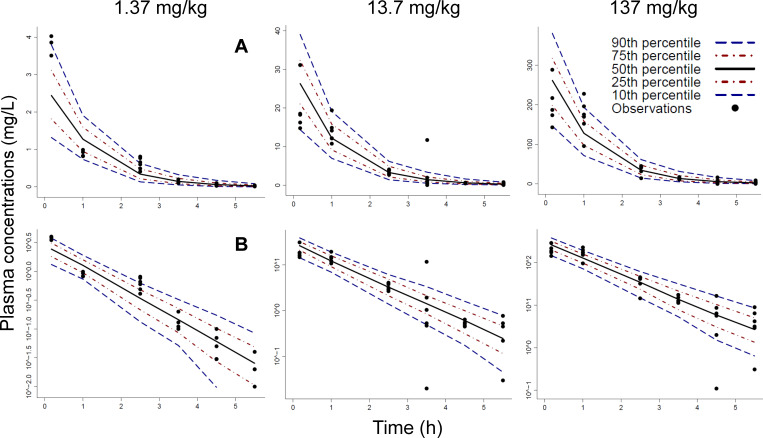
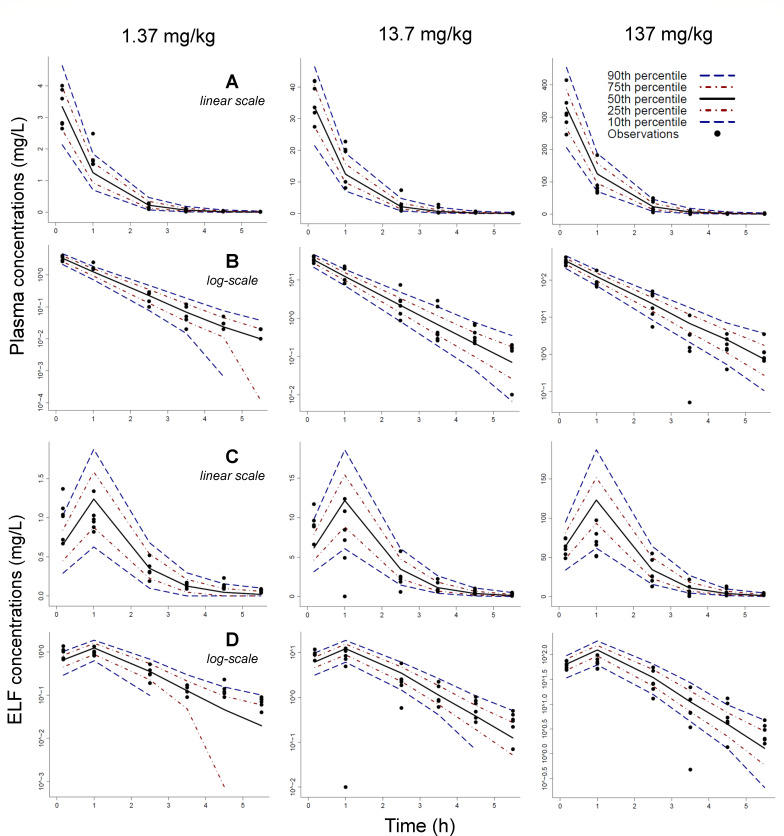
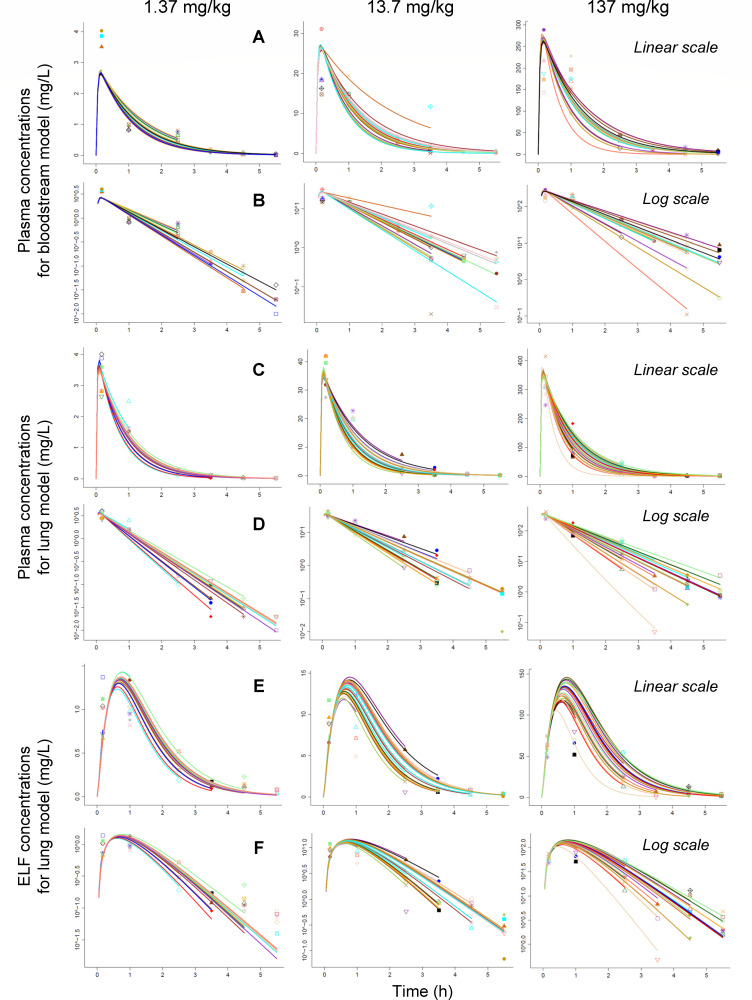
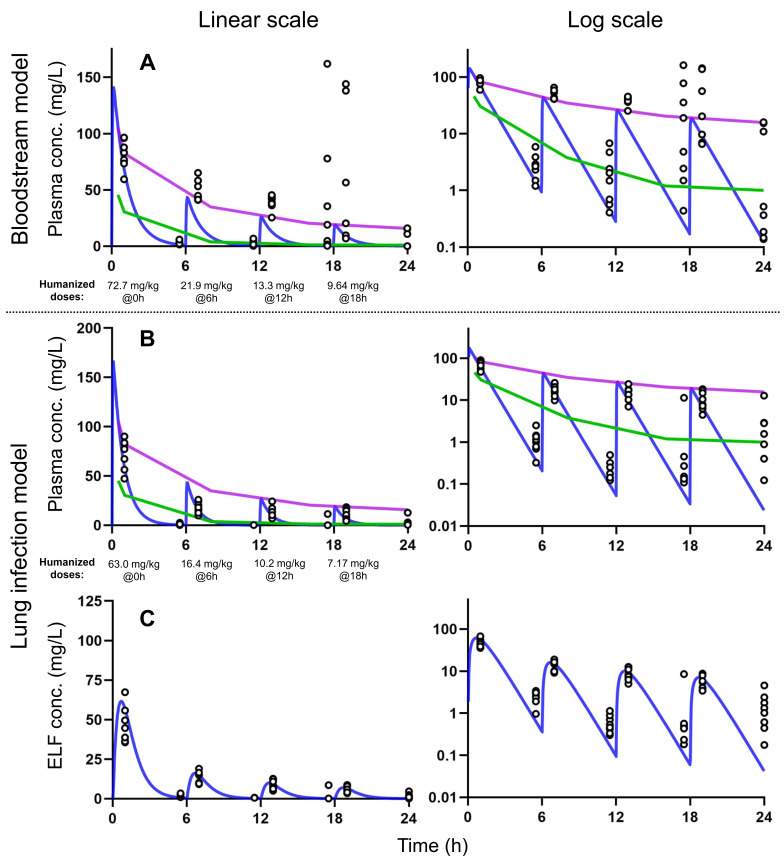
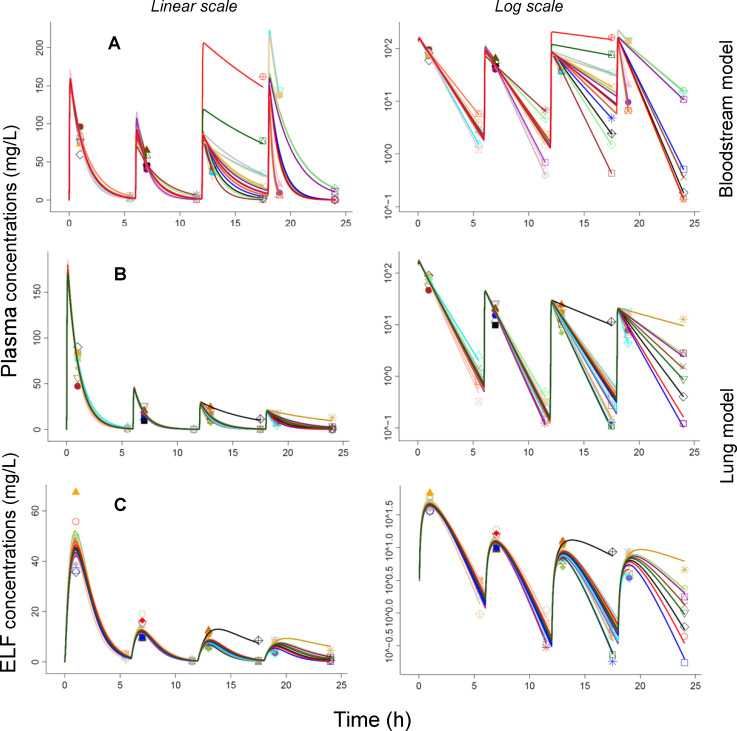
Amikacin is an FDA-approved aminoglycoside antibiotic that is commonly used. However, validated dosage regimens that achieve clinically relevant exposure profiles in mice are lacking. We aimed to design and validate humanized dosage regimens for amikacin in immune-competent murine bloodstream and lung infection models of Acinetobacter baumannii. Plasma and lung epithelial lining fluid (ELF) concentrations after single subcutaneous doses of 1.37, 13.7, and 137 mg/kg of body weight were simultaneously modeled via population pharmacokinetics. Then, humanized amikacin dosage regimens in mice were designed and prospectively validated to match the peak, area, trough, and range of plasma concentration profiles in critically ill patients (clinical dose: 25-30 mg/kg of body weight). The pharmacokinetics of amikacin were linear, with a clearance of 9.93 mL/h in both infection models after a single dose. However, the volume of distribution differed between models, resulting in an elimination half-life of 48 min for the bloodstream and 36 min for the lung model. The drug exposure in ELF was 72.7% compared to that in plasma. After multiple q6h dosing, clearance decreased by ~80% from the first (7.35 mL/h) to the last two dosing intervals (~1.50 mL/h) in the bloodstream model. Likewise, clearance decreased by 41% from 7.44 to 4.39 mL/h in the lung model. The humanized dosage regimens were 117 mg/kg of body weight/day in mice [administered in four fractions 6 h apart (q6h): 61.9%, 18.6%, 11.3%, and 8.21% of total dose] for the bloodstream and 96.7 mg/kg of body weight/day (given q6h as 65.1%, 16.9%, 10.5%, and 7.41%) for the lung model. These validated humanized dosage regimens and population pharmacokinetic models support translational studies with clinically relevant amikacin exposure profiles.
Keywords: S-ADAPT; amikacin; aminoglycoside; bloodstream infection; lung epithelial lining fluid; lung infection; model-based humanized dosage regimen design; mouse/mice; murine infection model; population pharmacokinetics.
Conflict of interest statement
The authors declare no conflict of interest.
Figures
Similar articles
-
Individual Components of Polymyxin B Modeled via Population Pharmacokinetics to Design Humanized Dosage Regimens for a Bloodstream and Lung Infection Model in Immune-Competent Mice.Antimicrob Agents Chemother. 2023 May 17;67(5):e0019723. doi: 10.1128/aac.00197-23. Epub 2023 Apr 6. Antimicrob Agents Chemother. 2023. PMID: 37022153 Free PMC article.
-
Development of Modernized Acinetobacter baumannii Susceptibility Test Interpretive Criteria for Recommended Antimicrobial Agents Using Pharmacometric Approaches.Antimicrob Agents Chemother. 2023 Apr 18;67(4):e0145222. doi: 10.1128/aac.01452-22. Epub 2023 Mar 22. Antimicrob Agents Chemother. 2023. PMID: 36946729 Free PMC article.
-
Pharmacokinetics and urinary excretion of amikacin in low-clearance unilamellar liposomes after a single or repeated intravenous administration in the rhesus monkey.Antimicrob Agents Chemother. 1999 Mar;43(3):503-9. doi: 10.1128/AAC.43.3.503. Antimicrob Agents Chemother. 1999. PMID: 10049258 Free PMC article.
-
Amikacin in Critically Ill Patients: A Review of Population Pharmacokinetic Studies.Clin Pharmacokinet. 2017 Feb;56(2):127-138. doi: 10.1007/s40262-016-0428-x. Clin Pharmacokinet. 2017. PMID: 27324191 Review.
-
Lopinavir/ritonavir: a review of its use in the management of HIV infection.Drugs. 2003;63(8):769-802. doi: 10.2165/00003495-200363080-00004. Drugs. 2003. PMID: 12662125 Review.
References
Publication types
MeSH terms
Substances
Grants and funding
LinkOut - more resources
Full Text Sources
Medical
