

Transcriptional heterogeneity of catabolic genes on the plasmid pCAR1 causes host-specific carbazole degradation
- PMID: 38289097
- PMCID: PMC10880608
- DOI: 10.1128/aem.01247-23
Transcriptional heterogeneity of catabolic genes on the plasmid pCAR1 causes host-specific carbazole degradation
Abstract
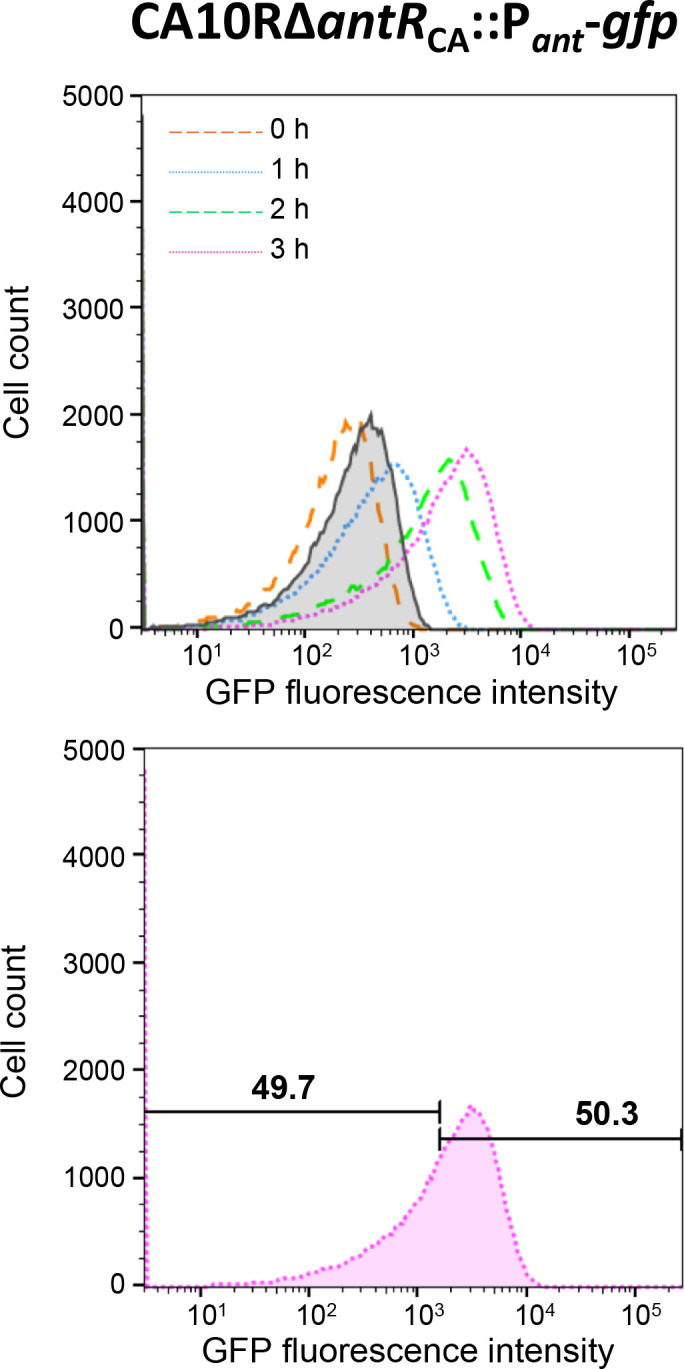
To elucidate why plasmid-borne catabolic ability differs among host bacteria, we assessed the expression dynamics of the Pant promoter on the carbazole-degradative conjugative plasmid pCAR1 in Pseudomonas putida KT2440(pCAR1) (hereafter, KTPC) and Pseudomonas resinovorans CA10. The Pant promoter regulates the transcription of both the car and ant operons, which are responsible for converting carbazole into anthranilate and anthranilate into catechol, respectively. In the presence of anthranilate, transcription of the Pant promoter is induced by the AraC/XylS family regulator AntR, encoded on pCAR1. A reporter cassette containing the Pant promoter followed by gfp was inserted into the chromosomes of KTPC and CA10. After adding anthranilate, GFP expression in the population of CA10 showed an unimodal distribution, whereas a small population with low GFP fluorescence intensity appeared for KTPC. CA10 has a gene, antRCA, that encodes an iso-functional homolog of AntR on its chromosome. When antRCA was disrupted, a small population with low GFP fluorescence intensity appeared. In contrast, overexpression of pCAR1-encoded AntR in KTPC resulted in unimodal expression under the Pant promoter. These results suggest that the expression of pCAR1-encoded AntR is insufficient to ameliorate the stochastic expression of the Pant promoter. Raman spectra of single cells collected using deuterium-labeled carbazole showed that the C-D Raman signal exhibited greater variability for KTPC than CA10. These results indicate that heterogeneity at the transcriptional level of the Pant promoter due to insufficient AntR availability causes fluctuations in the pCAR1-borne carbazole-degrading capacity of host bacterial cells.IMPORTANCEHorizontally acquired genes increase the competitiveness of host bacteria under selective conditions, although unregulated expression of foreign genes may impose fitness costs. The "appropriate" host for a plasmid is empirically known to maximize the expression of plasmid-borne traits. In the case of pCAR1-harboring Pseudomonas strains, P. resinovorans CA10 exhibits strong carbazole-degrading capacity, whereas P. putida KT2440 harboring pCAR1 exhibits low degradation capacity. Our results suggest that a chromosomally encoded transcription factor affects transcriptional and metabolic fluctuations in host cells, resulting in different carbazole-degrading capacities as a population. This study may provide a clue for determining appropriate hosts for a plasmid and for regulating the expression of plasmid-borne traits, such as the degradation of xenobiotics and antibiotic resistance.
Keywords: Pseudomonas; Raman spectroscopy; flow cytometry; heterogeneity; plasmids.
Conflict of interest statement
The authors declare no conflict of interest.
Figures


Similar articles
-
Transcriptional regulation of the ant operon, encoding two-component anthranilate 1,2-dioxygenase, on the carbazole-degradative plasmid pCAR1 of Pseudomonas resinovorans strain CA10.J Bacteriol. 2004 Oct;186(20):6815-23. doi: 10.1128/JB.186.20.6815-6823.2004. J Bacteriol. 2004. PMID: 15466034 Free PMC article.
-
Transcriptome analysis of Pseudomonas putida KT2440 harboring the completely sequenced IncP-7 plasmid pCAR1.J Bacteriol. 2007 Oct;189(19):6849-60. doi: 10.1128/JB.00684-07. Epub 2007 Aug 3. J Bacteriol. 2007. PMID: 17675379 Free PMC article.
-
Carbazole-degradative IncP-7 plasmid pCAR1.2 is structurally unstable in Pseudomonas fluorescens Pf0-1, which accumulates catechol, the intermediate of the carbazole degradation pathway.Appl Environ Microbiol. 2009 Jun;75(12):3920-9. doi: 10.1128/AEM.02373-08. Epub 2009 Apr 17. Appl Environ Microbiol. 2009. PMID: 19376894 Free PMC article.
-
Structural and molecular genetic analyses of the bacterial carbazole degradation system.Biosci Biotechnol Biochem. 2012;76(1):1-18. doi: 10.1271/bbb.110620. Epub 2012 Jan 7. Biosci Biotechnol Biochem. 2012. PMID: 22232235 Review.
-
The behavior of mobile genetic elements (MGEs) in different environments.Biosci Biotechnol Biochem. 2017 May;81(5):854-862. doi: 10.1080/09168451.2016.1270743. Epub 2017 Jan 12. Biosci Biotechnol Biochem. 2017. PMID: 28077029 Review.
Cited by
-
Fitness and adaptive evolution of a Rhodococcus sp. harboring dioxin-catabolic plasmids.World J Microbiol Biotechnol. 2025 Jan 27;41(2):51. doi: 10.1007/s11274-025-04270-5. World J Microbiol Biotechnol. 2025. PMID: 39865154
References
Publication types
MeSH terms
Substances
Grants and funding
LinkOut - more resources
Full Text Sources
