. 2024 Mar 4;221(3):e20231011.
doi: 10.1084/jem.20231011. Epub 2024 Jan 30.

Microglia at sites of atrophy restrict the progression of retinal degeneration via galectin-3 and Trem2

Affiliations

Microglia at sites of atrophy restrict the progression of retinal degeneration via galectin-3 and Trem2

Chen Yu et al. J Exp Med. .

Abstract

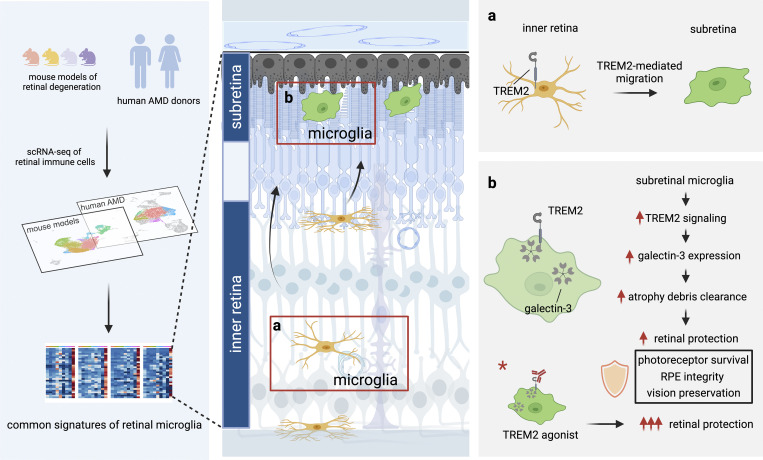
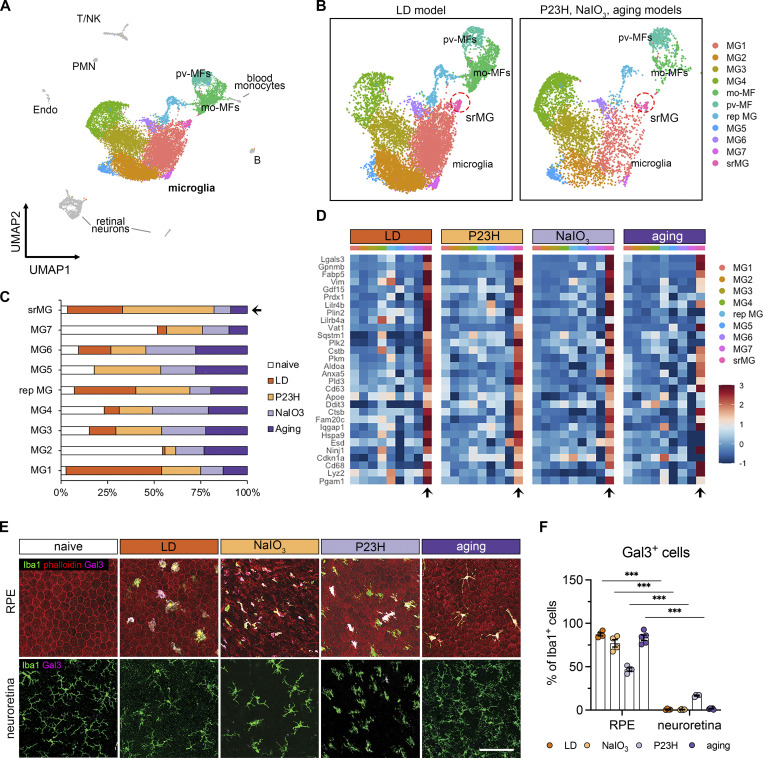
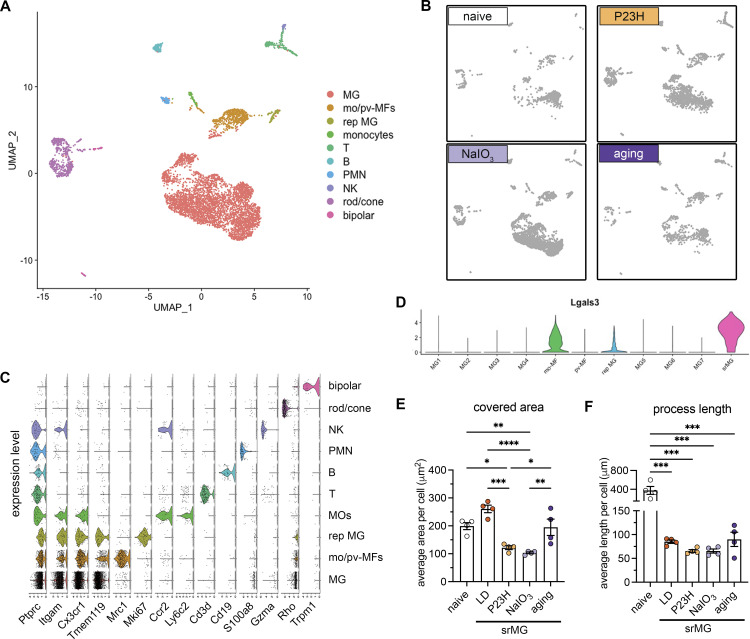
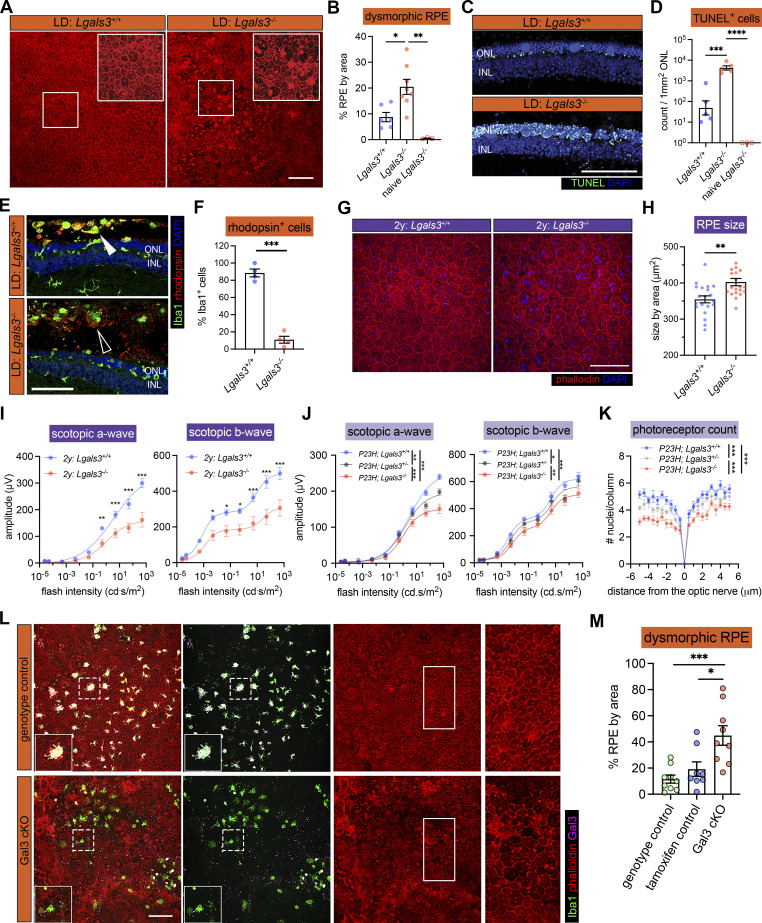
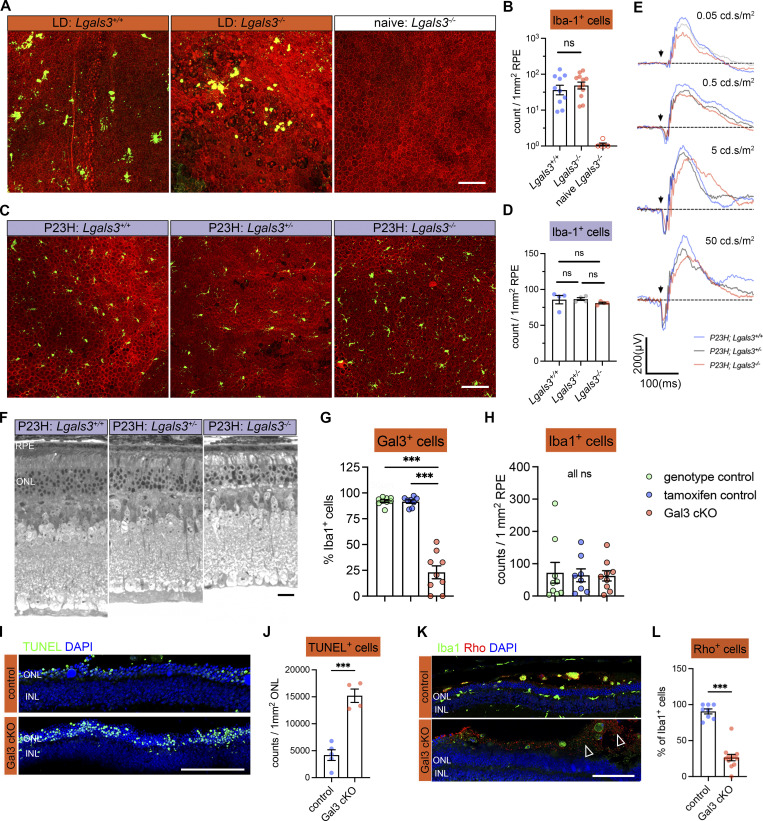
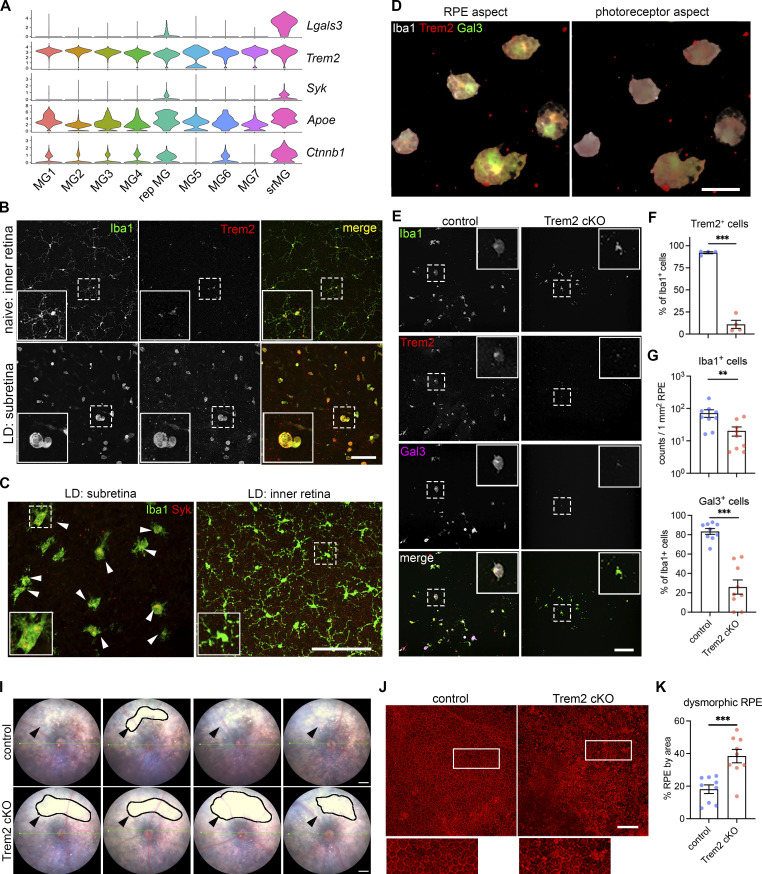
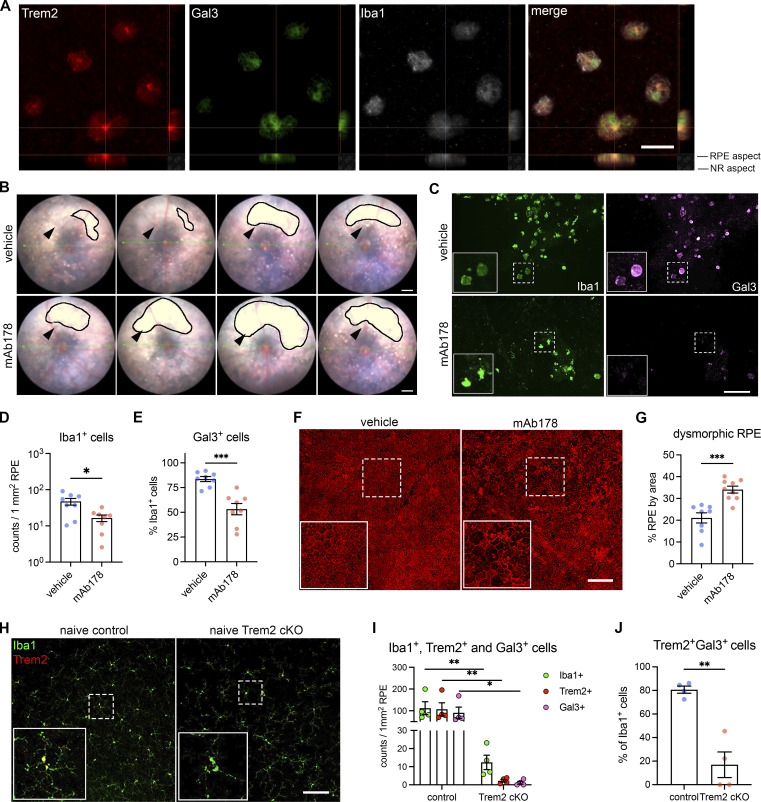
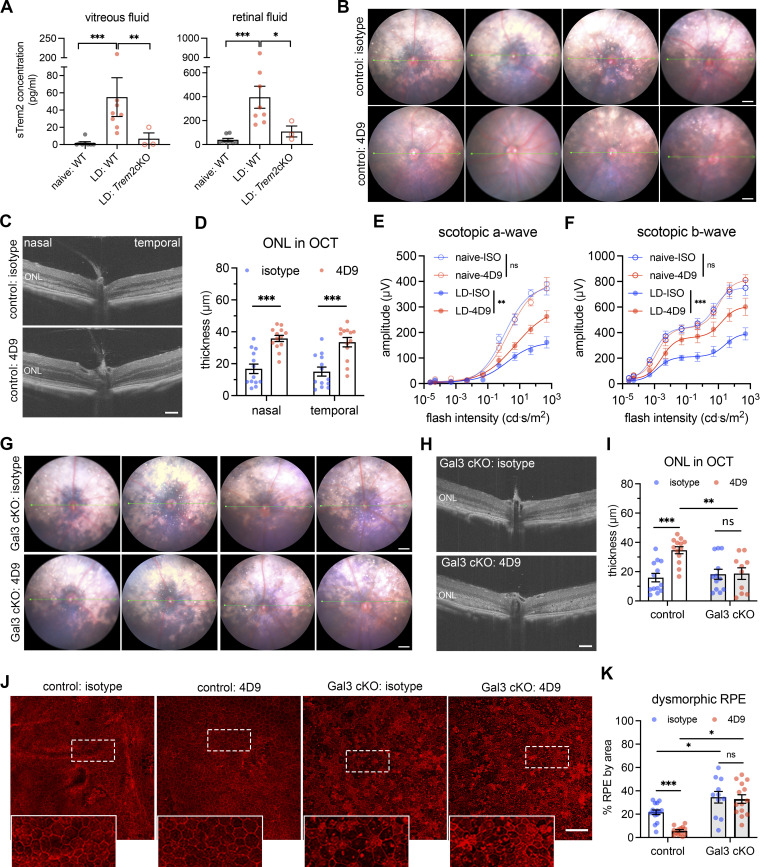
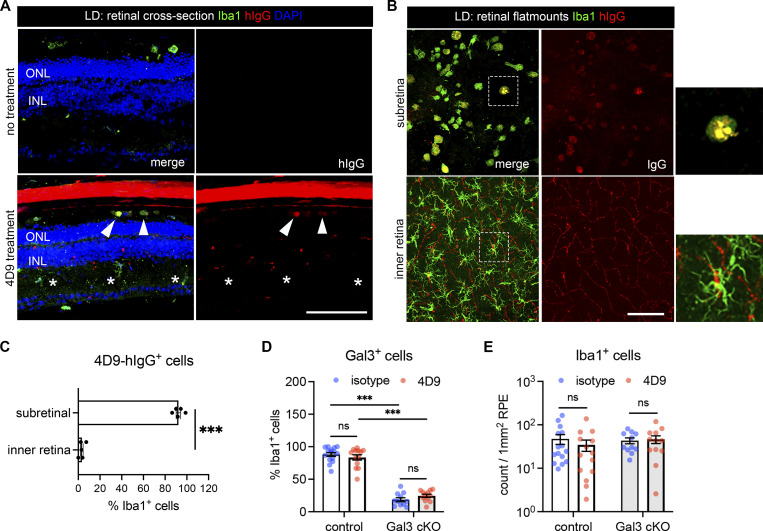
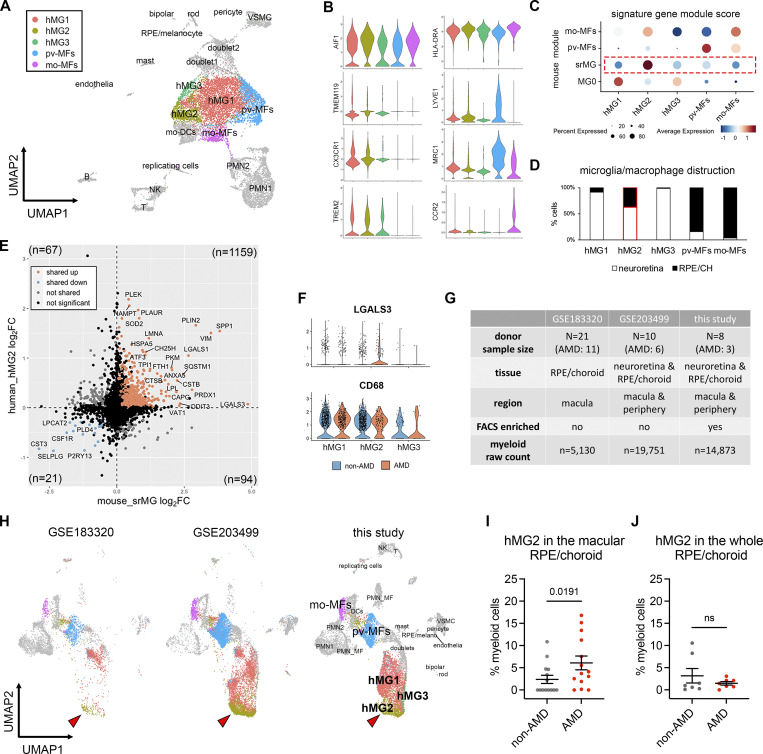
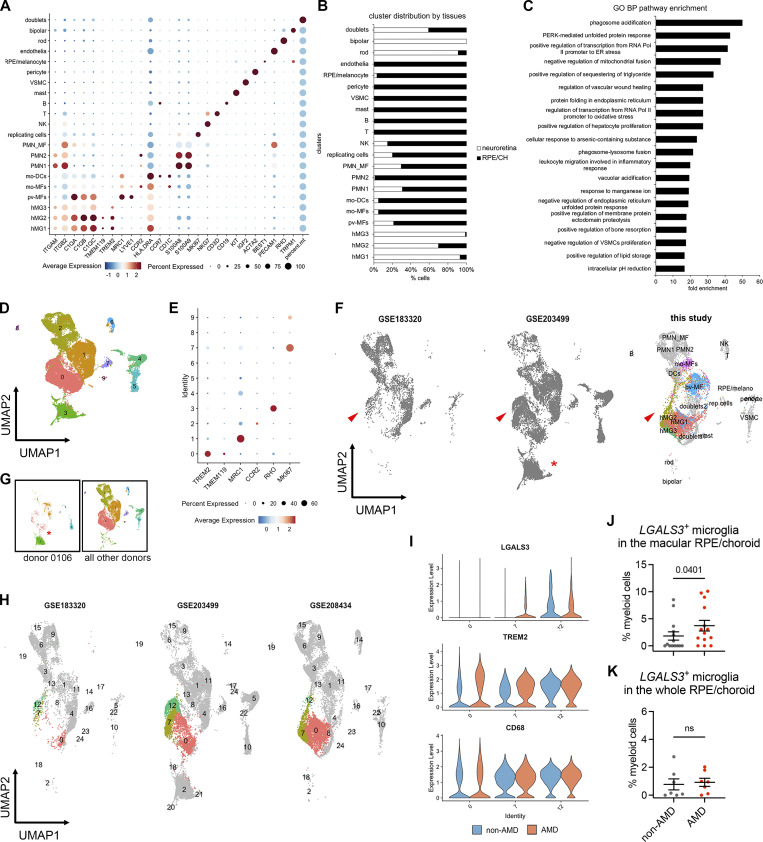
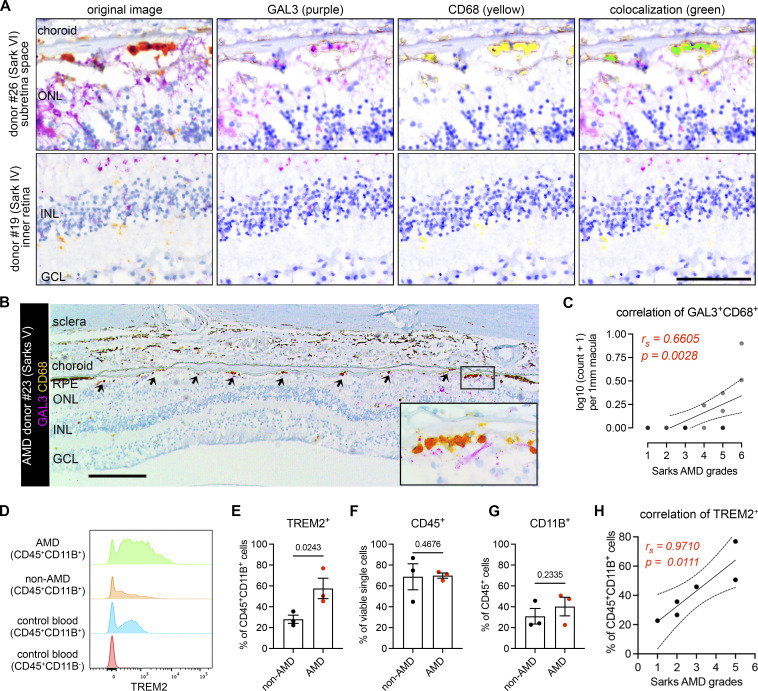
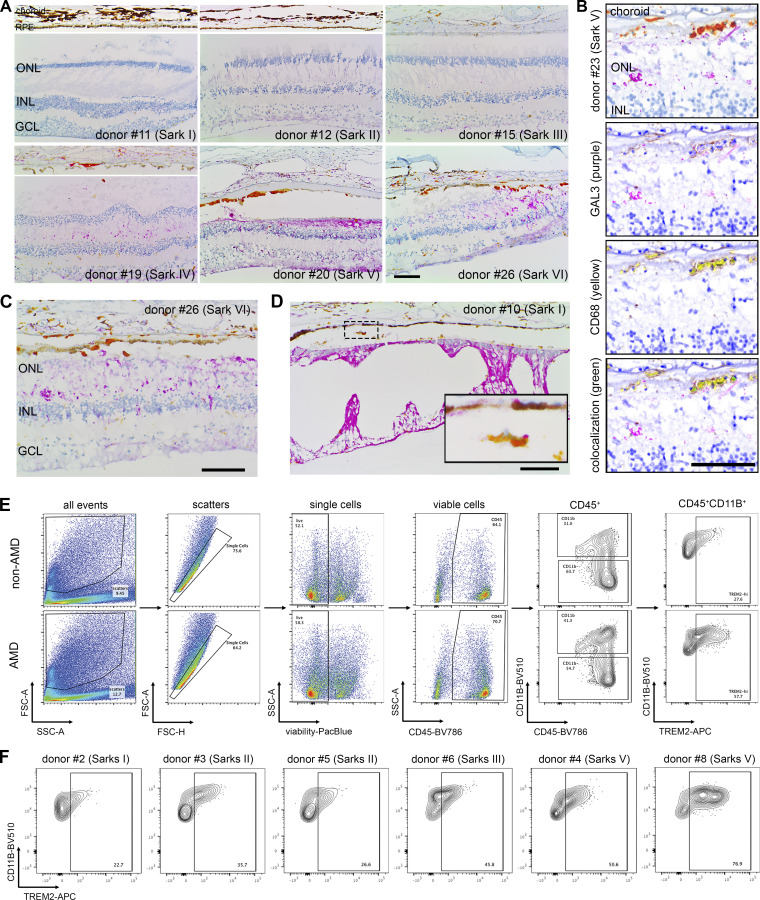
Outer retinal degenerations, including age-related macular degeneration (AMD), are characterized by photoreceptor and retinal pigment epithelium (RPE) atrophy. In these blinding diseases, macrophages accumulate at atrophic sites, but their ontogeny and niche specialization remain poorly understood, especially in humans. We uncovered a unique profile of microglia, marked by galectin-3 upregulation, at atrophic sites in mouse models of retinal degeneration and human AMD. In disease models, conditional deletion of galectin-3 in microglia led to phagocytosis defects and consequent augmented photoreceptor death, RPE damage, and vision loss, indicating protective roles. Mechanistically, Trem2 signaling orchestrated microglial migration to atrophic sites and induced galectin-3 expression. Moreover, pharmacologic Trem2 agonization led to heightened protection but in a galectin-3-dependent manner. In elderly human subjects, we identified this highly conserved microglial population that expressed galectin-3 and Trem2. This population was significantly enriched in the macular RPE-choroid of AMD subjects. Collectively, our findings reveal a neuroprotective population of microglia and a potential therapeutic target for mitigating retinal degeneration.


Conflict of interest statement

Disclosures: C. Yu reported a patent to DU7705PROV-2 pending. K. Schlepckow and C. Haass reported “other” from Denali Therapeutics during the conduct of the study and grants from Cure Alzheimer’s Fund outside the submitted work; in addition, K. Schlepckow and C. Haass had a patent to WO-2018015573-A2 issued, a patent to PTO-1382, file reference no. 123658-12002 licensed Bex Vision, Inc., and a patent to DNL-008-10-P1 - 02900.044PV1 pending; and received €1,000 inventor royalties from the German Center for Neurodegenerative Diseases for co-developing a therapeutic anti-TREM2 antibody (see Schlepckow et al., 2020). M. Colonna reported personal fees from Vigil Neuro, grants from Vigil Neuro, and personal fees from Cell Signaling Technology during the conduct of the study; in addition, M. Colonna had a patent to patent to TREM2 pending. D.R. Saban reported a patent pending. No other disclosures were reported.

Figures

None
Graphical abstract
Figure 1.
Figure 1.
The microglial population present in the subretinal space shares a common signature in mouse models of photoreceptor degeneration, RPE degeneration, and advanced aging. (A) UMAP plot showing integrated clustering of immune cells sampled from four mouse models of retinal degeneration, including LD model (sorted by Cx3cr1+), NaIO3 model (CD45+), P23H model (CD45+), and aging model (CD45+) and naïve mice (CD45+). A total of 15,623 macrophages, including 13,489 microglia, were integrated among four models. PMN, polymorphonuclear neutrophils; mo-MFs, monocyte-derived macrophages; pv-MFs: perivascular macrophages; NK, natural killer. (B) UMAP plots showing integrated macrophage clusters by two datasets. Dash circles indicate subretinal microglia (srMG). (C) Percentage of sample distribution by clusters. The arrow indicates the enrichment of srMG cluster from degenerating retinas. (D) Heatmap of top 30 conserved marker genes of subretinal microglia shared by each model across clusters. Genes were ranked by fold changes. Arrows indicate srMG cluster. (E) In situ validation of Gal3 expression on the apical RPE (top) or in the neuroretina from the inner plexiform layer (bottom). Iba1 (green), phalloidin (red, only in RPE), and Gal3 (magenta). Scale bar: 100 μm. (F) Percentage of Gal3+ cells relative to Iba1+ cells between RPE and neuroretina tissues across models. Data were collected from two independent experiments for sequencing and validation. ***: P < 0.001. Two-way ANOVA with Tukey’s post hoc test (F).
Figure S1.
Figure S1.
scRNA-seq and morphological analysis of subretinal microglia across mouse models of outer retinal degeneration. (A and B) UMAP plots showing retinal CD45+ cells collected from naïve mice, NaIO3 mediated RPE injury model, P23H model, and advanced aging model as indicated. MG, microglia; mo-MFs, monocyte-derived macrophages; pv-MFs: perivascular macrophages; mo-DCs, monocyte-derived dendritic cells; PMN, polymorphonuclear neutrophils; NK, natural killer. (C) Violin plots show marker expressions for each cluster. (D) Violin plots showing Lgals3 expression across all macrophage clusters. srMG, subretinal microglia. (E and F) Quantifications of covered area and process length in naïve microglia from the inner retina and subretinal microglia from four mouse models of retinal degenerations (n = 4 mice per group). Data were collected from two independent experiments for sequencing and validation. *: P < 0.05; **: P < 0.01; ***: P < 0.001; ****: P < 0.0001 (one-way ANOVA with Tukey’s post hoc test).
Figure 2.
Figure 2.
Gal3 expressed by subretinal microglia is central in restricting disease progression in acute, genetic, and aging mouse models of retinal degeneration. (A) Images of phalloidin staining in WT and Lgals3−/− RPE tissues in LD. (B) Quantifications of dysmorphic RPE cells (n = 6, 7, and 3, respectively). (C) TUNEL (green) and DAPI (blue) staining in WT and Lgals3−/− retinal cross-sections in LD. INL, inner nuclear layer. (D) Quantifications of TUNEL+ photoreceptors in ONL (n = 5, 5, and 3, respectively). (E) Rhodopsin (red) and Iba1 (green) staining in WT and Lgals3−/− retinal cross-sections in LD. Images from single planes of confocal scans were shown. (F) Quantifications of rhodopsin+ subretinal microglia (n = 4 per group). (G) Images of phalloidin staining in WT and Lgals3−/− RPE tissues at 2 years (2y) of age. (H) Quantifications of RPE cell size. Dots represent individual images with n = 5 mice per group. (I) ERG data showing scotopic a- and b-waves in 2-year-old WT (n = 5) and Lgals3−/− (n = 5) mice. (J) Scotopic a- and b-waves of ERG data among Lgals3+/+ (n = 12), Lgals3+/− (n = 6), and Lgals3−/− (n = 10) in P23H mice. (K) Quantifications of ONL thickness among Lgals3+/+ (n = 7), Lgals3+/− (n = 7), and Lgals3−/− (n = 8) in P23H mice. (L) Representative images of dysmorphic RPE cells in Gal3 cKO in LD. Iba1, green; phalloidin, red; Gal3, magenta. (M) Quantifications of dysmorphic RPE cells in Gal3 cKO mice (n = 9) compared with genotype control (Cx3cr1CreER/+Lgals3fl/fl mice, n = 9) and tamoxifen control (Cx3cr1CreER/+ mice treated with tamoxifen, n = 8). Scale bars: 100 μm. Data were collected from two to three independent experiments. *: P < 0.05; **: P < 0.01; ***: P < 0.001; ****: P < 0.0001. One-way ANOVA with Tukey’s post hoc test (B, D, and M); unpaired Student’s t test (F and H); two-way ANOVA with Tukey’s post hoc test (I, J, and K).
Figure S2.
Figure S2.
Contributions of Gal3 to disease-related retinal pathology and to Iba1+ cell abundance in the subretinal space. (A) Iba1 (green) and phalloidin (red) staining in RPE flatmounts from LD-subjected mice as indicated. (B) Quantifications of subretinal Iba1+ cells shown in A. (C) Iba1 (green) and phalloidin (red) staining in RPE flatmounts from P23H mice as indicated. (D) Quantifications of subretinal Iba1+ cells as shown in C. (E) Examples of ERG responses at different flash intensities as indicated. (F) Representative retinal cross-sections of WT, Lgals3+/−, and Lgals3−/− in P23H mice. (G and H) Quantifications of Gal3 depletion efficiency (G) and frequencies of subretinal Iba1+ cells (H) in Gal3 cKO mice (n = 9) compared with genotype control mice (n = 9) and tamoxifen control (n = 8). (I) TUNEL (green) and DAPI (blue) staining in control and Gal3 cKO retinal cross-sections in LD. INL, inner nuclear layer. (J) Quantifications of TUNEL+ photoreceptors in ONL (n = 4 per group). (K) Rhodopsin (red) and Iba1 (green) staining in control and Gal3 cKO retinal cross-sections in LD. Images from single planes of confocal scans were shown. (L) Quantifications of rhodopsin+ subretinal microglia. Dots represent the percentage of each image. Scale bars: 100 μm. Data were collected from two to three independent experiments. ***: P < 0.001; ns: not significant. One-way ANOVA with Tukey’s post hoc test (B, D, G, and H); unpaired Student’s t test (J and L).
Figure 3.
Figure 3.
Trem2 regulates microglial migration and promotes Gal3-mediated protection. (A) Violin plots showing the upregulation of genes (Lgals3, Syk, and Ctnnb1I) related to Trem2 signaling by subretinal microglia from the integrated dataset of all four mouse models. (B) Images of Iba1 (green) and Trem2 (red) staining in naïve microglia from the inner retina and subretinal microglia in LD. (C) Images of Iba1 (green) and Syk (red) staining in subretinal microglia and microglia from the inner retina in LD. Arrowheads indicate Syk+ microglia. (D) 3D rendering images of Gal3 (green), Trem2 (red), and Iba1 (white) staining in subretinal microglia in LD. Views from both the apical RPE aspect and the neuroretina aspect are shown. (E) Images of Iba1 (green), Trem2 (red), and Gal3 (magenta) staining in subretinal microglia between control and Trem2 cKO mice in LD. (F–H) Quantifications of Trem2 depletion (F, n = 4 per group), Iba1+ cells (G, n = 9), and Gal3+ cells (H, n = 9) between control and Trem2 cKO mice. (I) Fundus images showing increased subretinal white lesions in Trem2 cKO mice in LD as indicated by arrowheads. Images from four individual mice per group are shown. (J) Images of phalloidin staining in RPE tissues from control and Trem2 cKO mice in LD. (K) Quantifications of dysmorphic RPE cells between control and Trem2 cKO mice (n = 9 per group). Scale bars: 50 μm (D); 100 μm (B, C, E, and J); 0.5 mm (I). Data were collected from two independent experiments. **: P < 0.01; ***: P < 0.001. Unpaired Student’s t test (F–H).
Figure S3.
Figure S3.
Regulation by Trem2 signaling in subretinal microglia. (A) Split views of confocal scans show the colocalization of Trem2 (red), Gal3 (green), and Iba1 (white) in the subretinal microglia. Lines indicate the RPE-facing and neuroretina (NR)-facing aspects as indicated. Scale bar: 50 μm. (B) Fundus images show increased subretinal white lesions in anti-Trem2 mAb178-treated mice in LD, as indicated by arrowheads. Images of four individual mice per group are shown. Scale bar: 0.5 mm. (C) Images of Iba1 (green) and Gal3 (magenta) staining in subretinal microglia between control and mAb178-treated mice in LD. Scale bar: 100 μm. (D and E) Quantifications of Iba1+ cells and Gal3+ cells between control and mAb178 (n = 8 per group). (F) Images of phalloidin staining in RPE flatmounts from control and mAb178-treated mice in LD. Scale bar: 100 μm. (G) Quantifications of dysmorphic RPE cells between control (n = 8) and mAb178- (n = 9) treated mice. (H) Images of Iba1 (green) and Trem2 (red) in microglia from the inner retina of naïve control and Trem2 cKO mice. Scale bar: 50 μm. (I) Frequencies of Iba1+ cells, Trem2+ cells, and Gal3+ cells between control and Trem2 cKO mice in LD (n = 4 per group). (J) Percentages of Trem2+ Gal3+ double-positive cells relative to Iba1+ cells between control and Trem2 cKO mice in LD (n = 4 per group). *: P < 0.05; **: P < 0.01; ***: P < 0.001. Two-way ANOVA with Tukey’s post hoc test (I); unpaired Student’s t test (D, E, G, I, and J).
Figure 4.
Figure 4.
Bolstering Gal3-dependent Trem2 signaling by microglia prevents retinal degeneration. (A) ELISA of soluble Trem2 (sTrem2) in vitreous fluid and retinal fluid from naïve WT mice, WT, and Trem2 cKO mice subjected to LD. (B) Fundus images of mice treated with isotype control or 4D9 anti-Trem2 in LD. Four individual mice per group are shown. (C) Representative OCT images of mice treated with isotype or 4D9 in LD. (D) Quantifications of ONL thickness by OCT (n = 13 per group). ONL thickness was measured at both nasal and temporal sides. (E and F) Scotopic a-waves and b-waves of ERG data among mice treated with isotype or 4D9 in naïve or LD setting (n = 5 per group). (G) Fundus images of Gal3 cKO mice treated with isotype or 4D9 in LD. Four individual mice per group are shown. (H) Representative OCT images of Gal3 cKO mice treated with isotype control or 4D9 anti-Trem2 in LD. (I) Quantifications of average ONL thickness by OCT between control and Gal3 cKO mice treated with either isotype or 4D9 (n = 13 per group). (J) Images of phalloidin staining of control and Gal3 cKO RPE treated with isotype or 4D9 in LD. (K) Quantifications of dysmorphic RPE cells (n = 15, 13, 11, and 13, respectively). Scale bars: 0.5 mm (B and G); 100 μm (C, H, and J). Data were collected from two to four independent experiments. *: P < 0.05; **: P < 0.01; ***: P < 0.001; ns: not significant. Unpaired Student’s t test (F–H). One-way ANOVA with Tukey’s post hoc test (A); two-way ANOVA with Tukey’s post hoc test (D–F, I, and K).
Figure S4.
Figure S4.
Subretinal microglia with 4D9 treatment. (A) Staining of human IgG (red) and Iba1 (green) in retinal cross-sections collected from mice with or without 4D9 treatment in LD. The hIgG is used to trace 4D9 antibodies, which outlines retinal vasculatures in 4D9-treated mice. Arrowheads indicate the presence of 4D9 antibodies in the subretinal microglia, while asterisks indicate the absence of 4D9 antibodies in microglia from the inner retina. INL, inner nuclear layer. (B) Human IgG (red) and Iba1 (green) staining in RPE and neuroretina flatmounts were collected from mice treated with 4D9 antibodies in LD. (C) Quantifications of hIgG+ microglia in the subretinal space and neuroretina. (D and E) Quantifications of Iba1+ cells and Gal3+ cells between control and Gal3 cKO mice treated with either isotype or 4D9 (n = 13 per group). Scale bars: 100 μm. Data were collected from two to four independent experiments. ***: P < 0.001; ns: not significant. Unpaired Student’s t test (C); two-way ANOVA with Tukey’s post hoc test (D and E).
Figure 5.
Figure 5.
Microglia at the sites of atrophy show a conserved phenotype between mice and humans and are enriched in the macula of AMD patients. (A) UMAP plot showing unsupervised clustering analysis of myeloid cells from human donors. CD45+CD11b+ cells were FACS-sorted from neuroretina and RPE/choroid tissues, respectively. hMG, human microglia; mo-MFs, monocyte-derived macrophages; pv-MFs: perivascular macrophages; mo-DCs, monocyte-derived dendritic cells; VSMC, vascular smooth muscle cells. (B) Violin plots showing the marker expression by macrophage clusters. (C) Dot plots showing gene module scores of human microglia/macrophage clusters. The gene modules were generated and normalized using the top 200 mouse markers from homeostatic microglia (MG0), subretinal microglia (srMG), pv-MFs, and mo-MFs. (D) Bar graphs showing the composition of macrophage/microglia clusters by tissues. The red box indicates the enrichment of cells from RPE/choroids in hMG2 cluster. (E) Comparison of gene expression between mouse subretinal microglia (x-axis) and human hMG2 (y-axis). The number in each quadrant shows the quantity of DEGs as indicated by colors. (F) Violin plots showing the expression of LGALS3 and CD68 by microglia clusters between non-AMD and AMD donors. (G) Summary of three independent human AMD scRNA-seq datasets. (H) UMAP plots showing the label transfer of myeloid cells among datasets. Arrowheads indicate hMG2 clusters in each dataset. (I and J) Quantifications of hMG2 frequencies in the whole and macular RPE/choroid tissues between non-AMD and AMD donors. Mann–Whitney test (one-tailed) was used, and P values are shown; ns: not significant.
Figure S5.
Figure S5.
scRNA-seq analysis of myeloid cells from human non-AMD and AMD donors. (A) Marker expression of all human clusters. hMG, human microglia; mo-MFs, monocyte-derived macrophages; pv-MFs: perivascular macrophages; mo-DCs, monocyte-derived dendritic cells; PMN_MF: doublets of polymorphonuclear neutrophils and macrophages; VSMC, vascular smooth muscle cells; NK, natural killer. (B) Distribution of clusters by neuroretina and RPE/choroid tissues. The cell number of clusters was normalized to the total counts per tissue. (C) Pathway enrichment analysis of subretinal microglia with top 200 shared upregulated genes. The top significant pathways sorted by false discovery and ranked by fold enrichment are shown. GO: Gene Ontology; BP: Biological Process. (D) UMAP plot showing integrated clustering analysis of three independent human AMD datasets. Data are shown with low resolution to reveal major cell types. (E) Dot plot showing the marker expression of major macrophage clusters. Cluster 3 is enriched with RHO expression. (F) UMAP plots show the presence of hMG2 cluster in all three scRNA-seq datasets as indicated by arrowheads. (G) UMAP plots showing the enrichment of cluster 3 in donor 0106_nAMD. (H) UMAP plots showing clustering analysis with high resolution by each dataset and comparable heterogeneity of microglia (cluster 0, 7, and 12). As dataset GSE183320 does not contain neurosensory retina tissues, few cells of major homeostatic microglia (cluster 0) are observed in this dataset. (I) Violin plots show the expression of LGALS3, TREM2, and CD68 by microglial clusters between non-AMD and AMD donors. Both clusters 7 and 12 show LGALS3 upregulation as hMG2 cluster identified in this study. (J and K) Quantifications of LGALS3+ microglial clusters (7 and 12) in the macular and whole RPE/choroid tissues between non-AMD and AMD donors. Data were collected from independent datasets and compared using the Mann-Whitney test. P values are shown. ns: not significant.
Figure 6.
Figure 6.
Microglia expressing GAL3 and TREM2 are associated with AMD progression. (A) Multispectral imaging of GAL3 and CD68 co-staining in the subretinal space (top) and inner retina (bottom) from human donors. Unmixed purple spectrum (GAL3) and yellow spectrum (CD68) are shown. The areas of colocalized spectra are highlighted in green. Scale bar: 50 μm. INL, inner nuclear layer. (B) Representative image of GAL3 and CD68 costaining in the macular GA region of a retinal section from an 88-year-old female donor eye with advanced AMD (Sarks V). Arrows indicate double-positive myeloid cells in GA. The black insert box shows the magnification of GA with double-positive cells. Scale bar: 200 μm. GCL, ganglion cell layer. (C) Correlation between the frequencies of macular GAL3+CD68+ double-positive cells (y-axis) and Sarks AMD grading (x-axis) by Spearman’s correlation (n = 18 donors, Table S2). The coefficient and P value are shown. (D) Histograms showing increased TREM2+ myeloid cells (CD45+CD11B+) in RPE/choroid tissues of AMD donors. Concatenated histograms were shown (n = 3 per group). Control human blood samples were used to set up flow gating. (E–G) Quantifications of TREM2+ (E), CD45+ (F), and CD11B+ (G) cell frequencies in RPE/choroid tissues between non-AMD and AMD donors. Unpaired student’s t test is used. P values are shown. (H) Correlation between the frequencies of TREM2+ myeloid cells (y-axis) and Sarks AMD grading (x-axis) in RPE/choroid tissues by Spearman’s correlation. The coefficient and P value are shown.
Figure S6.
Figure S6.
Validation of GAL3 and TREM2 expression by subretinal myeloid cells in human AMD. (A) Images of GAL3 (purple) and CD68 (yellow) costaining in the macula region of retinal sections from human donors categorized by Sark grades (I–VI). The macular neurosensory retinas of some subject eyes exhibited fixation-related artifactual detachment. In these subjects, separate images of RPE/choroid tissues are shown. Scale bar: 100 μm. INL, inner nuclear layer. GCL, ganglion cell layer. (B) Spectral imaging of GAL3 and CD68 costaining in the geographic atrophy from donor #23 with advanced AMD (Sarks V). Unmixed purple spectrum (GAL3) and yellow spectrum (CD68) are shown. The areas of colocalized spectra are highlighted in green. Scale bar: 50 μm. (C and D) Images showing the presence of subretinal GAL3 (purple) and CD68 (yellow) double-positive cells in the areas with photoreceptor loss and preserved RPE in the transitional area of the macula from an AMD donor (C) and in the age-related peripheral degeneration of a non-AMD donor (D). Scale bars: 100 μm. (E) Gating strategy of flow cytometry analysis. CD45+CD11B+ cells and CD45+CD11B cells from control blood were used to determine the gating of TREM2+ cells. Concatenated plots are shown for non-AMD and AMD. (F) Flow contour plots of individual donors showing an increased percentage of TREM2+ myeloid cells in AMD.

Update of

References

    1. Ajami, B., Bennett J.L., Krieger C., McNagny K.M., and Rossi F.M.. 2011. Infiltrating monocytes trigger EAE progression, but do not contribute to the resident microglia pool. Nat. Neurosci. 14:1142–1149. 10.1038/nn.2887 - DOI - PubMed
    1. Ajami, B., Bennett J.L., Krieger C., Tetzlaff W., and Rossi F.M.. 2007. Local self-renewal can sustain CNS microglia maintenance and function throughout adult life. Nat. Neurosci. 10:1538–1543. 10.1038/nn2014 - DOI - PubMed
    1. Anderson, S.R., Roberts J.M., Zhang J., Steele M.R., Romero C.O., Bosco A., and Vetter M.L.. 2019. Developmental apoptosis promotes a disease-related gene signature and independence from CSF1R signaling in retinal microglia. Cell Rep. 27:2002–2013.e15. 10.1016/j.celrep.2019.04.062 - DOI - PMC - PubMed
    1. Badimon, A., Strasburger H.J., Ayata P., Chen X., Nair A., Ikegami A., Hwang P., Chan A.T., Graves S.M., Uweru J.O., et al. . 2020. Negative feedback control of neuronal activity by microglia. Nature. 586:417–423. 10.1038/s41586-020-2777-8 - DOI - PMC - PubMed
    1. Beguier, F., Housset M., Roubeix C., Augustin S., Zagar Y., Nous C., Mathis T., Eandi C., Benchaboune M., Drame-Maigné A., et al. . 2020. The 10q26 risk haplotype of age-related macular degeneration aggravates subretinal inflammation by impairing monocyte elimination. Immunity. 53:429–441.e8. 10.1016/j.immuni.2020.07.021 - DOI - PubMed