. 2024 Jan 30;29(1):2.
doi: 10.1007/s10911-024-09555-3.

Fast Ultrasound Scanning is a Rapid, Sensitive, Precise and Cost-Effective Method to Monitor Tumor Grafts in Mice

Affiliations

Fast Ultrasound Scanning is a Rapid, Sensitive, Precise and Cost-Effective Method to Monitor Tumor Grafts in Mice

Sébastien Molière et al. J Mammary Gland Biol Neoplasia. .

Abstract

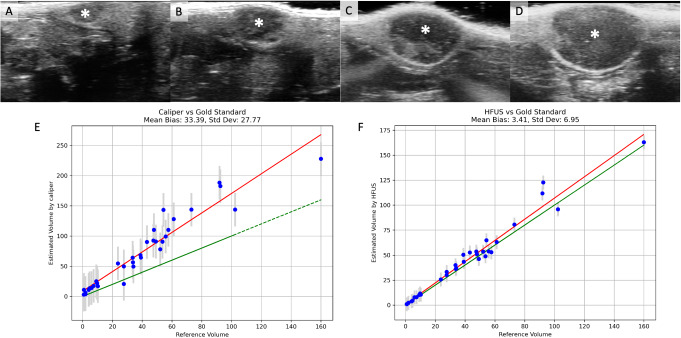
In preclinical studies, accurate monitoring of tumor dynamics is crucial for understanding cancer biology and evaluating therapeutic interventions. Traditional methods like caliper measurements and bioluminescence imaging (BLI) have limitations, prompting the need for improved imaging techniques. This study introduces a fast-scan high-frequency ultrasound (HFUS) protocol for the longitudinal assessment of syngeneic breast tumor grafts in mice, comparing its performance with caliper, BLI measurements and with histological analysis. The E0771 mammary gland tumor cell line, engineered to express luciferase, was orthotopically grafted into immunocompetent C57BL/6 mice. Tumor growth was monitored longitudinally at multiple timepoints using caliper measurement, HFUS, and BLI, with the latter two modalities assessed against histopathological standards post-euthanasia. The HFUS protocol was designed for rapid, anesthesia-free scanning, focusing on volume estimation, echogenicity, and necrosis visualization. All mice developed tumors, only 20.6% were palpable at day 4. HFUS detected tumors as small as 2.2 mm in average diameter from day 4 post-implantation, with an average scanning duration of 47 s per mouse. It provided a more accurate volume assessment than caliper, with a lower average bias relative to reference tumor volume. HFUS also revealed tumor necrosis, correlating strongly with BLI in terms of tumor volume and cellularity. Notable discrepancies between HFUS and BLI growth rates were attributed to immune cell infiltration. The fast HFUS protocol enables precise and efficient tumor assessment in preclinical studies, offering significant advantages over traditional methods in terms of speed, accuracy, and animal welfare, aligning with the 3R principle in animal research.

Keywords: Bioluminescence; Breast tumor; Follow-up; Mouse; Tumor graft; Ultrasound.


Conflict of interest statement

The authors declare no competing interests.

Figures

Fig. 1
Fig. 1
Bioluminescent tumor cells and follow-up protocol. A: Western blot analysis of Luciferase expression in whole cell protein extract (20 µg) of parental E0771 (WT), transduced with particles derived from the empty vector (CTL) and with particles derived from Luciferase containing vector (Luc2). The anti-Luciferase specific antibody recognized a single protein of around 62 KDa in Luc2 cells only. Anti-actin antibody was used as a loading control. B: Experiment workflow showing tumor implantation at day 0, tumor assessment by caliper, ultrasound and BLI (under anesthesia) at day 4,7,11,14,18 and 21
Fig. 2
Fig. 2
Assessment of tumor growth between the different modalities. A Table summarizing the presence of tumors detected by these different modalities, along with the corresponding number of living mice at each timepoint. B Mean tumor sizes for the period day 4 to day 14 (during that period, all mice are alive). C-H: Details of measurements for each mouse for ultrasound volumetry in mm3 (C and F), caliper-based volumetric estimation in mm3 (D and G) and tumor brightness (photons/sec) on BLI (E and H). In the graphs C-E, each color represents a mouse, while in graphs F-H, mice are grouped by their tumor growth pattern based on ultrasound volumetry (fast-growing, slow-growing, delayed fast-growing, regressing)
Fig. 3
Fig. 3
Representative hematoxylin and eosin-stained sections of a breast tumor graft. A: Low magnification reveals an oval-shaped tumor with limited necrosis (indicated by a star). The tumor margins are predominantly pushing with some entrapped adipocytes visible at the periphery. B: Medium magnification (10x) of the area outlined by a rectangle in A, highlighting the well-defined interface between the tumor and adjacent glandular tissue. The margin delineation suggests a pushing border rather than invasive growth. C: Higher magnification (25x) within the tumor core illustrates marked pleomorphism with numerous mitotic figures (denoted by arrowheads). The pleomorphism is characterized by variation in nuclear size and shape, as well as irregular chromatin patterns. D: A focused view (25x) of a necrotic region shows areas of coagulative necrosis (arrowheads), identifiable by pyknosis, characterized by densely stained, shrunken nuclei indicative of irreversible cell death. E: An additional high-power field (25x) in the tumor core displays infiltration by numerous small, round cells with hyperchromatic nuclei, consistent with lymphocytes. The distribution of these cells within the tumor stroma may suggest an immune response to the tumor
Fig. 4
Fig. 4
An example of longitudinal assessment of tumor growth on HFUS and comparison between volumetry obtained by HFUS/caliper with the volume obtained by the reference method. A-D: Longitudinal assessment of a typical tumor at day 4 (A), 7 (B), 11 (C) and 14 (D) showing a well-demarcated oval-shaped heterogeneous mass (asterisk). E: Correlation, for the entire cohort, between caliper-derived volumetric estimation (mm3) and the reference volume. F: Correlation, for the entire cohort, between HFUS-derived volumetric estimation (mm3) and the reference volume. Green line: line of equality, red line: best fit line. Std Dev: standard deviation
Fig. 5
Fig. 5
Tumor image comparisons between HFUS and histology. A and C: Typical images of ultrasounds obtained with two tumors. Within the tumor mass the presence of hyperechoic region is delineated in white. B and D: Matching histological HE images at low magnification, necrotic areas appear in pink
Fig. 6
Fig. 6
Comparison between tumor brightness on BLI, tumor volume on HFUS and tumor cellularity on histology. A: Correlation of tumor brightness on BLI and HFUS-derived tumor volume, for all measurements made during the follow-up period. Overall Pearson correlation coefficient is 0.79. B-C: Example of tumor cellularity assessment on hematoxylin-eosin-stained slice. First, tumor is delineated on low magnification (yellow outline), and a semi-automatic tumor cell counting using QuPath (delineated in red). The result of the segmentation is shown in B at low magnification. A 10X magnification is provided in C, with the additional segmentation of non-tumor cells in yellow. D-E: Correlation between tumor brightness in photon/sec D or ultrasound-derived volume E and tumor cellularity for all resected tumors. Each blue datapoint represents a resected tumor that has undergone tumor cellularity histological assessment and imaging assessment just on the day of the sacrifice
Fig. 7
Fig. 7
Comparison of tumor growth trends between HFUS and BLI and correlation with immune infiltration. A: For each time interval (x axis), the number of tumors presenting with increase (green), decrease (orange) or stability (yellow) is represented as a histogram. Discordances between BLI and HFUS are higher during the day 11 – day 14 interval. B-C: Tumor infiltration by CD4+ B and CD8 + cells C, measured by the number of IF-positive cells per mm2 on a representative section, is higher when imaging assessment is discordant. D-H: Example of a tumor with decreasing brightness on BLI but persistent tumor growth on HFUS, associated with diffuse lymphocytic infiltration. Ultrasound images showing a slightly heterogeneous tumor on two orthogonal plans D. Longitudinal assessment of the tumor E shows a pronounced decrease of tumor brightness from day 11 (green line) but a steady increase of tumor volume measured by HFUS (blue line). F: HE stained section shows the presence of cancer cell clusters (delineated with a black line) and immune cells. G and H: Immunofluorescence analyses to detect CD4 and CD8 cells show the presence of infiltrating T lymphocytes next to tumor cell clusters
Fig. 8
Fig. 8
Tumor dynamics can be followed by HFUS and BLI. A: Tumor growth measured by BLI from day 7 to 11 and decreases from day 11 to 14, no detectable signal at day 18. B: Parallel images obtained by HFUS, images on the left and on the right correspond to the two orthogonal plans, tumor growth is noticeable until day 14 and then a rapid diminution of the tumor size is observed from day 14: at day 18, the tumor is barely distinguishable from the surrounding tissue due to its high echogenicity. C: Tumor growth kinetics showing an increase and a decrease of tumor brightness (green line) paralleled by tumor volumes measurements by HFUS (blue line). D-G: HE stained slice at low magnification D centered on the tumor bed showing edematous and inflammatory changes with no residual epithelial tumor cells (E: immunofluorescence for pancytokeratin) but intense lymphocytic infiltration (F: immunofluorescence for CD8 and G: immunofluorescence for CD4)

References

    1. Bleijs M, van de Wetering M, Clevers H, Drost J. Xenograft and organoid model systems in cancer research. EMBO J. Aug. 2019;38(15):e101654. 10.15252/embj.2019101654. - PMC - PubMed
    1. O’Neill K, Lyons SK, Gallagher WM, Curran KM, Byrne AT. Bioluminescent imaging: a critical tool in pre-clinical oncology research. J Pathol. 2010;220(3):317–27. doi: 10.1002/path.2656. - DOI - PubMed
    1. Burgos JS et al. Jun., Time course of bioluminescent signal in orthotopic and heterotopic brain tumors in nude mice, BioTechniques, vol. 34, no. 6, pp. 1184–1188, 2003, 10.2144/03346st01. - PubMed
    1. Alsawaftah N, Farooq A, Dhou S, Majdalawieh AF. Bioluminescence Imaging Applications in Cancer: a Comprehensive Review. IEEE Rev Biomed Eng. 2021;14:307–26. doi: 10.1109/RBME.2020.2995124. - DOI - PubMed
    1. Liao A-H, Li P-C. The role of high frequency Ultrasound in Multimodality Small Animal Imaging for Cancer Research. J Med Ultrasound. Jan. 2009;17(2):86–97. 10.1016/S0929-6441(09)60115-6.

LinkOut - more resources