. 2024 May 2;16(5):mfae008.
doi: 10.1093/mtomcs/mfae008.

Impact of aging on copper isotopic composition in the murine brain

Affiliations

Impact of aging on copper isotopic composition in the murine brain

Esther Lahoud et al. Metallomics. .

Abstract

Aging is the main risk factor for Alzheimer's disease (AD). AD is linked to alterations in metal homeostasis and changes in stable metal isotopic composition can occur, possibly allowing the latter to serve as relevant biomarkers for potential AD diagnosis. Copper stable isotopes are used to investigate changes in Cu homeostasis associated with various diseases. Prior work has shown that in AD mouse models, the accumulation of 63Cu in the brain is associated with the disease's progression. However, our understanding of how the normal aging process influences the brain's isotopic composition of copper remains limited. In order to determine the utility and predictive power of Cu isotopes in AD diagnostics, we aim-in this study-to develop a baseline trajectory of Cu isotopic composition in the normally aging mouse brain. We determined the copper concentration and isotopic composition in brains of 30 healthy mice (WT) ranging in age from 6 to 12 mo, and further incorporate prior data obtained for 3-mo-old healthy mice; this range approximately equates to 20-50 yr in human equivalency. A significant 65Cu enrichment has been observed in the 12-mo-old mice compared to the youngest group, concomitant with an increase in Cu concentration with age. Meanwhile, literature data for brains of AD mice display an enrichment in 63Cu isotope compared to WT. It is acutely important that this baseline enrichment in 65Cu is fully constrained and normalized against if any coherent diagnostic observations regarding 63Cu enrichment as a biomarker for AD are to be developed.

Keywords: Alzheimer's disease, biomarker; aging; copper isotopes, MC–ICP–MS, metallomics.


Figures

Graphical Abstract
Graphical Abstract
Made with BioRender.
Fig. 1
Fig. 1
The roles of copper in a healthy brain. Made with BioRender.
Fig. 2
Fig. 2
A. formula imageCu in healthy mouse brain in function of age. Boxes extend from the 25th and 75th percentile, the line inside the box represents the median, and the whiskers show the minimum and maximum of the values. P-value <0.001; **, P-value <0.0001; ****. B. formula imageCu in healthy mouse brain in function of age. Each point corresponds to the mean for one mouse, n corresponds to the number of brains measured per age category. C. Simple linear regression for the data displayed in Fig. 2B (black full line) with 95% confidence intervals (dotted line), R2 = 0.3946 and quadratic second order polynome (red full line), R2 = 0.5126. GraphPad Prism.
Fig. 3
Fig. 3
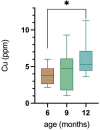
Concentration of copper (ppm) in function of age. Boxes extend from the 25th and 75th percentile, the line inside the box represents the median, and the whiskers show the minimum and maximum of the values. P-value <0.02, *. GraphPad Prism.
Fig. 4
Fig. 4
A, B, C. formula imageCu in function of sex (A), copper concentration in function of sex (B), formula imageCu in function of sex and age (C). (D) is the evolution of the P-values for unpaired-t tests between males and females as a function of age, R2 = 0.9988. Boxes extend from the 25th and 75th percentile, the line inside the box represents the median, and the whiskers show the minimum and maximum of the values.
Fig. 5
Fig. 5
formula image Cu in healthy mouse brain in function of age. Data from (Moynier et al., 2022) and (Morel et al.) were incorporated to the data from this study. Boxes extend from the 25th and 75th percentile, the line inside the box represents the median, and the whiskers show the minimum and maximum of the values. P-value <0.001, ***. GraphPad Prism.
Fig. 6
Fig. 6
A, B. Isotopic composition of copper in the brain of healthy and AD mice. P-value <0.001, ** (A), copper isotopic composition of a healthy (green) and Alzheimer brain (red) (B). Boxes extend from the 25th and 75th percentile, the line inside the box represents the median, and the whiskers show the minimum and maximum of the values. GraphPad Prism, Bio Render.

References

    1. McLean C. A., Cherny R. A., Fraser F. W., Fuller S. J., Smith M. J., Beyreuther K., Bush A. I., Masters C. L. Soluble pool of Abeta amyloid as a determinant of severity of neurodegeneration in Alzheimer's disease, Ann. Neurol, 1999, 46 (6),860–866. 10.1002/1531-8249(199912)46:6<860::aid-ana8>3.0.co;2-m - DOI - PubMed
    1. Mattson M. P., Arumugam T. V. Hallmarks of brain aging: Adaptive and pathological modification by metabolic states, Cell. Metab, 2018, 27, 1176–1199. 10.1016/j.cmet.2018.05.011 - DOI - PMC - PubMed
    1. Junqueira V. B., Barros S. B., Chan S. S., Rodrigues L., Giavarotti L., Abud R. L., Deucher G. P. Aging and oxidative stress, Mol. Aspects. Med., 2004, 5–16. 10.1016/j.mam.2004.02.003 - DOI - PubMed
    1. Harman D. Protein oxidation in aging and age-related diseases, Gerontology, 1956, 11, 298–300. 10.1093/geronj/11.3.298 - DOI
    1. Harman D. The biologic clock: the mitochondria?, J. Am. Geriatr. Soc., 1972, 4,145–147. 10.1111/j.1532-5415.1972.tb00787.x - DOI - PubMed

Publication types