. 2024 Feb 6;121(6):e2309243121.
doi: 10.1073/pnas.2309243121. Epub 2024 Jan 30.

Staphylococcus aureus proteases trigger eosinophil-mediated skin inflammation

Affiliations

Staphylococcus aureus proteases trigger eosinophil-mediated skin inflammation

Sabrina N Kline et al. Proc Natl Acad Sci U S A. .

Abstract

Staphylococcus aureus skin colonization and eosinophil infiltration are associated with many inflammatory skin disorders, including atopic dermatitis, bullous pemphigoid, Netherton's syndrome, and prurigo nodularis. However, whether there is a relationship between S. aureus and eosinophils and how this interaction influences skin inflammation is largely undefined. We show in a preclinical mouse model that S. aureus epicutaneous exposure induced eosinophil-recruiting chemokines and eosinophil infiltration into the skin. Remarkably, we found that eosinophils had a comparable contribution to the skin inflammation as T cells, in a manner dependent on eosinophil-derived IL-17A and IL-17F production. Importantly, IL-36R signaling induced CCL7-mediated eosinophil recruitment to the inflamed skin. Last, S. aureus proteases induced IL-36α expression in keratinocytes, which promoted infiltration of IL-17-producing eosinophils. Collectively, we uncovered a mechanism for S. aureus proteases to trigger eosinophil-mediated skin inflammation, which has implications in the pathogenesis of inflammatory skin diseases.

Keywords: Staphylococcus aureus; eosinophils; inflammatory skin diseases; interleukin-17; interleukin-36.


Conflict of interest statement

Competing interests statement:N.K.A. has received previous grant support from Pfizer and Boehringer Ingelheim and was a paid consultant for Janssen Pharmaceuticals. The remaining authors state no conflict of interest.

Figures
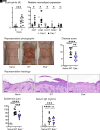
Fig. 1.
Fig. 1.
S. aureus induces eosinophil-mediated skin inflammation. (A and B) WT female mouse skin was naive (day 0) or e.c. exposed to S. aureus (1 × 10⁸ CFU) for 7 d (day 7), and a 10-mm skin biopsy was harvested. (A) Mean numbers of eosinophils (±SEM) in the skin as measured by FACS (n ≥ 7 per group). (B) Relative normalized gene expression (±SEM) in the skin, normalized to β-actin in naive skin (n ≥ 6 per group). (CF) WT and Eos–/– female mice were e.c. exposed to S. aureus (1 × 10⁸ CFU) on the dorsal skin for 7 d, and a 10-mm skin biopsy was harvested (n ≥ 9 per group). (C) Representative skin photographs. (D) Mean disease score, scored based on the sum of three individual grades for erythema, edema, and scaling/erosion for a total range of 0 to 13 (±SEM). (E) Representative histology (H&E stain, 200× magnification). (F) Mean epidermal thickness (±SEM). (G) Mean serum IgE levels (ng/mL) (±SEM). *P < 0.05; **P < 0.01; ***P < 0.001; ****P < 0.0001 as calculated by two-tailed Student’s t test (A and B) or one-way ANOVA multiple comparisons test with Tukey correction (D, F, and G). Scale bars (E) are 100 µm. Data are combined from at least two independent experiments.
Fig. 2.
Fig. 2.
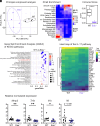
Eosinophils promote the IL-17 pathway during skin inflammation. WT and Eos–/– female mice were e.c. exposed to S. aureus (1 × 10⁸ CFU) on the dorsal skin for 7 d, and a 10-mm skin biopsy was harvested (n = 4 per group). (A) PCA of transcripts per million (TPM) values for skin of WT and Eos–/– mice. (B) Cell type enrichment analysis with the xCell algorithm. Displayed are the cell types with significant differences between Eos–/– and WT mice determined by Wilcoxon rank-sum P-value < 0.05. The Immune Score (C) is the sum of all scores for all immune cell type scores for a given sample. HSC = hematopoietic stem cells, MEP = megakaryocyte-erythroid progenitors, mv = microvascular, MSC = mesenchymal stem cells. (D) GSEA of significant DEGs with gene sets (adjusted P-value < 0.05) from the KEGG. NES = Normalized Enrichment Score (E) Corresponding heat map of the KEGG IL-17 signaling pathway [adjusted P-value < 0.05 and abs(log 2FC) > 1]. (F) Relative normalized gene expression (±SEM) in the skin, normalized to β-actin in WT skin. *P < 0.05 and **P < 0.01 as calculated by two-tailed Student’s t test. qPCR data are combined from at least two independent experiments (n ≥ 9 per group).
Fig. 3.
Fig. 3.
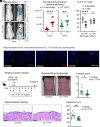
Eosinophil-derived IL-17A and IL-17F drive skin inflammation. (AC) IL-17A-tdTomato/IL-17F-GFP dual reporter female mice (n ≥ 9 per group) were e.c. exposed to S. aureus (1 × 10⁸ CFU) on the dorsal skin for 7 d, and a 10-mm skin biopsy was harvested. (A) Representative in vivo fluorescent images (FLI). (B) Mean total flux (photons/s) of IL-17A (tdTomato) and IL-17F (GFP) (±SEM). (C) Mean eosinophil and T cell populations as a % of CD45+IL-17+ cells in the skin (±SEM). (D) Representative immunofluorescence for IL-17A (green), EPX (eosinophils, red), and DAPI (blue) in day 7 WT S. aureus-e.c. infected skin (400× magnification) (n = 8 images). (EI) Eosinophils (1 × 10⁶) from female IL-5tg mice were adoptively transferred into female IL-17A/F–/– mice, which were e.c. exposed with S. aureus (1 × 10⁸ CFU) for 7 d in the presence of IL-17A/F neutralizing or isotype control mAbs (n = 10 per group). (E) Eosinophil adoptive transfer experiment timeline. (F) Representative skin photographs. (G) Mean disease score (±SEM). (H) Representative histology (H&E stain, 200× magnification) and (I) mean epidermal thickness (±SEM). ns; not significant, *P < 0.05; **P < 0.01; ****P < 0.0001 as calculated by two-tailed Student’s t test (B, C, F, and H). Scale bars are 100 µm in (G). Data are combined from at least two independent experiments. (Scale bars are 100 µm.)
Fig. 4.
Fig. 4.
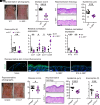
IL-36R promotes CCL7-mediated eosinophil trafficking to the skin and skin inflammation. (AG) WT and IL-36R–/– female mice were e.c. exposed to S. aureus (1 × 10⁸ CFU) on the dorsal skin for 7 d, and 10-mm skin biopsies were harvested (n ≥ 9 per group). (A) Representative skin photographs. (B) Mean disease score (±SEM). (C) Representative histology (H&E stain, 200× magnification). (D) Mean epidermal thickness (±SEM). (E) Mean numbers of eosinophils (±SEM) in the skin as measured by FACS. Relative normalized expression of (F) eosinophil-related and (G) IL-17A/F genes in the skin (±SEM), normalized to β-actin in WT skin. (H) Representative skin immunofluorescence of naive, WT, IL-36R–/–, and K14-IL-36R–/– skin for CCL7 (green) and DAPI (blue) at 400× magnification. The dotted lines represent the epidermal-dermal junction (n = 4 stained sections per group). (IM) WT female mice were e.c. exposed to S. aureus (1 × 10⁸ CFU) on the dorsal skin for 7 d and were treated with anti-CCL7 neutralizing antibody (20 µg) or isotype control mAbs on days 1, 2, and 5 (n ≥ 8 per group). (I) Representative skin photographs. (J) Mean disease score (±SEM). (K) Representative histology (H&E stain, 200× magnification). (L) Mean epidermal thickness (±SEM). (M) Mean numbers of eosinophils (±SEM) in the skin as measured by FACS. n.s.; not significant, *P < 0.05; **P < 0.01; ***P < 0.001; ****P < 0.0001 as calculated by two-tailed Student’s t test (B, DG, J, L, and M). Scale bars are 100 µm in (C, H, and K). Data are combined from at least two independent experiments.
Fig. 5.
Fig. 5.
S. aureus proteases degrade skin barrier integrity and induce IL-36α production in keratinocytes. WT female mice were e.c. exposed to the parent or Δproteases S. aureus strain (1 × 10⁸ CFU) for 7 d, and a 10-mm skin biopsy was harvested (n ≥ 9 per group). (A) Representative skin photographs. (B) Mean disease score (±SEM). (C) Representative histology (H&E stain, 200× magnification). (D) Mean epidermal thickness (±SEM). (E) TEWL of day 7 infected skin (±SEM). (F) Relative normalized expression of filaggrin (Flg) and desmoglein-1 (Dsg1), normalized to β-actin in parent strain–exposed skin (±SEM). (G) Representative immunofluorescence of filaggrin and desmoglein-1 (green) and DAPI (blue) at 400× magnification. The dotted lines represent the epidermal-dermal junction (n ≥ 4 per group). (H) Relative normalized IL-36α gene expression levels (±SEM), normalized to β-actin in parent strain–exposed skin (n ≥ 7 per group). (I) Representative immunofluorescence for IL-36α (green) and DAPI (blue) in the skin (400× magnification). The dotted lines represent the epidermal-dermal junction (n ≥ 8 per group). (J) Quantification of epidermal IL-36α expression levels from (F) using the raw integrated density measurement in ImageJ, normalized to the epidermal area (n ≥ 8 per group). n.s.; not significant, *P < 0.05; ****P < 0.0001 as calculated by two-tailed Student’s t test (B, DF, H, and J). Scale bars are 100 µm in (C, G, and I). Data are combined from at least two independent experiments.
Fig. 6.
Fig. 6.
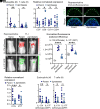
S. aureus proteases trigger IL-17A-producing eosinophil recruitment to the skin inflammation. (AC) WT female mice were e.c. exposed to the parent or Δproteases S. aureus strain (1 × 10⁸ CFU) for 7 d, and a 10-mm skin biopsy was harvested (n ≥ 9 per group). (A) Mean numbers of eosinophils and T cells (±SEM) in the skin as measured by FACS. (B) Relative normalized gene expression (±SEM) in the skin, normalized to β-actin in naive skin. (C) Representative skin immunofluorescence of CCL7 (green) and DAPI (blue) 400× magnification. The dotted lines represent the epidermal-dermal junction (n = 4 per group). (DG) IL-17A-tdTomato/IL-17F-GFP dual reporter female mice were e.c. exposed to the parent or Δproteases S. aureus strain (1 × 10⁸ CFU) on the dorsal skin for 7 d, and a 10-mm skin biopsy was harvested (n ≥ 7 per group). (D) Representative in vivo FLI. (E) Mean total flux (photons/s) of IL-17A (tdTomato) and IL-17F (GFP) (±SEM). (F) Relative normalized gene expression levels (±SEM), normalized to β-actin in S. aureus parent-exposed skin. (G) Mean numbers of IL-17A+ (tdTomato) and IL-17F+ (GFP) eosinophils and T cells (±SEM) in the skin as measured by FACS. n.s.; not significant, *P < 0.05; **P < 0.01; ***P < 0.001; ****P < 0.0001 as calculated by two-tailed Student’s t test (A, B, F, and G) or a one-way ANOVA multiple comparisons test with Tukey correction (E). Data are combined from at least two independent experiments.
Fig. 7.
Fig. 7.
Model of S. aureus–mediated skin inflammation. S. aureus proteases during e.c. exposure trigger IL-36α autocrine signaling on keratinocytes, which promotes CCL7 production and recruitment of eosinophils. In combination with T cells, IL-17A- and IL-17F-producing eosinophils drive skin inflammation.

References

    1. Turner N. A., et al. , Methicillin-resistant Staphylococcus aureus: An overview of basic and clinical research. Nat. Rev. Microbiol. 17, 203–218 (2019). - PMC - PubMed
    1. Antimicrobial Resistance Collaborators, Global burden of bacterial antimicrobial resistance in 2019: A systematic analysis. Lancet 399, 629–655 (2022). - PMC - PubMed
    1. Saheb Kashaf S., et al. , Staphylococcal diversity in atopic dermatitis from an individual to a global scale. Cell Host Microbe 31, 578–592.e6 (2023). - PMC - PubMed
    1. Pascolini C., et al. , Molecular and immunological characterization of Staphylococcus aureus in pediatric atopic dermatitis: Implications for prophylaxis and clinical management. Clin. Dev. Immunol. 2011, 718708 (2011). - PMC - PubMed
    1. Liu H., et al. , Staphylococcus aureus epicutaneous exposure drives skin inflammation via IL-36-mediated T cell responses. Cell Host Microbe 22, 653–666.e5 (2017). - PMC - PubMed

Substances

Supplementary concepts