. 2024 Feb 6;121(6):e2315990121.
doi: 10.1073/pnas.2315990121. Epub 2024 Jan 30.

Single-cell analysis of refractory anti-SRP necrotizing myopathy treated with anti-BCMA CAR-T cell therapy

Affiliations

Single-cell analysis of refractory anti-SRP necrotizing myopathy treated with anti-BCMA CAR-T cell therapy

Chuan Qin et al. Proc Natl Acad Sci U S A. .

Abstract

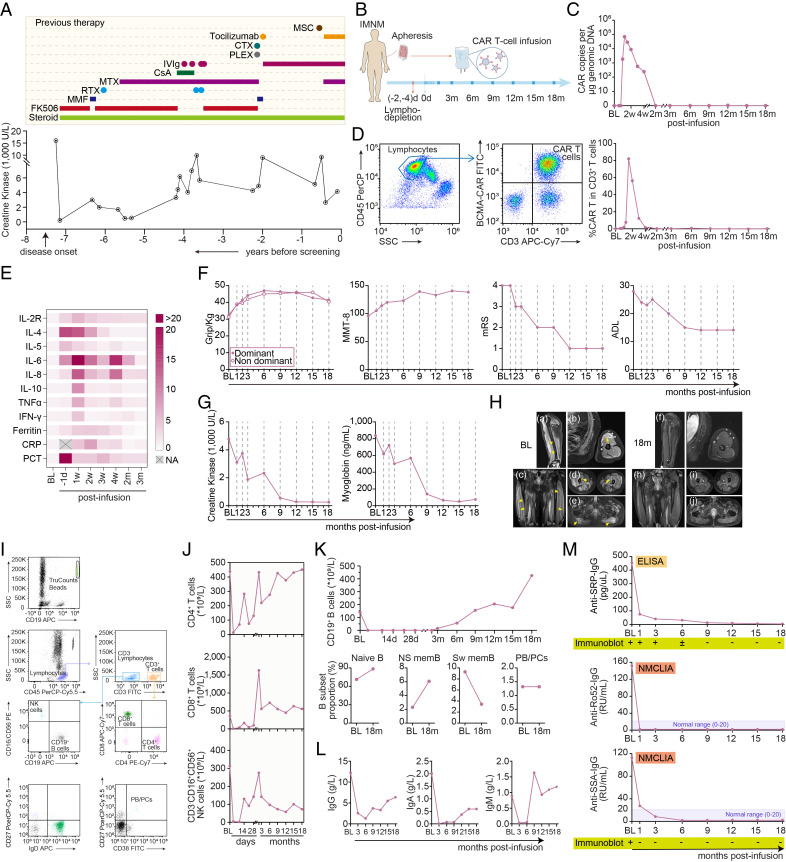
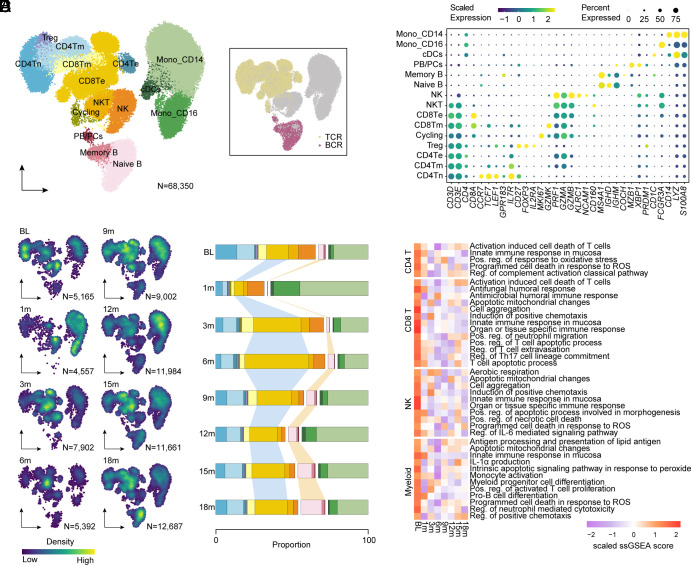
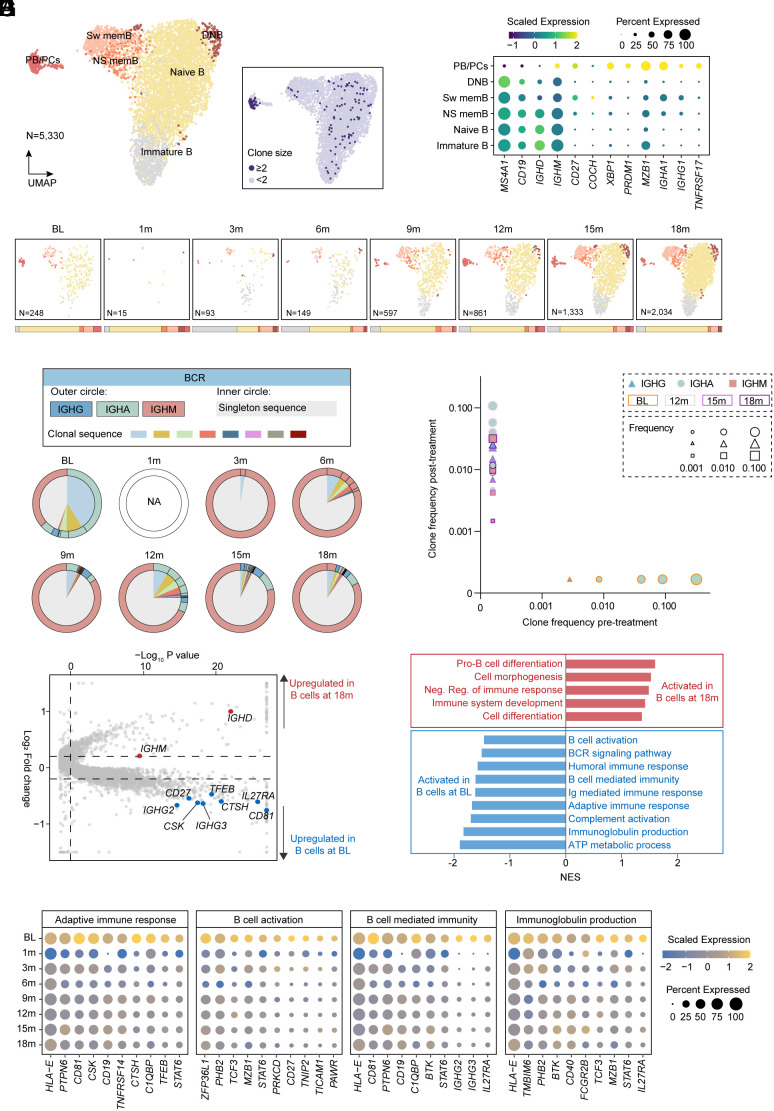
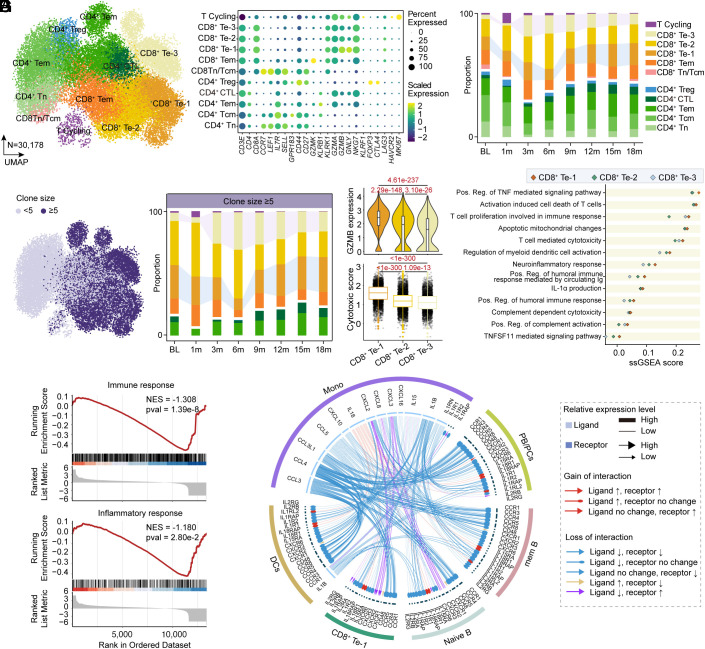
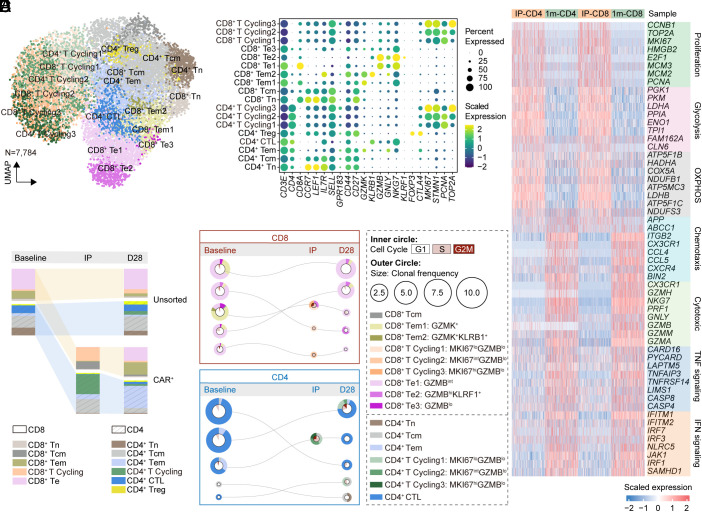
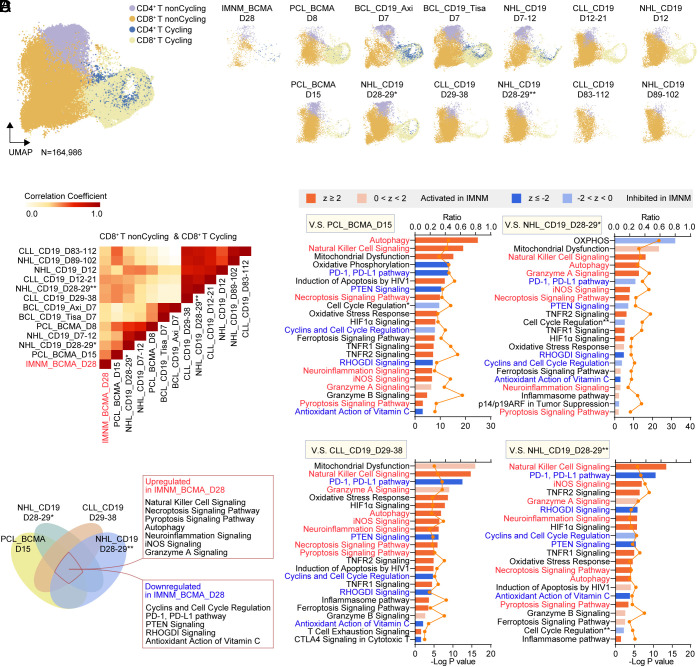
Immune-mediated necrotizing myopathy (IMNM) is an autoimmune disorder associated with the presence of autoantibodies, characterized by severe clinical presentation with rapidly progressive muscular weakness and elevated levels of creatine kinase, while traditional pharmacological approaches possess varying and often limited effects. Considering the pathogenic role of autoantibodies, chimeric antigen receptor (CAR)-T cells targeting B cell maturation antigen (BCMA) have emerged as a promising therapeutic strategy. We reported here a patient with anti-signal recognition particle IMNM refractory to multiple available therapies, who was treated with BCMA-targeting CAR-T cells, exhibited favorable safety profiles, sustained reduction in pathogenic autoantibodies, and persistent clinical improvements over 18 mo. Longitudinal single-cell RNA, B cell receptor, T cell receptor sequencing analysis presented the normalization of immune microenvironment after CAR-T cell infusion, including reconstitution of B cell lineages, replacement of T cell subclusters, and suppression of overactivated immune cells. Analysis on characteristics of CAR-T cells in IMNM demonstrated a more active expansion of CD8+ CAR-T cells, with a dynamic phenotype shifting pattern similar in CD4+ and CD8+ CAR-T cells. A comparison of CD8+ CAR-T cells in patients with IMNM and those with malignancies collected at different timepoints revealed a more NK-like phenotype with enhanced tendency of cell death and neuroinflammation and inhibited proliferating ability of CD8+ CAR-T cells in IMNM while neuroinflammation might be the distinct characteristics. Further studies are warranted to define the molecular features of CAR-T cells in autoimmunity and to seek higher efficiency and longer persistence of CAR-T cells in treating autoimmune disorders.

Keywords: B cell maturation antigen; chimeric antigen receptor (CAR) T cell; immune mediated necrotizing myopathy; single-cell RNA sequencing.


Conflict of interest statement

Competing interests statement:Wen Wang and S.-B.C. are employees of Nanjing IASO Therapeutics Ltd. and held interests in the company. Wen Wang held interests in patent applications related to the CT103A. All other authors declare no competing interest.

Figures

Fig. 1.
Fig. 1.
Clinical evaluation following CAR-T cell infusion. (A) Serum creatine kinase (CK) levels before screening, with previous immunosuppressive therapies. (B) A schematic overview of treatment procedure. (C) Kinetics of CAR copies per μg genomic DNA detected by droplet digital PCR. (D) Representative images and kinetic changes of CAR-T cells percentage in CD3+ T cells detected by flowcytometry. (E) Heatmap showing kinetic changes of inflammatory factors in blood following CAR-T cell infusion. Interleukin, IL; tumor necrosis factor, TNF; interferon, IFN; CRP, C-reactive protein; PCT, procalcitonin. Average levels are normalized from baseline. (F) Kinetic parameters measuring clinical response following CAR-T cell infusion, including the grip strength, the MMT-8 (with a maximum score of 150 when tested bilaterally without presentation of muscle weakness), modified Rankin Score (mRS) score (range 0 to 6, from health without symptoms to death), and activities of daily living (ADL) scale score (14-item, range 14 to 56, from maximal independence to maximal disability). (G) Kinetic levels of creatine kinase and myoglobin levels in serum. (H) Representative Gadolinium-enhanced T1-weighted (Gd-T1w) MR images showing abnormally enhanced signal (active lesions, arrows) in the left biceps (a and b), vastus lateralis (c), vastus intermedius (d), and gluteus maximus (e), at baseline (ae) and at 18 mo post-infusion (fj). (I and J) Representative plots of flowcytometry and kinetic changes of CD4+ T cells, CD8+ T cells, and CD3- CD16+ NK cells levels in blood at indicated time points post-infusion. (K) Kinetic changes of circulating CD19+ B cells, and the proportion of CD19+ CD27 IgD+ naive B cells, CD19+ CD27+ IgD+ non-switched memory B cells (NS mem), CD19+ CD27+ IgD switched memory B cells (Sw mem), and CD27+ CD38+ plasmablasts and plasma cells (PB/PCs) in total B cells. (L) Kinetic changes of IgG, IgA, and IgM in blood pre- and post-infusion. (M) Kinetic changes of anti-SRP-IgG, anti-Ro52-IgG, and anti-SSA-IgG levels were detected by enzyme-linked immunosorbent assay (ELISA), magnetic nanoparticle chemiluminescence immunoassay (NMCLIA), and immunoblots.
Fig. 2.
Fig. 2.
Immune alterations following CAR-T cell therapy. (A) Uniform manifold approximation and projection (UMAP) plot of 68,350 single-cell transcriptomes of peripheral blood mononuclear cells integrated from the patient with IMNM at baseline, at 1 mo, at 3 mo, at 6 mo, at 9 mo, at 12 mo, at 15 mo, and at 18 mo post-infusion. Clusters denoted by color are labeled with inferred cell types, including four CD4+ T cell clusters, two CD8+ T cell clusters, cycling cells (Cycling), NK cells, NKT cells, two monocyte clusters, conventional dendritic cells (cDCs), and three B cell clusters. UMAP of cells colored by BCR and TCR detection. (B) Dot plot showing cell clusters denoted by gene expression of known markers. (C) UMAP plots showing cell density of peripheral blood mononuclear cell (PBMC) cells integrated from the patient with IMNM at baseline, at 1 mo, at 3 mo, at 6 mo, at 9 mo, at 12 mo, at 15 mo, and at 18 mo post-infusion. (D) Bar plots of the proportion of cell types in PBMC cells integrated from the patient with IMNM at baseline, at 1 mo, at 3 mo, at 6 mo, at 9 mo, at 12 mo, at 15 mo, and at 18 mo post-infusion. (E) Heatmap showing single-sample gene set enrichment analysis (GSEA) scores of indicated signatures in CD4+ T cells, CD8+ T cells, NK cells, and myeloid cells of patient with IMNM at baseline, at 1 mo, at 3 mo, at 6 mo, at 9 mo, at 12 mo, at 15 mo, and at 18 mo post-infusion.
Fig. 3.
Fig. 3.
Compositional and clonal analysis of B lymphocytes following CAR-T cell therapy. (A) UMAP plots showing re-clustering of B cells colored by six subsets, annotated as immature, naive, non-switched memory (NS mem), switched memory (Sw mem), double negative (DN) B cells, and plasmablasts and plasma cells (PB/PCs). UMAP plot of B cell subsets colored by clone size (number of cells belonging to a specific clone type), showing significant clonal expansion. (B) Dot plot showing cell clusters denoted by gene expression of known markers. (C) UMAP plots showing cell distribution of B cells integrated from the patient with IMNM at baseline, at 1 mo, at 3 mo, at 6 mo, at 9 mo, at 12 mo, at 15 mo, and at 18 mo post-infusion. (D) Individual repertories from B cells integrated from the patient with IMNM at baseline, at 1 mo, at 3 mo, at 6 mo, at 9 mo, at 12 mo, at 15 mo, and at 18 mo post-infusion. For the inner circle, colored wedges represent expanded clones and gray area represents singleton sequence. For the outer circle, colored edges represent immunoglobulin classes. (E) Scatterplot comparing BCR clone frequencies between B cells integrated from the patient with IMNM at baseline and at 12 mo/15 mo/18 mo, respectively. (F) Volcano plot showing differential expression analysis comparing B cells integrated from the patient with IMNM at baseline to those at 18 mo post-infusion. (G) GSEA analysis showing significantly changed pathways comparing B cells integrated from the patient with IMNM at baseline to those at 18 mo post-infusion. (H) Dot plots of genes related to adaptive immune response, B cell activation, B cell-mediated immunity, and Ig production of B cells integrated from the patient with IMNM at baseline, at 1 mo, at 3 mo, at 6 mo, at 9 mo, at 12 mo, at 15 mo, and at 18 mo post-infusion.
Fig. 4.
Fig. 4.
Compositional and clonal analysis of endogenous T lymphocytes following CAR-T cell therapy. (A) UMAP plots showing re-clustering of T cells colored by 11 subsets, including five CD4+ T cell clusters, five CD8+ T cell clusters, and cycling T cells (T Cycling). (B) Dot plot showing cell clusters denoted by gene expression of known markers. (C) Bar plots of the proportion of cell types in re-clustered T cells integrated from the patient with IMNM at baseline, at 1 mo, at 3 mo, at 6 mo, at 9 mo, at 12 mo, at 15 mo, and at 18 mo post-infusion. (D) UMAP plot of T cell subsets colored by clone size, showing significant clonal expansion. Bar plots showing the frequency of clonal T cells. ≥5 clones denote clonotypes observed more than fourth time. (E) Violin plots showing GZMB (granzyme B) expression and Box plots showing signature enrichment of Cytotoxic in cells of three CD8+ Te clusters. Boxes show median, Q1 and Q3 quartiles and whiskers up to 1.5× interquartile range. Pairwise comparisons were performed using a two-sided Wilcoxon rank-sum test with a Benjamini–Hochberg correction. Scatter plot showing single-sample GSEA scores of indicated signatures (upregulated in CD8+ Te-1 cells) in cells of three CD8+ Te clusters. (F) GSEA analysis showed inhibited enrichment of immune response and inflammatory response in re-clustered T cells integrated from the patient with IMNM at 18 mo compared with those at baseline. (G) Circos plots showing gained/lost cytokine-related cell–cell communication at 18 mo post-infusion compared to baseline between CD8+ Te-1 cells and other cell types.
Fig. 5.
Fig. 5.
Transcriptional signature and clone tracking of CAR-T cells in IMNM. (A) UMAP plot of CAR-T cells in IPs and at 1 mo post-infusion and endogenous T cells at baseline and at 1 mo post-infusion. (B) Dot plot showing cell clusters denoted by gene expression of known markers. (C) Depiction of T cell subset frequencies at each timepoint. Bar widths are proportional to the fraction of cells being classified as a particular subset. (D) The top five most prevalent TCR clones identified at 1 mo post-treatment and the corresponding clones in IPs or at baseline are shown for CD8+ and CD4+ CAR-T subsets. For each, circles show the clone belongs at each timepoint, with sizes corresponding to the clone frequency in its sample. Pie charts of the inner circle showing the distribution of cells in each phase of the cell cycle. Pie charts of the outer circle showing the distribution of cell types in each subset. (E) Heatmap showing the expression of differentially expressed genes of indicated signatures shown by cells from different samples.
Fig. 6.
Fig. 6.
Distinct signatures of CAR-T cells from patients with IMNM. (A) UMAP plots showing the integrating CAR-T cells in vivo originated from patients with IMNM, leukemia, and lymphoma colored by subclusters. Single-cell transcriptomics in four recently published external datasets (GSE151310, GSE197268, GSE166352, and GSE125881), including 1) CAR-BCMA T cells collected at peak phase (day 8) and at remission phase (day 15) from one patient with plasma cell leukemia, 2) CAR-CD19 T cells collected at day 7 from 11 lymphoma patients treated with Axi-cel and CAR-CD19 T cells collected at day 7 from another 11 lymphoma patients treated with Tisa-cel, 3) CAR-CD19 T cells collected at early phase (~day 7) and at late phase (~day 28) from three NHL patients, 4) CAR-CD19 T cells collected at early phase (~day 7), at late phase (~day 28), and at very late phase (~day 90) separately from two CLL patients and two NHL patients, along with our dataset including CAR-T cells collected at 1 mo from the patient with IMNM, were used for signature validation. (IMNM: immune-mediated necrotizing myopathy; PCL: plasma cell leukemia; BCL: B cell lymphoma; NHL: non-Hodgkin lymphoma; CLL: chronic lymphocytic leukemia). (B) Heatmap showing the correlations between CD8+ CAR-T cells of integrated conditions. (C) Ingenuity pathway analysis comparing CD8+ CAR-T cells collected at 1 mo from IMNM patients with CD8+ CAR-T cells collected at late/remission phase from patients with leukemia and lymphoma. z score reflects the predicted activation level (z ≥ 2 or z ≤ −2 can be considered significant). The yellow curve denotes the ratio between the number of the differentially expressed genes (DEGs) and the total number of genes in each of these pathways. Cell Cycle Regulation*, Cell Cycle: G1/S Checkpoint Regulation; Cell Cycle Regulation**, Cell Cycle: G2/M DNA Damage Checkpoint Regulation. (D) Venn diagram showing overlapping upregulated and downregulated pathways in CD8+ CAR-T cells collected at 1 mo from IMNM patients when compared with CD8+ CAR-T cells collected at late/remission phase from patients with leukemia and lymphoma.

References

    1. Allenbach Y., Mammen A. L., Benveniste O., Stenzel W., Immune-mediated necrotizing myopathies working G 224th ENMC International Workshop: Clinico-sero-pathological classification of immune-mediated necrotizing myopathies Zandvoort, The Netherlands, 14–16 October 2016. Neuromuscul. Disord. 28, 87–99 (2018). - PubMed
    1. Anquetil C., Boyer O., Wesner N., Benveniste O., Allenbach Y., Myositis-specific autoantibodies, a cornerstone in immune-mediated necrotizing myopathy. Autoimmun. Rev. 18, 223–230 (2019). - PubMed
    1. Day J. A., Limaye V., Immune-mediated necrotising myopathy: A critical review of current concepts. Semin. Arthritis. Rheum. 49, 420–429 (2019). - PubMed
    1. Selva-O’Callaghan A., et al. , Classification and management of adult inflammatory myopathies. Lancet Neurol. 17, 816–828 (2018). - PMC - PubMed
    1. Baker D. J., June C. H., CAR T therapy extends its reach to autoimmune diseases. Cell 185, 4471–4473 (2022). - PubMed