. 2024 Feb 6;121(6):e2304619121.
doi: 10.1073/pnas.2304619121. Epub 2024 Jan 30.

Pharmacological modulation of RB1 activity mitigates resistance to neoadjuvant chemotherapy in locally advanced rectal cancer

Affiliations

Pharmacological modulation of RB1 activity mitigates resistance to neoadjuvant chemotherapy in locally advanced rectal cancer

Zhaoliang Yu et al. Proc Natl Acad Sci U S A. .

Abstract

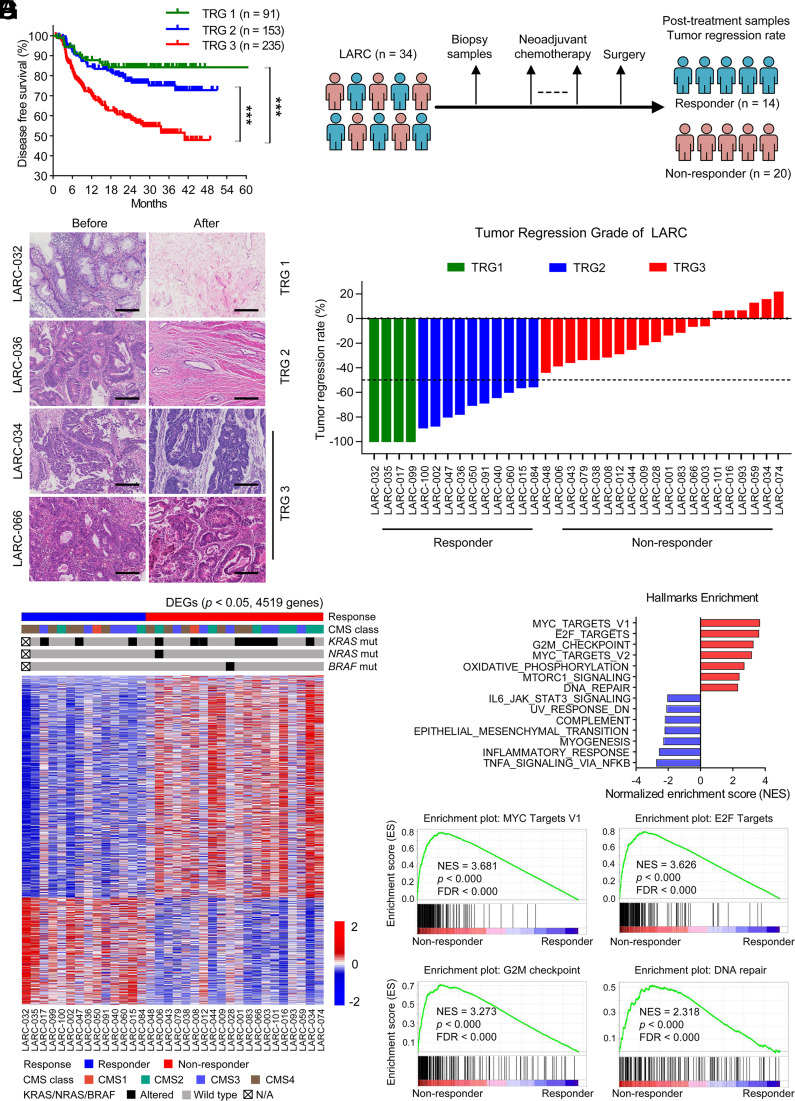
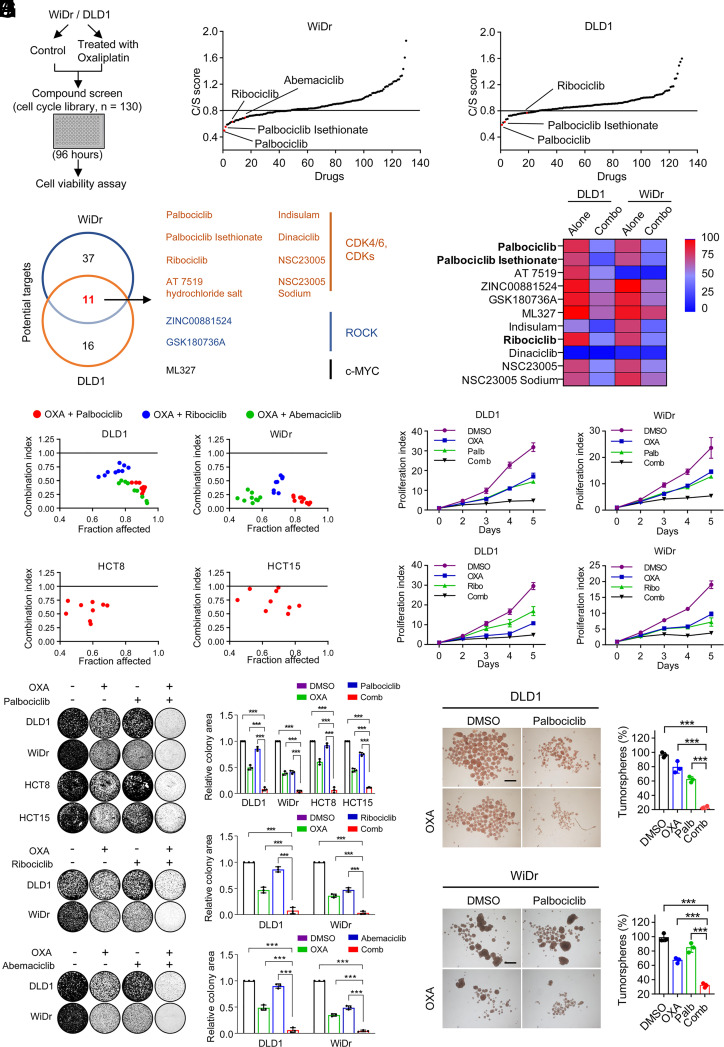
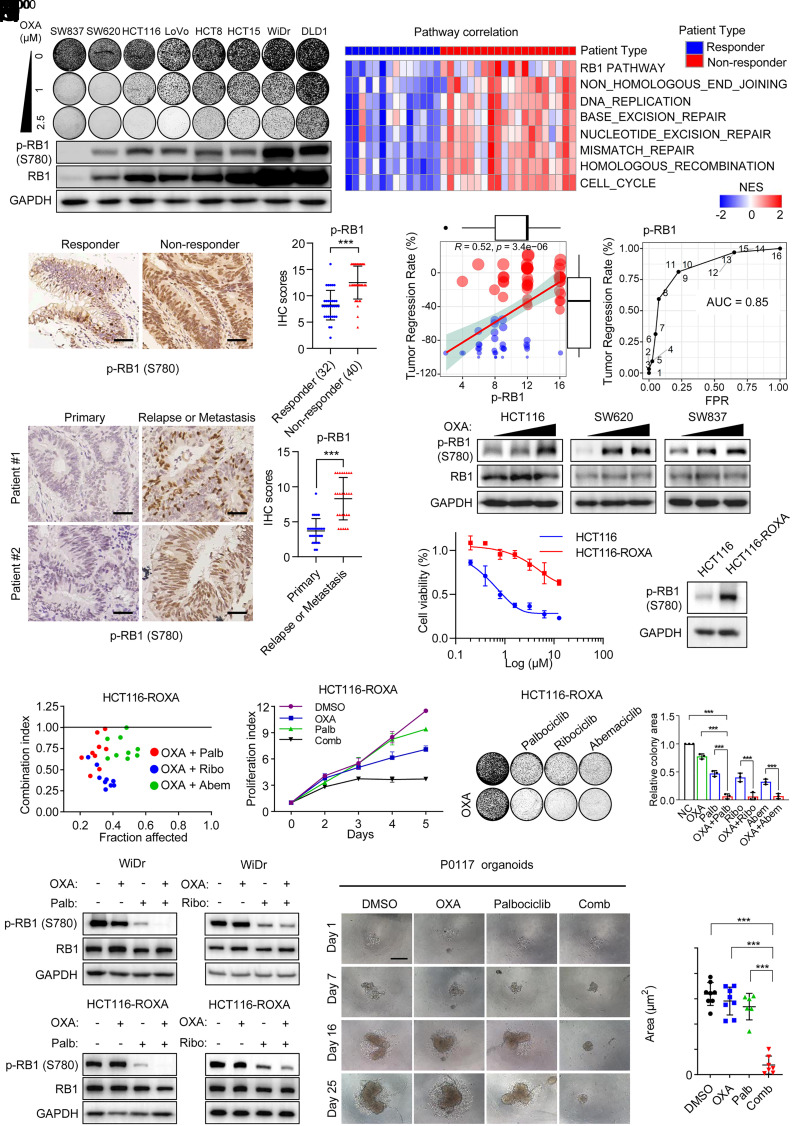
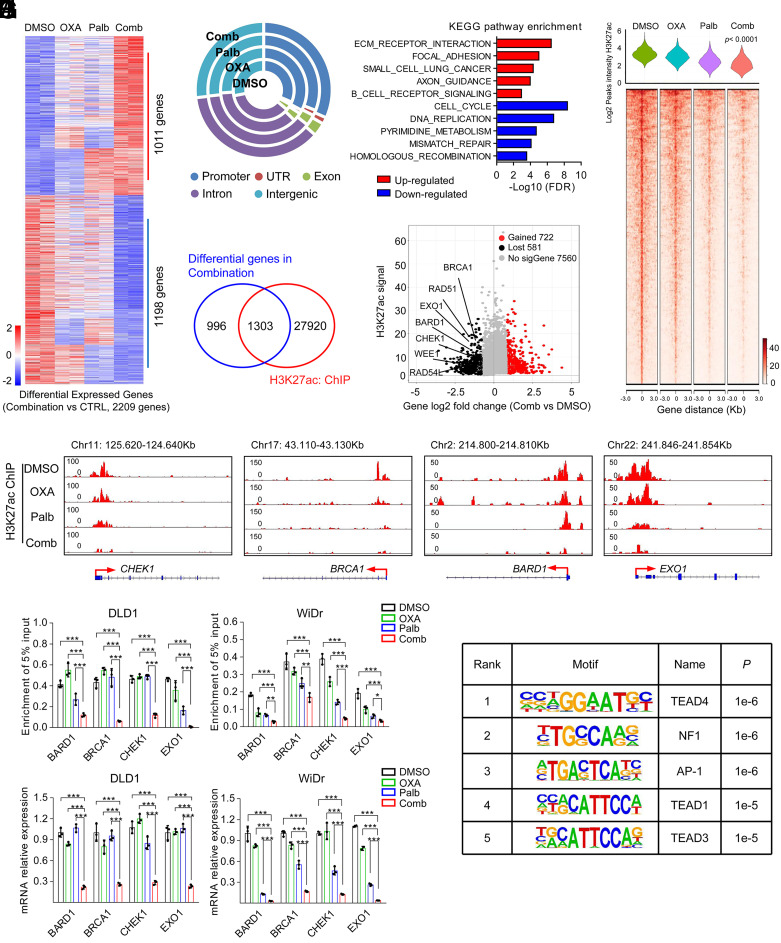
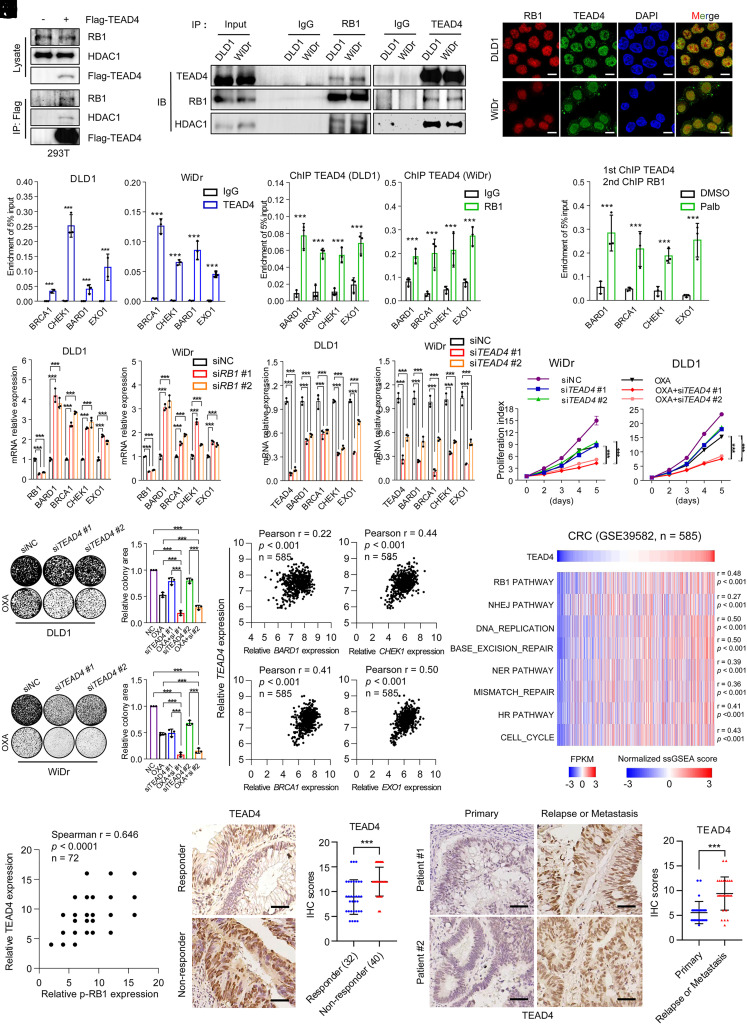
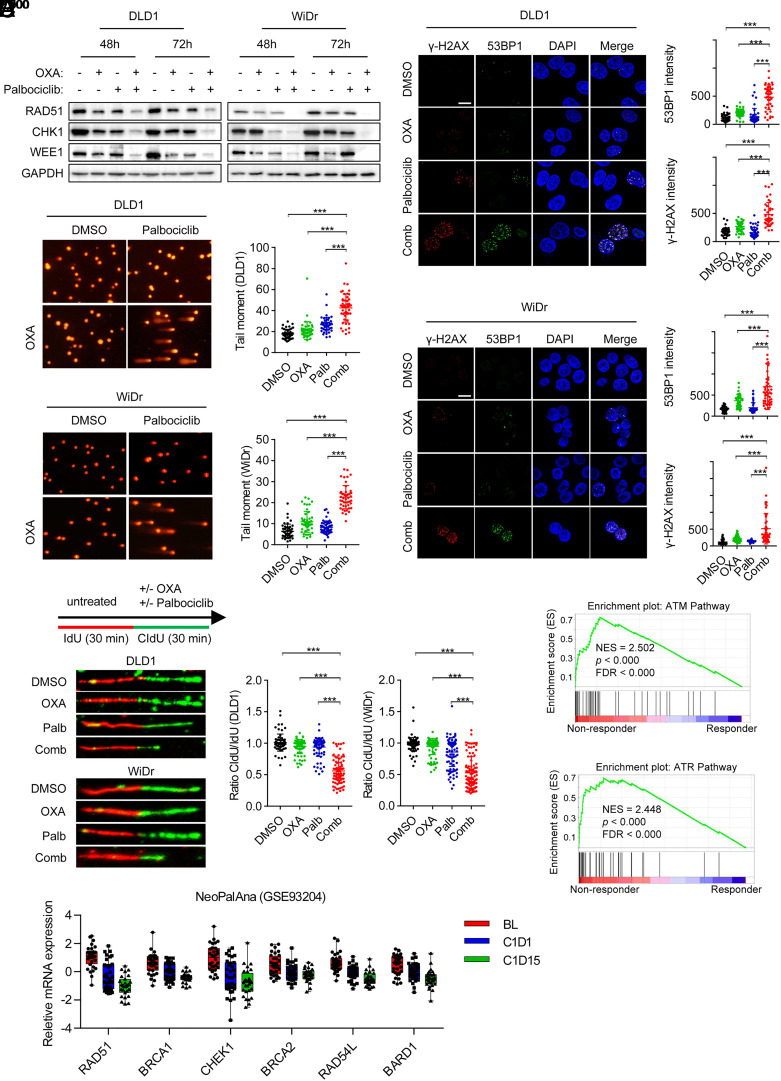
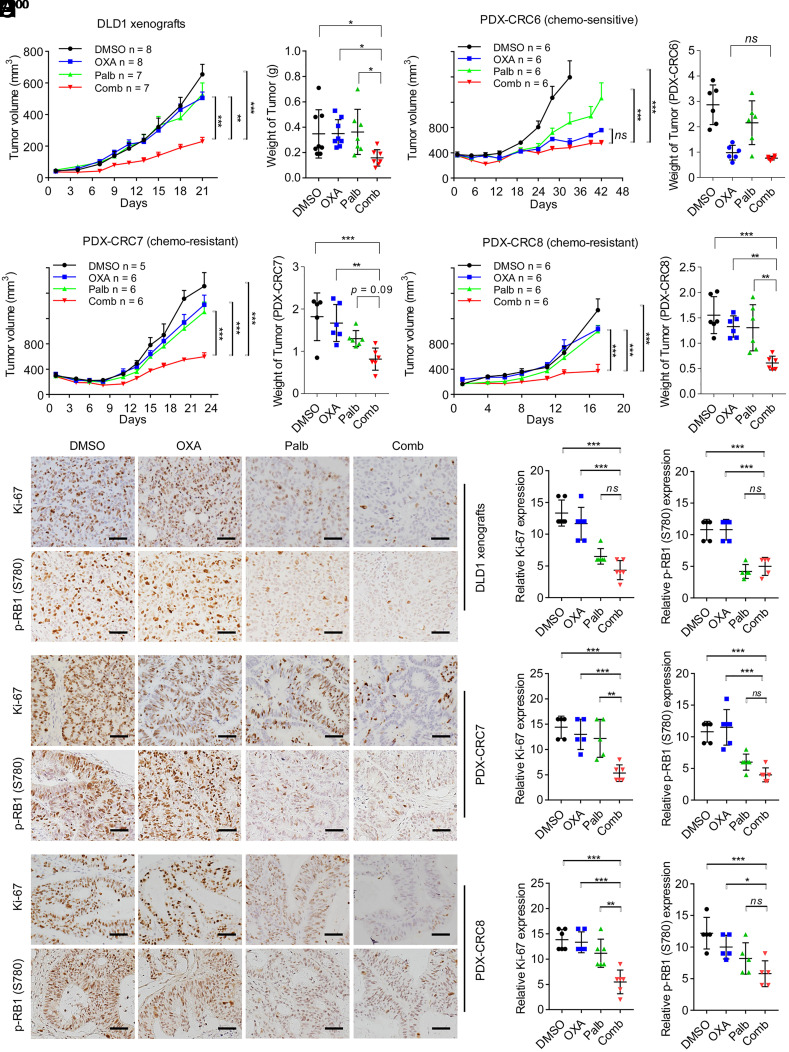
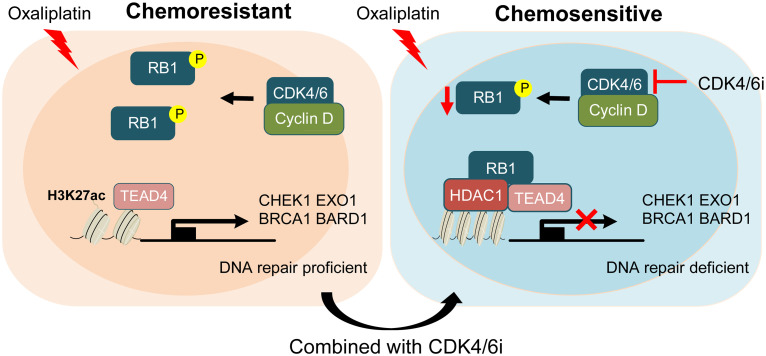
Resistance to neoadjuvant chemotherapy leads to poor prognosis of locally advanced rectal cancer (LARC), representing an unmet clinical need that demands further exploration of therapeutic strategies to improve clinical outcomes. Here, we identified a noncanonical role of RB1 for modulating chromatin activity that contributes to oxaliplatin resistance in colorectal cancer (CRC). We demonstrate that oxaliplatin induces RB1 phosphorylation, which is associated with the resistance to neoadjuvant oxaliplatin-based chemotherapy in LARC. Inhibition of RB1 phosphorylation by CDK4/6 inhibitor results in vulnerability to oxaliplatin in both intrinsic and acquired chemoresistant CRC. Mechanistically, we show that RB1 modulates chromatin activity through the TEAD4/HDAC1 complex to epigenetically suppress the expression of DNA repair genes. Antagonizing RB1 phosphorylation through CDK4/6 inhibition enforces RB1/TEAD4/HDAC1 repressor activity, leading to DNA repair defects, thus sensitizing oxaliplatin treatment in LARC. Our study identifies a RB1 function in regulating chromatin activity through TEAD4/HDAC1. It also provides the combination of CDK4/6 inhibitor with oxaliplatin as a potential synthetic lethality strategy to mitigate oxaliplatin resistance in LARC, whereby phosphorylated RB1/TEAD4 can serve as potential biomarkers to guide the patient stratification.

Keywords: CDK4/6 inhibitor; drug resistance; locally advanced rectal cancer; neoadjuvant chemotherapy.


Conflict of interest statement

Competing interests statement:The authors declare no competing interest.

Figures

Fig. 1.
Fig. 1.
Aberrant hyperactivity of cell cycle pathways correlates with resistance to neoadjuvant chemotherapy in LARC. (A) DFS curves according to tumor regression grading (TRG), time-to-event plots were prepared using the Kaplan–Meier method, ***P < 0.001. (B) Schematic model of sample collection. Thirty-four patients with LARC who received neoadjuvant chemotherapy were included, and pretreatment biopsy samples were collected. Based on rigorously evaluated postoperative pathological evidence, patients were classified into a response group (n = 14) and a nonresponse group (n = 20). (C) The representative pathological images from TRG1-3 patients. (Scale bar, 200 μm.) (D) Waterfall plot showing the tumor regression rates of LARC patients. (E) Heatmap showing the CMS subtypes, RAS and BRAF mutation status, and DEGs between responders and nonresponders. (F) The top seven up/down enrichment pathways in nonresponders versus responders. (G) GSEA pathway analysis in cell cycle–related pathways in nonresponders compared with responders.
Fig. 2.
Fig. 2.
Combinatorial drug screen identifies CDK4/6 inhibitors as sensitizers to oxaliplatin in CRC cells. (A) The outline of the drug-screening procedure. DLD1 or WiDr cells were seeded in 96-well plates and treated with 130 kinase inhibitors that target cell cycle pathways (1.0 μM) in the presence or absence of oxaliplatin (2.5 μM for DLD1; 1.0 μM for WiDr) during the primary drug screening. (B) Graph showing the results of a drug screening performed in WiDr and DLD1 with 130 compounds either singly or in combination with oxaliplatin. A total of 130 drugs on screen are ranked according to the C/S (combination/single) score. CDK4/6 inhibitors were highlighted in red. (C) Eleven common drugs (C/S score < 0.8) were identified through drug screen in WiDr and DLD1 cells. (D) The heatmap indicates the survival rate of DLD1 and WiDr treated with eleven common drugs (1.0 μM) from the second screen in the presence or absence of oxaliplatin (2.5 μM for DLD1; 1.0 μM for WiDr) for 4 d. (E and F) CI of CDK4/6 inhibitors and oxaliplatin in intrinsic resistant cell lines. Data represent the mean of three biological replicates. CI greater than 1 was defined as antagonism; CI less than 1 was defined as synergy. (G and H) The growth curve of DLD1 and WiDr with CDK4/6 inhibitors (palbociclib 1.0 μM for DLD1 and 0.5 μM for WiDr; ribociclib 1.0 μM for DLD1 and WiDr) combined with oxaliplatin (2.5 μM for DLD1; 1.0 μM for WiDr) of indicated concentration. Data are presented as the mean ± SD (n = 3). (I) Representative images of the colony formation assay in intrinsically resistant cells treated with DMSO, CDK4/6 inhibitors (palbociclib 1.0 μM for DLD1, HCT8, and HCT15; palbociclib 0.5 μM for WiDr; ribociclib 1.0 μM and abemaciclib 0.5 μM for DLD1 and WiDr), oxaliplatin (2.5 μM for DLD1; 1.0 μM for WiDr, HCT8, and HCT15), or their combination. (J) Representative images of the tumorsphere formation assay in DLD1 and WiDr cells treated with DMSO, palbociclib (1.0 μM for DLD1; 0.5 μM for WiDr), oxaliplatin (2.5 μM for DLD1; 1.0 μM for WiDr), or their combination. (Scale bar, 500 μm.) All data are representative of three independent experiments (GJ).
Fig. 3.
Fig. 3.
Increased phosphorylation of RB1 is associated with resistance to chemotherapy. (A) Colony formation assay of indicated CRC cell lines treated with different doses of oxaliplatin (Up). IB analysis of p-RB1 (S780) in these cancer cell lines (Down). (B) Heatmap of NES values in GSEA analysis of tumors from nonresponders compared with responders using KEGG and the Pathway Interaction Database (PID) pathway analysis. (C) Representative IHC images for p-RB1 (S780) in LARC tissues of responder and nonresponder (Left). (Scale bar, 50 μm.) IHC scores of p-RB1 in LARC tissues of responders (n = 32) and nonresponders (n = 40) (Right). (D) Correlation between p-RB1 IHC scores with tumor regression rates. (E) ROC curve plotting false-positive rate (FPR) against true-positive rate (TPR). The numbers along the ROC curve are different IHC cutoff values. AUC: area under the curve, ranging from 0 to 1. (F) Representative IHC images for p-RB1 (S780) in primary and relapse or metastasis tissues from the same patient (paired samples, n = 27). (Scale bar, 50 μm.) (G) IB analysis of p-RB1 (S780) and RB1 in HCT116, SW620 and SW837 cells treated with indicated concentrations of oxaliplatin (0, 0.5 μM, 1.0 μM for HCT116 and SW620; 0, 0.25 μM, 0.5 μM for SW837) for 8 d. Immunoblots shown are representative immunoblots from three independent experiments. (H) HCT116 and HCT116-ROX cells were treated with the indicated concentrations of oxaliplatin. The number of viable cells was measured at 96 h. Data represent the mean of three biological replicates. (I) IB analysis of p-RB1 (S780) in HCT116-ROXA cells. Immunoblots shown are representative immunoblots from three independent experiments. (J) CI of CDK4/6 inhibitors and oxaliplatin in HCT116-ROXA cell lines. Data represent the mean of three biological replicates. (K) The growth curve of HCT116-ROXA treated with CDK4/6 inhibitors (palbociclib 0.5 μM) in combination with oxaliplatin (5.0 μM) for 5 d. Data are presented as the mean ± SD (n = 3). (L) Representative images of the colony formation assay in HCT116-ROXA cells treated with DMSO, CDK4/6 inhibitors (palbociclib 0.5 μM, ribociclib 0.5 μM, abemaciclib 0.1 μM), oxaliplatin (5.0 μM), or their combination for 10 d. (M and N) IB analysis of p-RB1 (S780) and RB1 in intrinsic resistant cells (K) and acquired resistance cells (L) treated with DMSO, CDK4/6 inhibitors (palbociclib 0.5 μM, ribociclib 0.5 μM), oxaliplatin (5.0 μM for HCT116-ROXA; 1.0 μM for WiDr), or their combination for 24 h. (O) Representative images of P0117 organoid treated with DMSO, palbociclib (0.5 μM), oxaliplatin (10 μM), or their combination. (Scale bar, 200 μm.) Statistical analysis of the PDOs, one dot represents one organoid (Right). ***P < 0.001, one-way ANOVA with Dunnett’s multiple comparison test.
Fig. 4.
Fig. 4.
CDK4/6 inhibitors epigenetically suppress expression of DNA repair genes. (A) The heatmap showed the differential expressed genes in DLD1 cells treated with DMSO, CDK4/6 inhibitors (palbociclib 1.0 μM), oxaliplatin (2.5 μM), or their combination. (B) Genomic distribution of H3K27ac peaks in DLD1 cells treated with DMSO, CDK4/6 inhibitors, oxaliplatin, or their combination. (C) Venn diagram showing the number and overlaps of DEGs and H3K27ac annotated genes obtained from ChIP-seq results. (D) The top five up/down KEGG pathway enrichment in combination treatment versus DMSO. (E) Heatmap showing the binding patterns for H3K27ac at accessible regions of 581 down-regulated genes. (F) Scatterplot of the correlation between H3K27ac mark intensity and fold change of corresponding gene expressions. The vertical axis illustrates the absolute value of H3K27ac signal between DMSO and combination treatment group. (G) ChIP-seq profiles show the ChIP-seq signal (y axis, reads per million) for H3K27ac and RB1 at genomic loci of CHEK1, BRCA1, BARD1, and EXO1. (H) ChIP qPCR analysis of H3K27ac occupancy at genomic loci of CHEK1, BRCA1, BARD1, and EXO1 in DLD1 and WiDr cells treated with DMSO, CDK4/6 inhibitors (palbociclib 1.0 μM for DLD1; 0.5 μM for WiDr), oxaliplatin (2.5 μM for DLD1; 1.0 μM for WiDr), or their combination. Data are presented relative to input and shown as mean ± SD of technical triplicates. (I) qRT-PCR validation of CHEK1, BRCA1, BARD1 and EXO1 in DLD1 and WiDr cells treated with DMSO, CDK4/6 inhibitors (palbociclib 1.0 μM for DLD1; 0.5 μM for WiDr), oxaliplatin (2.5 μM for DLD1; 1.0 μM for WiDr), or their combination. Data are shown as mean ± SD of technical triplicates. *P < 0.05, **P < 0.01, ***P < 0.001, one-way ANOVA with Dunnett’s multiple comparisons test (H and I). (J) DNA motif analysis in H3K27ac ChIP-seq peaks showing the significant enrichment of TEAD4 motif (Hypergeometric test).
Fig. 5.
Fig. 5.
RB1 directly interacts with the HDAC1/TEAD4 transcriptional corepressor complex to suppress DNA repair genes. (A) Co-IP shows the interaction of Flag-tagged TEAD4 in 293T cells. (B) Co-IP with anti-IgG, anti-TEAD4, and anti-RB1 antibodies followed by IB with antibodies against the indicated proteins using cell extracts from DLD1 and WiDr cells. (C) Representative IF images of DLD1 and WiDr cells stained with RB1 and TEAD4. (D) Chromatin extracts from DLD1 and WiDr cells were subjected to ChIP using anti-TEAD4 antibody or normal IgG. Data are presented relative to input and shown as mean ± SD of technical triplicates. (E) Re-ChIP analysis showing the concurrent presence of both TEAD4 and RB1 at genomic loci of CHEK1, BRCA1, BARD1, and EXO1 in DLD1 and WiDr cells. Data are presented relative to input and shown as mean ± SD of technical triplicates. (F) Re-ChIP analysis showing the concurrent presence of both TEAD4 and RB1 at genomic loci of CHEK1, BRCA1, BARD1, and EXO1 in DLD1 treated with DMSO or palbociclib 1.0 μM for 24 h. Data are presented relative to input and shown as mean ± SD of technical triplicates. (G) qRT-PCR validation of CHEK1, BRCA1, BARD1, and EXO1 in DLD1 and WiDr cells infected with control siRNA or RB1 siRNA. (H) qRT-PCR validation of CHEK1, BRCA1, BARD1, and EXO1 in DLD1 and WiDr cells infected with control siRNA or TEAD4 siRNA. (I) The growth curve of DLD1 and WiDr with siNC, siTEAD4, oxaliplatin (2.5 μM for DLD1; 1.0 μM for WiDr), or their combination. Data are presented as the mean ± SD (n = 3). ***P < 0.001, two-way ANOVA with Dunnett’s multiple comparisons test. (J) Colony formation assay of cells treated with siNC, siTEAD4, oxaliplatin (2.5 μM for DLD1; 1.0 μM for WiDr), or their combination. (K) Positive correlations (by Pearson’s) between TEAD4 and CHEK1, BRCA1, BARD1, EXO1 in CRC patient samples. Data were derived from the GSE39582 dataset. (L) Heatmap of normalized ssGSEA scores in DNA repair–related pathways of CRC tumors, which were listed according to the relative TEAD4 expression. Data were derived from the GSE39582 dataset. (M) Positive correlation (by Spearman’s) between TEAD4 and p-RB1 expression detecting by IHC staining in LARC. (N) Representative IHC images for TEAD4 in LARC tissues of responders (n = 32) and nonresponders (n = 40) (Left). (Scale bar, 50 μm.) IHC scores of TEAD4 in LARC tissues of responders and nonresponders (Right). (O) Representative IHC images for TEAD4 in primary and relapse or metastasis tissues from the same patient (n = 27). (Scale bar, 50 μm.)
Fig. 6.
Fig. 6.
Combination treatment of CDK4/6 inhibitor and oxaliplatin result in defective DNA repair. (A) Immunoblot analysis of DLD1 and WiDr cells treated with DMSO, palbociclib (1.0 μM for DLD1; 0.5 μM for WiDr), oxaliplatin (2.5 μM for DLD1; 1.0 μM for WiDr), or their combination at different time points. (B) Comet assay in DLD1 and WiDr cells treated with DMSO, palbociclib (1.0 μM for DLD1; 0.5 μM for WiDr), oxaliplatin (2.5 μM for DLD1; 1.0 μM for WiDr), or their combination for 24 h (Left). Quantification of comet tail moment, n = 50 (Right). (C) Representative IF images of DLD1 and WiDr cells stained with cell mask phosphorylated H2AX (γH2AX), 53BP1, and DAPI. [Scale bar, 10 μm (Left).] Quantification of γH2AX and RAD51 signal intensity in cells with DMSO, palbociclib (1.0 μM for DLD1; 0.5 μM for WiDr), oxaliplatin (2.5 μM for DLD1; 1.0 μM for WiDr), or their combination, n = 50 (Right). (D) Cells were sequentially labeled with 20 μM IdU for 30 min, followed by 200 μM CIdU and treatment with DMSO, palbociclib (1.0 μM for DLD1; 0.5 μM for WiDr), oxaliplatin (2.5 μM for DLD1; 1.0 μM for WiDr), or their combination. The DNA fibers were spread and subjected to IF using anti-BrdU antibodies specifically recognizing CldU or IdU. For each group, a CIdU/ldU ratio of >100 individual DNA fibers is presented and the mean CIdU/ldU ratio is shown. ***P < 0.001, one-way ANOVA with Dunnett’s multiple comparisons test. (E) PID pathway analysis enriched by up-regulated genes in nonresponders showed that the ATM pathway and ATR pathway were significantly enriched. (F) Expression of DNA repair genes in primary breast cancers of patients at baseline (BL), 4 wk after anastrozole treatment (C1D1) and 6 wk after combination of anastrazole and palbociclib (C1D15) in the NeoPalAna trial (n represents the number of patient biopsies, noted in each graph). Means ± SD of relative microarray reads are shown. All data are representative from three independent experiments (AD).
Fig. 7.
Fig. 7.
CDK4/6 inhibitor resensitizes CRC to oxaliplatin in vivo. (A and B) The growth curve of tumor volume (A) and weight of tumor (B) with the treatment of vehicle, CDK4/6 inhibitors, oxaliplatin, or their combination in DLD xenografts. Error bars represent ± SEM. (C and D) The growth curve of tumor volume (C) and weight of tumor (D) with the treatment vehicle, CDK4/6 inhibitors, oxaliplatin, or their combination in the PDX-CRC6 model. (E and F) The growth curve of tumor volume (E) and weight of tumor (F) with the treatment of vehicle, CDK4/6 inhibitors, oxaliplatin, or their combination in the PDX-CRC7 model. (G and H) The growth curve of tumor volume (G) and weight of tumor (H) in vivo efficacy of vehicle, CDK4/6 inhibitors, oxaliplatin, or their combination in the PDX-CRC8 model. *P < 0.05, **P < 0.01, and ***P < 0.001, one-way ANOVA with Dunnett’s multiple comparisons test (B, D, F, and H), and two-way ANOVA with Dunnett’s multiple comparisons test (A, C, E, and G). (I) Representative IHC staining of Ki-67 and p-RB1 in DLD1 xenografts, PDX-CRC7 and PDX-CRC8. (The scale bar, 50 μm.) Relative Ki-67 and p-RB1 expression in four groups of DLD1 xenograft tumors, PDX-CRC7 and PDX-CRC8 (Right). *P < 0.05, **P < 0.01, and ***P < 0.001, one-way ANOVA with Dunnett’s multiple comparisons test.
Fig. 8.
Fig. 8.
Schematic model illustrating the role of CDK4/6 inhibitors in overcoming oxaliplatin resistance in LARC. Aberrant hyperactivity of RB1-related cell cycle pathways and TEAD4 expression correlate with resistance to oxaliplatin-based chemotherapy in LARC (Left). CDK4/6 inhibitors epigenetically suppress expression of DNA repair genes through the RB1/TEAD4/HDAC1 repressive complex to induce DNA repair defects (Right). Thus, CDK4/6 inhibitors combined with oxaliplatin represent a promising strategy for improving oxaliplatin-based therapeutic efficacy in the clinic.

Similar articles

Cited by

References

    1. Bray F., et al. , Global cancer statistics 2018: GLOBOCAN estimates of incidence and mortality worldwide for 36 cancers in 185 countries. CA Cancer J. Clin. 68, 394–424 (2018). - PubMed
    1. Body A., et al. , Neoadjuvant therapy for locally advanced rectal cancer: Recent advances and ongoing challenges. Clin. Colorectal Cancer 20, 29–41 (2021). - PubMed
    1. Ali F., Keshinro A., Weiser M. R., Advances in the treatment of locally advanced rectal cancer. Ann. Gastroenterol. Surg. 5, 32–38 (2021). - PMC - PubMed
    1. Cercek A., et al. , PD-1 blockade in mismatch repair-deficient, locally advanced rectal cancer. N. Engl. J. Med. 386, 2363–2376 (2022), 10.1056/NEJMoa2201445. - DOI - PMC - PubMed
    1. Alatise O. I., et al. , Molecular and phenotypic profiling of colorectal cancer patients in West Africa reveals biological insights. Nat. Commun. 12, 6821 (2021). - PMC - PubMed

MeSH terms