. 2024 Jan 30;134(7):e173782.
doi: 10.1172/JCI173782.

mTORC1 controls murine postprandial hepatic glycogen synthesis via Ppp1r3b

Affiliations

mTORC1 controls murine postprandial hepatic glycogen synthesis via Ppp1r3b

Kahealani Uehara et al. J Clin Invest. .

Abstract

In response to a meal, insulin drives hepatic glycogen synthesis to help regulate systemic glucose homeostasis. The mechanistic target of rapamycin complex 1 (mTORC1) is a well-established insulin target and contributes to the postprandial control of liver lipid metabolism, autophagy, and protein synthesis. However, its role in hepatic glucose metabolism is less understood. Here, we used metabolomics, isotope tracing, and mouse genetics to define a role for liver mTORC1 signaling in the control of postprandial glycolytic intermediates and glycogen deposition. We show that mTORC1 is required for glycogen synthase activity and glycogenesis. Mechanistically, hepatic mTORC1 activity promotes the feeding-dependent induction of Ppp1r3b, a gene encoding a phosphatase important for glycogen synthase activity whose polymorphisms are linked to human diabetes. Reexpression of Ppp1r3b in livers lacking mTORC1 signaling enhances glycogen synthase activity and restores postprandial glycogen content. mTORC1-dependent transcriptional control of Ppp1r3b is facilitated by FOXO1, a well characterized transcriptional regulator involved in the hepatic response to nutrient intake. Collectively, we identify a role for mTORC1 signaling in the transcriptional regulation of Ppp1r3b and the subsequent induction of postprandial hepatic glycogen synthesis.

Keywords: Endocrinology; Glucose metabolism; Insulin signaling; Metabolism.


Conflict of interest statement

Conflict of interest: DJR owns equity in Alnylam and Verve Therapeutics. JDR is a cofounder, stockholder, and director of Raze Therapeutics and Farber Partners and is an advisor and stockholder in Faeth Therapeutics, Empress Therapeutics, Bantam Pharmaceuticals, Colorado Research Partners, Rafael Pharmaceuticals, and L.E.A.F. Pharmaceuticals.

Figures

Figure 1
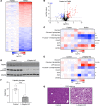
Figure 1. Postprandial metabolomics reveal increased glycogen precursors in the absence of mTORC1 activity.
(AC) Mice aged 10 to 12 weeks were fasted for 16 hours (Fasted) then given food for 4 hours (Refed). (A) Heat map of differential metabolite abundance shown as log2 (FC) compared with fasted livers. (B) Volcano plot showing –log10(P value versus fasted) on y-axis and log2 (FC versus fasted) on x-axis. Blue dots represent log2 (FC) < –2, P < 0.01. Red dots represent llog2 (FC) > 2, and P < 0.01. (C) The relative abundance of selected glucose metabolites. (DG) RptorloxP/loxP mice aged 10–12 weeks were injected with AAV8-TBG-Cre (L-Raptor-KO) or AAV8-TBG-GFP (Control). Two weeks after injection, mice were fasted overnight, then chow was reintroduced for 4 hours before sacrifice. (D) Immunoblot demonstrating loss of Raptor protein and inhibition of mTORC1 signaling. (E) Heat map of selected glucose metabolite relative abundance shown as log2 (FC) compared with control fed livers. (F) Hepatic glycogen in fed livers. Data shown as mean ± SEM. (G) PAS staining for glycogen (pink). Scale bar: 400 μm. *P < 0.05, **P < 0.01, ***P < 0.001, ****P < 0.0001 versus WT fasted via student’s t test. Red indicates higher metabolite abundance.
Figure 2
Figure 2. mTORC1 is required for hepatic glycogen synthesis.
(A) RptorloxP/loxP or Gck loxP/loxP mice aged 10–12 weeks were injected with AAV-TBG-GFP (Control) or AAV-TBG-Cre (L-Raptor-KO or L-GCK-KO). (A and B) Two weeks after AAV injection, mice were fasted overnight and refed for 4 hours before sacrifice. (A and B) Gene expression of Srebp1c and Gck (glucokinase). (C) Immunoblot of GCK protein, activation of AKT, and inhibition of mTORC1 signaling. (DF) Two weeks after AAV injection, mice were fasted overnight and subjected to oral gavage with 2 g/kg U-13C-D-glucose. Mice were sacrificed and livers were harvested 30 minutes after oral gavage. (D and E) Total ion count of hexose phosphate and UDP-glucose and respective mass isotopomer distribution in liver tissue. (F) Hepatic glycogen labeling representing the average carbon labeling enrichment of glycogen from oral gavage of [U-13C]-glucose normalized to plasma glucose labeling (Supplemental Figure 2, A and B). **P < 0.01 versus control mice, ****P < 0.0001 versus control fed mice via 2-way ANOVA (A and B) or students t test (DF). Data show in ± SEM.
Figure 3
Figure 3. mTORC1 controls glycogenesis through regulation of GS activity.
(AE) RptorloxP/loxP mice aged 10–12 weeks were injected with AAV8-TBG-Cre (L-Raptor-KO) or AAV8-TBG-GFP (control). Two weeks after injection, mice were fasted overnight (fasted), or reintroduced to food for 4 hours (refed) before sacrifice. (A) Immunoblot of lysates from refed livers. (BD) Relative mRNA expression of G6pc (glucose-6-phosphatase), Gys2 (glycogen synthase), and Pygl (glycogen phosphorylase), respectively. (E) GS activity measured as a ratio in the presence or absence of saturated G6P. **P < 0.01, ***P < 0.001, ****P < 0.0001, via 2-way ANOVA. Data shown in ± SEM.
Figure 4
Figure 4. Restoration of Ppp1r3b in L-Raptor-KO livers promotes GS activity and glycogen storage.
RptorloxP/loxP mice aged 10–12 weeks were injected with AAV8-TBG-GFP (control), AAV8-TBG-Cre in combination with AAV8-TBG-GFP (L-Raptor-KO), or AAV8-TBG-Cre in combination with AAV8-TBG-Ppp1r3b (L-Raptor-KO + Ppp1r3b), 2 weeks prior to an overnight fast and 4 hour period where food was reintroduced (refed). (A) Relative mRNA expression of Ppp1r3b. (B) Experimental schematic. (C) Immunoblot of liver lysate, indicating inhibition of mTORC1 signaling following coinjections of AAV, and changes in phosphorylation of GS. (D) GS activity measured as a ratio in the presence or absence of saturated G6P in refed livers. (E) Hepatic glycogen measured in fed livers. (F) Blood glucose measurement at indicated time following food removal. At hour 16, mice were given food, as indicated by “feeding” notation in the gray area. ##, n=5,5,3 (Control, L-Raptor-KO, L-Raptor-KO + PPP1R3B, respectively. *P < 0.05, **P < 0.01, ***P < 0.001, ****P < 0.0001 versus indicated genotype via 2-way ANOVA (A) or 1-way ANOVA (DF). Data shown in ± SEM.
Figure 5
Figure 5. mTORC1 activity is required for AKT-mediated inhibition of FOXO1.
(AC) Genome browser track (mm9) GRO-Seq displaying Ppp1r3b and nearby eRNA corresponding with a FOXO1 ChIP-Seq track with previously identified FOXO1 binding highlighted in gray near genes (A) Ppp1r3b, (B) Igfbp1, and (C) Gck. (D) mRNA expression of Igfbp1 in refed L-Raptor-KO livers. (E) Immunoblot of FOXO1 from refed liver lysates of control, L-Raptor-KO, L-FOXO1-KO, and L-FOXOAAA enriched for nuclear fraction. ***P < 0.001 versus control via Student’s t test. Data shown in ± SEM.
Figure 6
Figure 6. Activation of FOXO1 is required for Ppp1r3b repression.
Foxo1AAA mice aged 10–12 weeks were injected with AAV8-TBG-Cre (L-FOXOAAA) or AAV8-TBG-GFP (Control). Two weeks after injection, mice were fasted overnight, then refed chow for 4 hours before sacrifice. (A) Relative mRNA expression of FOXO target genes. (B) Relative mRNA expression of Ppp1r3b. (C) Hepatic glycogen levels in livers of mice reintroduced to food (refed). (D) Mechanistic schematic. Under fasting conditions, AKT and mTORC1 are inhibited, FOXO localizes to the nucleus where it recruits an unidentified corepressor (represented by the dashed line and ‘?’) to suppress transcription of Ppp1r3b, along with repression of Gck, to downregulate glycogen synthesis. Under feeding conditions, AKT facilitates phosphorylation of FOXO proteins and mTORC1 promotes the nuclear exclusion of AKT-phosphorylated FOXO (unknown mechanism represented by dashed arrow) to inhibit FOXO and promote transcription of Ppp1r3b and Gck. In the absence of mTORC1, AKT-phosphorylated FOXO proteins remain localized in the nucleus and continue to repress Ppp1r3b and Gck. *P < 0.05, ****P < 0.0001 versus indicated control via students t test. Data shown in ± SEM.

References

    1. Santoleri D, Titchenell PM. Resolving the paradox of hepatic insulin resistance. Cell Mol Gastroenterol Hepatol. 2019;7(2):447–456. doi: 10.1016/j.jcmgh.2018.10.016. - DOI - PMC - PubMed
    1. Nordlie RC, Arion WJ. Evidence for the common identity of glucose 6-phosphatase, inorganic pyrophosphatase, and pyrophosphate-glucose phosphotransferase. J Biol Chem. 1964;239:1680–1685. doi: 10.1016/S0021-9258(18)91240-8. - DOI - PubMed
    1. Pilkis SJ, et al. Hormonal regulation of hepatic gluconeogenesis and glycolysis. Annu Rev Biochem. 1988;57:755–783. doi: 10.1146/annurev.bi.57.070188.003543. - DOI - PubMed
    1. Adeva-Andany María M, et al. Liver glucose metabolism in humans. Biosci Rep. 2016;36(6):e00416. doi: 10.1042/BSR20160385. - DOI - PMC - PubMed
    1. Matschinsky FM, Wilson DF. The central role of glucokinase in glucose homeostasis: a perspective 50 years after demonstrating the presence of the enzyme in islets of langerhans. Front Physiol. 2019;10:148. doi: 10.3389/fphys.2019.00148. - DOI - PMC - PubMed