

Published Erratum
doi: 10.1016/j.jconrel.2023.11.055.
Epub 2024 Jan 29.
Corrigendum to "Sustained release hydrogel for durable locoregional chemoimmunotherapy for BRAF-mutated melanoma" [Journal of Controlled Release 357 (2023) 655-668]
Affiliations
- PMID: 38290359
- PMCID: PMC11025318
- DOI: 10.1016/j.jconrel.2023.11.055
Item in Clipboard
Published Erratum
Corrigendum to "Sustained release hydrogel for durable locoregional chemoimmunotherapy for BRAF-mutated melanoma" [Journal of Controlled Release 357 (2023) 655-668]
J Control Release.
2024 Feb.
No abstract available
Figures
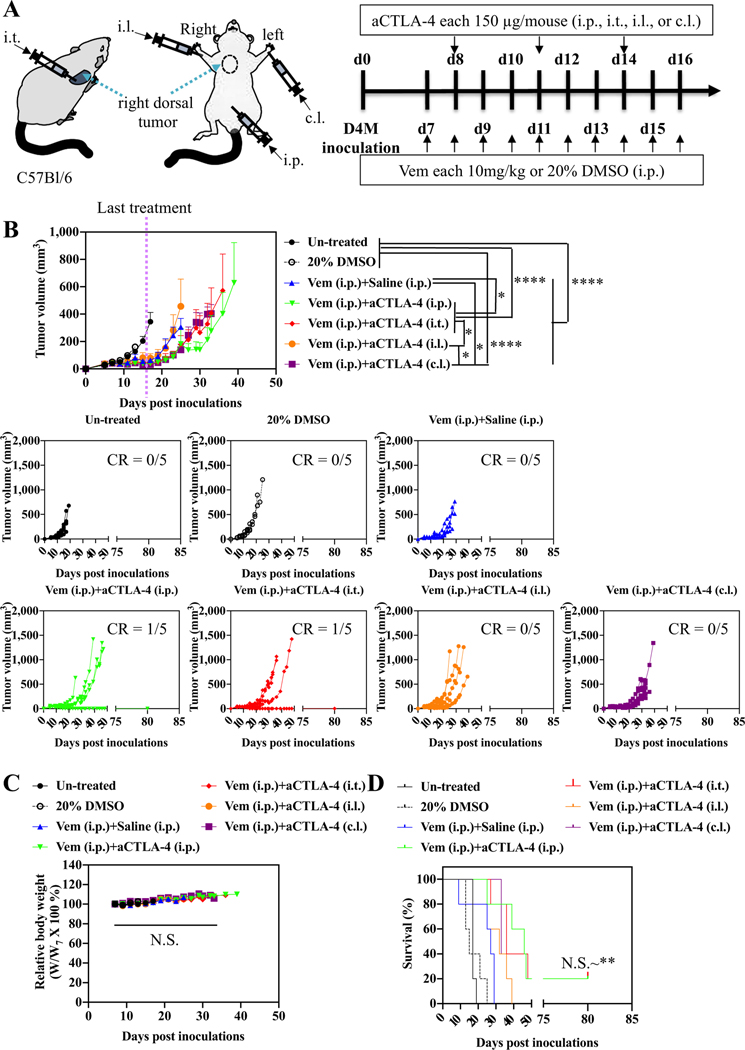
Administration routes-dependency of combined Vem and aCTLA-4 therapy on D4M models. (A) Scheme for administration routes and treatment schedule. 5 × 10⁵ D4M cells in 30 μL saline were subcutaneously inoculated in C57Bl/6 on day 0. Vem (10 mg kg− 1, 100 μL) was treated i.p. every day from day 7 to day 16. aCTLA-4 (150 μg mouse− 1, 30 μL) was administered i.p., i.t., i.l. or c.l. 3 times every 3 days from day 8. (B) Average and individual tumor volumes (n = 5). (C) Weight changes after treatment (n = 5). (D) Kaplan–Meier survival curves (n = 5). Data are presented as mean ± SEM. Two-way ANOVA using Tukey post-hoc statistical hypothesis was employed for (B) and (C). Log-rank using Mentel-Cox statistical hypothesis was used for survival (D). ****p < 0.0001, ***p < 0.001, **p < 0.01, and *p < 0.05. N.S. means “Non Significant”. Statistical values for (D) are listed in Table S1.
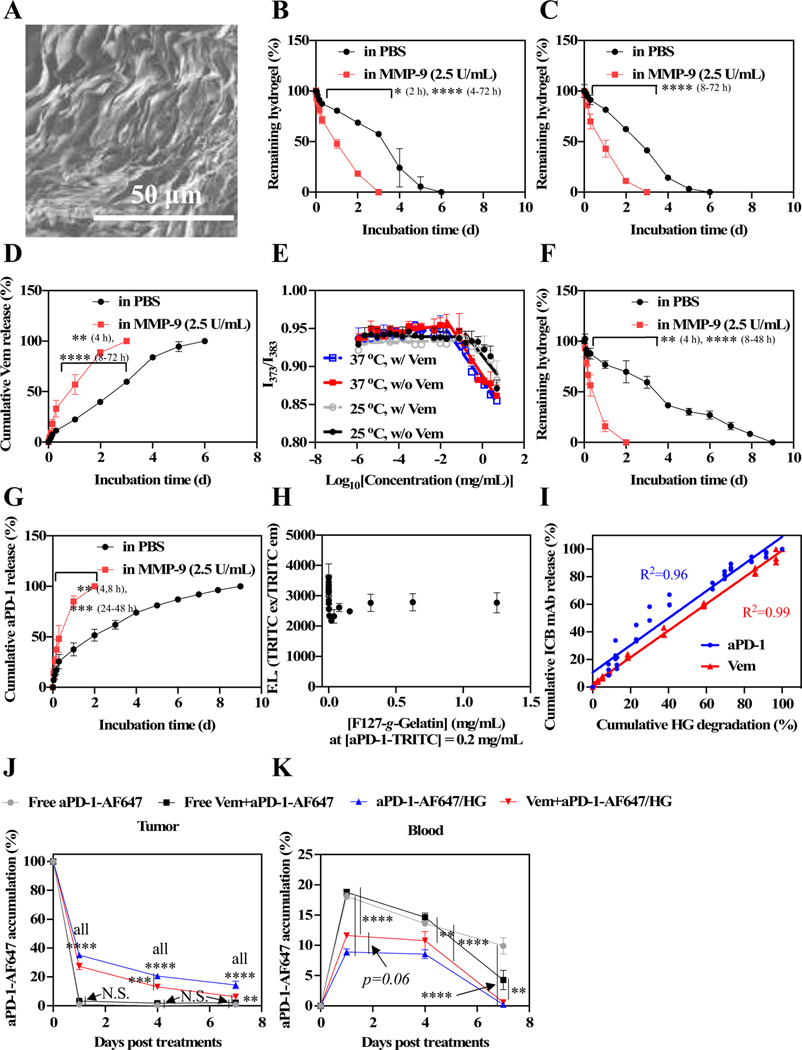
In vitro residence stability and drug release behavior of F127-g-Gelatin hydrogels and in vivo biodistribution of aPD-1 released from F127-g-Gelatin thermosensitive hydrogels. (A) Dry SEM image of dry 4.5 wt% F127-g-Gelatin hydrogel. (B) In vitro residence stability of 4.5 wt% bare F127-g-Gelatin hydrogel (n = 3–4). (C) In vitro residence stability of 4.5 wt% F127-g-Gelatin hydrogel (300 μL) containing Vem (0.7 mg mL− 1 in the F127-g-Gelatin hydrogel) (n = 4). (D) In vitro Vem release behaviors from 4.5 wt% F127-g-Gelatin hydrogel (300 μL) containing Vem (0.7 mg mL− 1 in the F127-g-Gelatin hydrogel) (n = 4). (E) CMC measurement of F127-g-Gelatin at 25 °C and 37 °C with (w/) or without (w/o) Vem. CMC is the intersection of two distinctive linear lines determined by ratiometric fluorescence (373 nm/383 nm) of pyrenes. (F) In vitro residence stability of 4.5 wt% F127-g-Gelatin hydrogel (300 μL) containing aPD-1-TRITC (0.6 mg mL− 1 in the F127-g-Gelatin hydrogel) (n = 4). (G) In vitro Vem release behaviors from 4.5 wt% F127-g-Gelatin hydrogel (300 μL) containing aPD-1-TRITC (0.6 mg mL− 1 in the F127-g-Gelatin hydrogel) (n = 4). (H) F127-g-Gelatin concentration-dependent fluorescence of aPD-1-TRITC (n = 3). (I) Correlation graph between hydrogel degradation and Vem/ aPD-1-TRITC release (n = 3–4). (J,K) In vivo local and systemic biodistribution of aPD-1 released from F127-g-Gelatin thermosensitive hydrogels. Free aPD-1-AF647, free aPD-1-AF647 in the presence of Vem, aPD-1-AF647 with 4.5 wt% F127-g-Gelatin hydrogel, aPD-1-AF647 with 4.5 wt% F127-g-Gelatin hydrogel containing Vem (Vem and aPD-1 dose equivalent to 10 mg kg− 1 and 100 μg mouse− 1, respectively) (n = 4) were administered into the tumor established with D4M 5 × 10⁵ cells in 30 μL saline on day 0. Mice were sacrificed on day 1, 4, and 7. Biodistribution of aPD-1 in (J) tumor, and (K) blood. Data are presented as (A-I) mean ± SD or (J,K) mean ± SEM. Two-way ANOVA using Tukey post-hoc statistical hypothesis was employed for (B-D,F,G,J,K). ****p < 0.0001, ***p < 0.001, **p < 0.01, and *p < 0.05. N.S. means “Non Significant”.
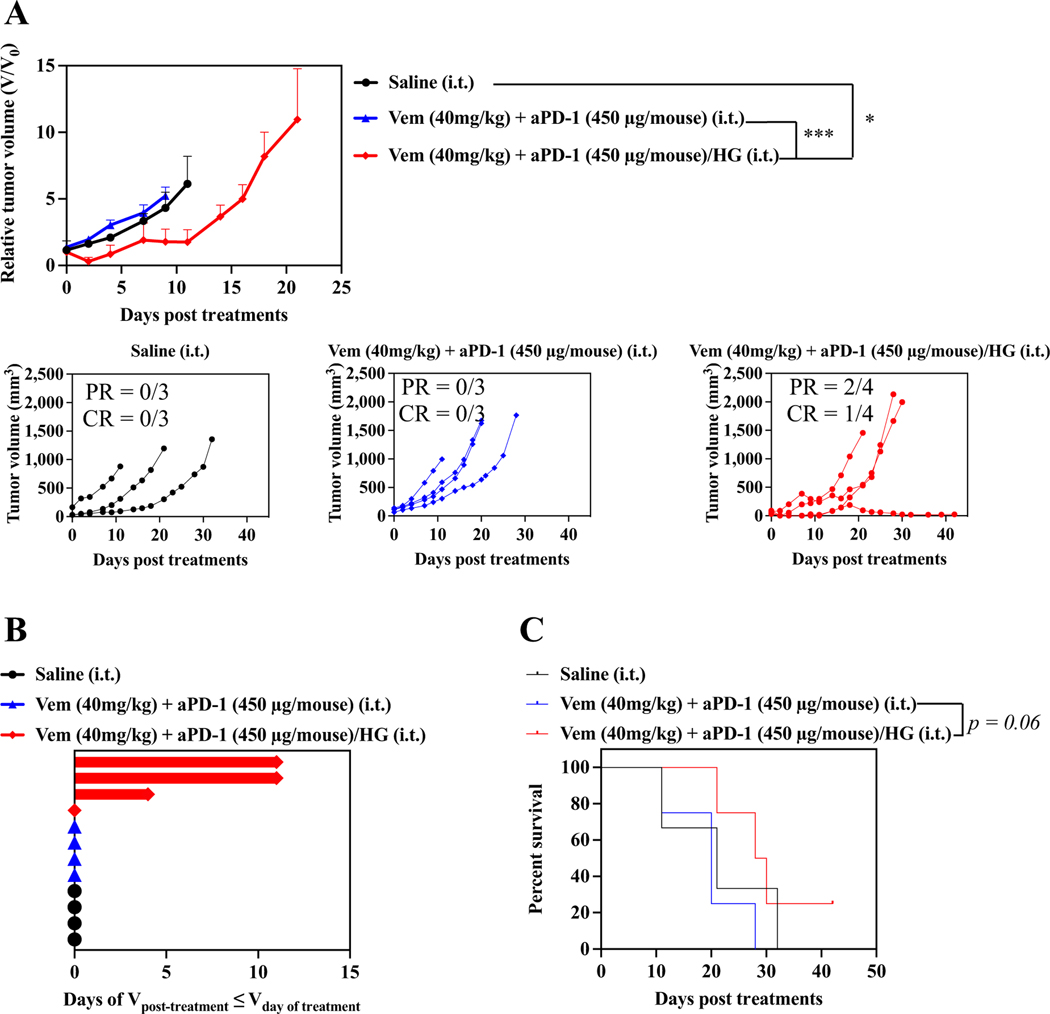
Antitumor effects of combined Vem and aPD-1 with F127-g-Gelatin hydrogel on SM1 models. SM1 cells were passaged in NSG mice. After harvested and resuspended in 160 μL saline, 30 μL of SM1 cell solutions were subcutaneously inoculated in C57Bl/6. Treatments were started when SM1 tumor size reached to 5–10 mm. Mice treated with saline, or combined single i.t. administrations of Vem (40 mg kg− 1) and aPD-1 (450 μg mouse− 1) were employed as control groups. F127-g-Gelatin hydrogels containing combined Vem (40 mg kg− 1) and aPD-1 (450 μg mouse− 1) were i.t. administered one time. (A) Relative average and individual tumor volumes (n = 3–4). (B) Swimmer plot to present therapeutic response, which depicts how long that mouse’s tumor growth curve remained flat or lower than its initial volume at time of treatment (n = 3–4). (C) Kaplan–Meier survival curves (n = 3–4). Data are presented as mean ± SEM. Two-way ANOVA using Tukey post-hoc statistical hypothesis was employed for (A). Log-rank using Mentel-Cox statistical hypothesis was used for survival (C). ****p < 0.0001, ***p < 0.001, **p < 0.01, and *p < 0.05. Statistical values for (C) are listed in Table S8.
Erratum for
-
Sustained release hydrogel for durable locoregional chemoimmunotherapy for BRAF-mutated melanoma.J Control Release. 2023 May;357:655-668. doi: 10.1016/j.jconrel.2023.04.028. Epub 2023 Apr 27. J Control Release. 2023. PMID: 37080489 Free PMC article.
Publication types
Grants and funding
LinkOut - more resources
Full Text Sources
Research Materials
