

Distinct genomic contexts predict gene presence-absence variation in different pathotypes of Magnaporthe oryzae
- PMID: 38290434
- PMCID: PMC10990425
- DOI: 10.1093/genetics/iyae012
Distinct genomic contexts predict gene presence-absence variation in different pathotypes of Magnaporthe oryzae
Abstract
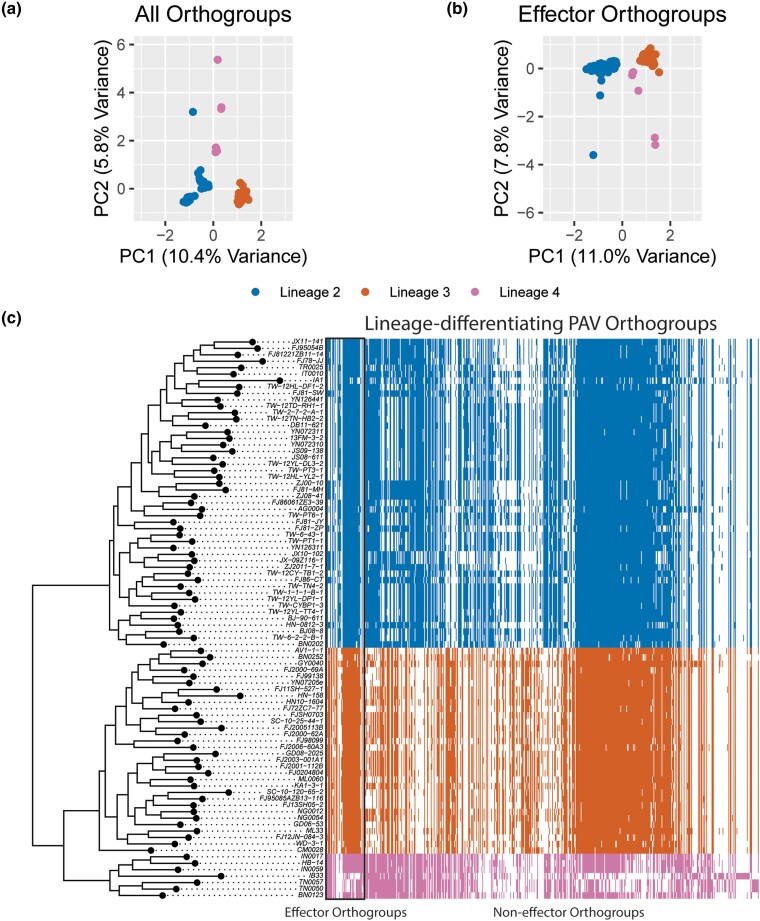
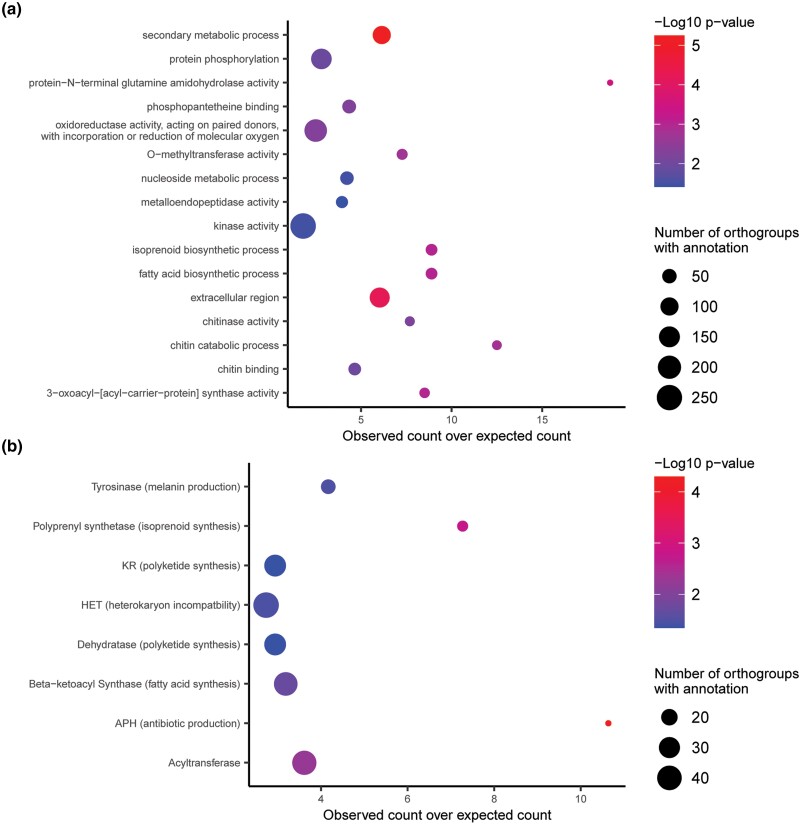
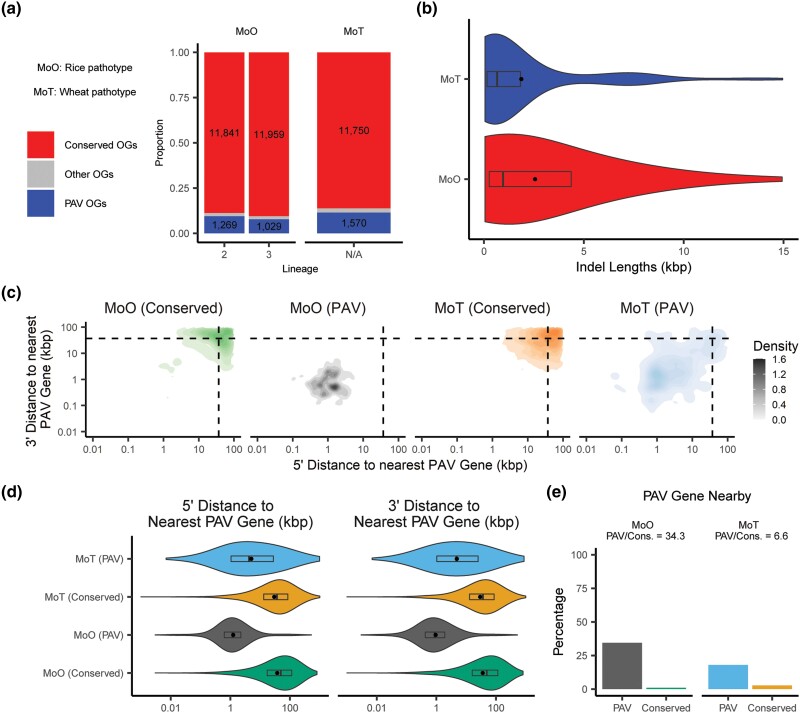
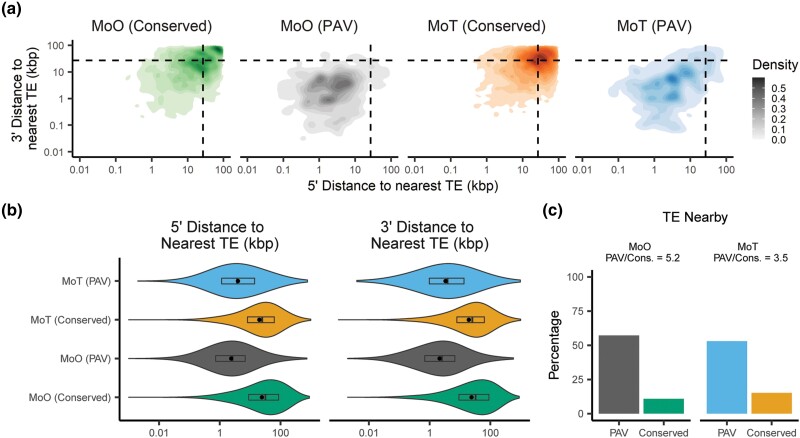
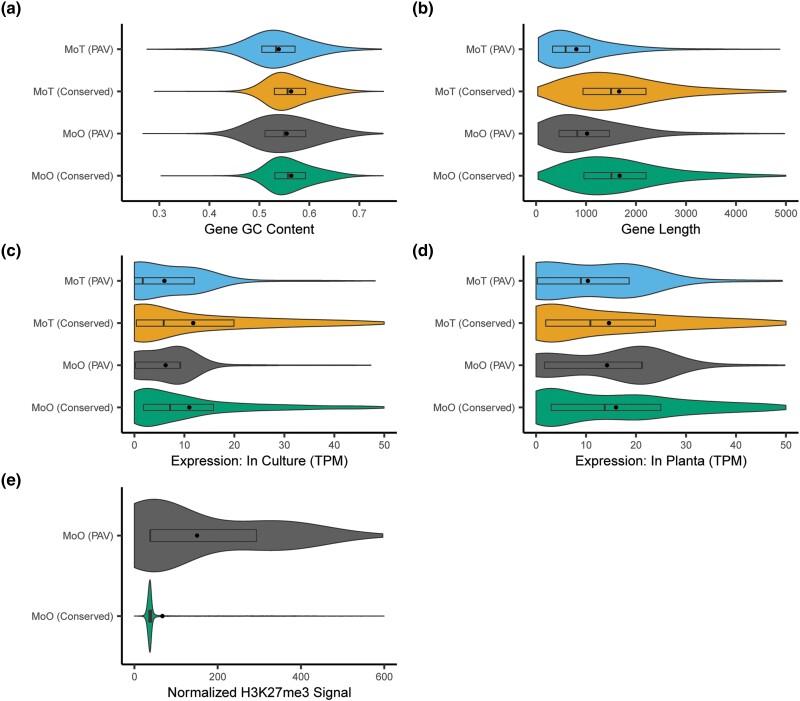
Fungi use the accessory gene content of their pangenomes to adapt to their environments. While gene presence-absence variation contributes to shaping accessory gene reservoirs, the genomic contexts that shape these events remain unclear. Since pangenome studies are typically species-wide and do not analyze different populations separately, it is yet to be uncovered whether presence-absence variation patterns and mechanisms are consistent across populations. Fungal plant pathogens are useful models for studying presence-absence variation because they rely on it to adapt to their hosts, and members of a species often infect distinct hosts. We analyzed gene presence-absence variation in the blast fungus, Magnaporthe oryzae (syn. Pyricularia oryzae), and found that presence-absence variation genes involved in host-pathogen and microbe-microbe interactions may drive the adaptation of the fungus to its environment. We then analyzed genomic and epigenomic features of presence-absence variation and observed that proximity to transposable elements, gene GC content, gene length, expression level in the host, and histone H3K27me3 marks were different between presence-absence variation genes and conserved genes. We used these features to construct a model that was able to predict whether a gene is likely to experience presence-absence variation with high precision (86.06%) and recall (92.88%) in M. oryzae. Finally, we found that presence-absence variation genes in the rice and wheat pathotypes of M. oryzae differed in their number and their genomic context. Our results suggest that genomic and epigenomic features of gene presence-absence variation can be used to better understand and predict fungal pangenome evolution. We also show that substantial intra-species variation can exist in these features.
Keywords: Magnaporthe oryzae; Pyricularia oryzae; comparative genomics; evolution; fungi; machine learning; plant pathogen; population genetics; presence–absence variation; structural variation.
© The Author(s) 2024. Published by Oxford University Press on behalf of The Genetics Society of America.
Conflict of interest statement
Conflicts of interest The author(s) declare no conflicts of interest.
Figures
Update of
-
Distinct genomic contexts predict gene presence-absence variation in different pathotypes of a fungal plant pathogen.bioRxiv [Preprint]. 2023 Feb 17:2023.02.17.529015. doi: 10.1101/2023.02.17.529015. bioRxiv. 2023. Update in: Genetics. 2024 Apr 3;226(4):iyae012. doi: 10.1093/genetics/iyae012. PMID: 36824763 Free PMC article. Updated. Preprint.
Similar articles
-
Distinct genomic contexts predict gene presence-absence variation in different pathotypes of a fungal plant pathogen.bioRxiv [Preprint]. 2023 Feb 17:2023.02.17.529015. doi: 10.1101/2023.02.17.529015. bioRxiv. 2023. Update in: Genetics. 2024 Apr 3;226(4):iyae012. doi: 10.1093/genetics/iyae012. PMID: 36824763 Free PMC article. Updated. Preprint.
-
Transposable elements impact the population divergence of rice blast fungus Magnaporthe oryzae.mBio. 2024 May 8;15(5):e0008624. doi: 10.1128/mbio.00086-24. Epub 2024 Mar 27. mBio. 2024. PMID: 38534157 Free PMC article.
-
Comparative genomic analysis revealed rapid differentiation in the pathogenicity-related gene repertoires between Pyricularia oryzae and Pyricularia penniseti isolated from a Pennisetum grass.BMC Genomics. 2018 Dec 13;19(1):927. doi: 10.1186/s12864-018-5222-8. BMC Genomics. 2018. PMID: 30545292 Free PMC article.
-
Pyricularia oryzae: Lab star and field scourge.Mol Plant Pathol. 2024 Apr;25(4):e13449. doi: 10.1111/mpp.13449. Mol Plant Pathol. 2024. PMID: 38619508 Free PMC article. Review.
-
The link between changing in host carbon allocation and resistance to Magnaporthe oryzae: a possible tactic for mitigating the rice blast fungus.Plant Signal Behav. 2024 Dec 31;19(1):2326870. doi: 10.1080/15592324.2024.2326870. Epub 2024 Mar 11. Plant Signal Behav. 2024. PMID: 38465846 Free PMC article. Review.
Cited by
-
Omics approaches in understanding the benefits of plant-microbe interactions.Front Microbiol. 2024 May 27;15:1391059. doi: 10.3389/fmicb.2024.1391059. eCollection 2024. Front Microbiol. 2024. PMID: 38860224 Free PMC article. Review.
References
-
- Alexa A, Rahnenfuhrer J. 2023. topGO: enrichment analysis for gene ontology. doi:10.18129/B9.bioc.topGO. - DOI
Publication types
MeSH terms
Supplementary concepts
Grants and funding
LinkOut - more resources
Full Text Sources
Research Materials
Miscellaneous
