. 2024 Mar 11;59(5):661-675.e7.
doi: 10.1016/j.devcel.2024.01.005. Epub 2024 Jan 29.

PUF partner interactions at a conserved interface shape the RNA-binding landscape and cell fate in Caenorhabditis elegans

Affiliations

PUF partner interactions at a conserved interface shape the RNA-binding landscape and cell fate in Caenorhabditis elegans

Brian H Carrick et al. Dev Cell. .

Abstract

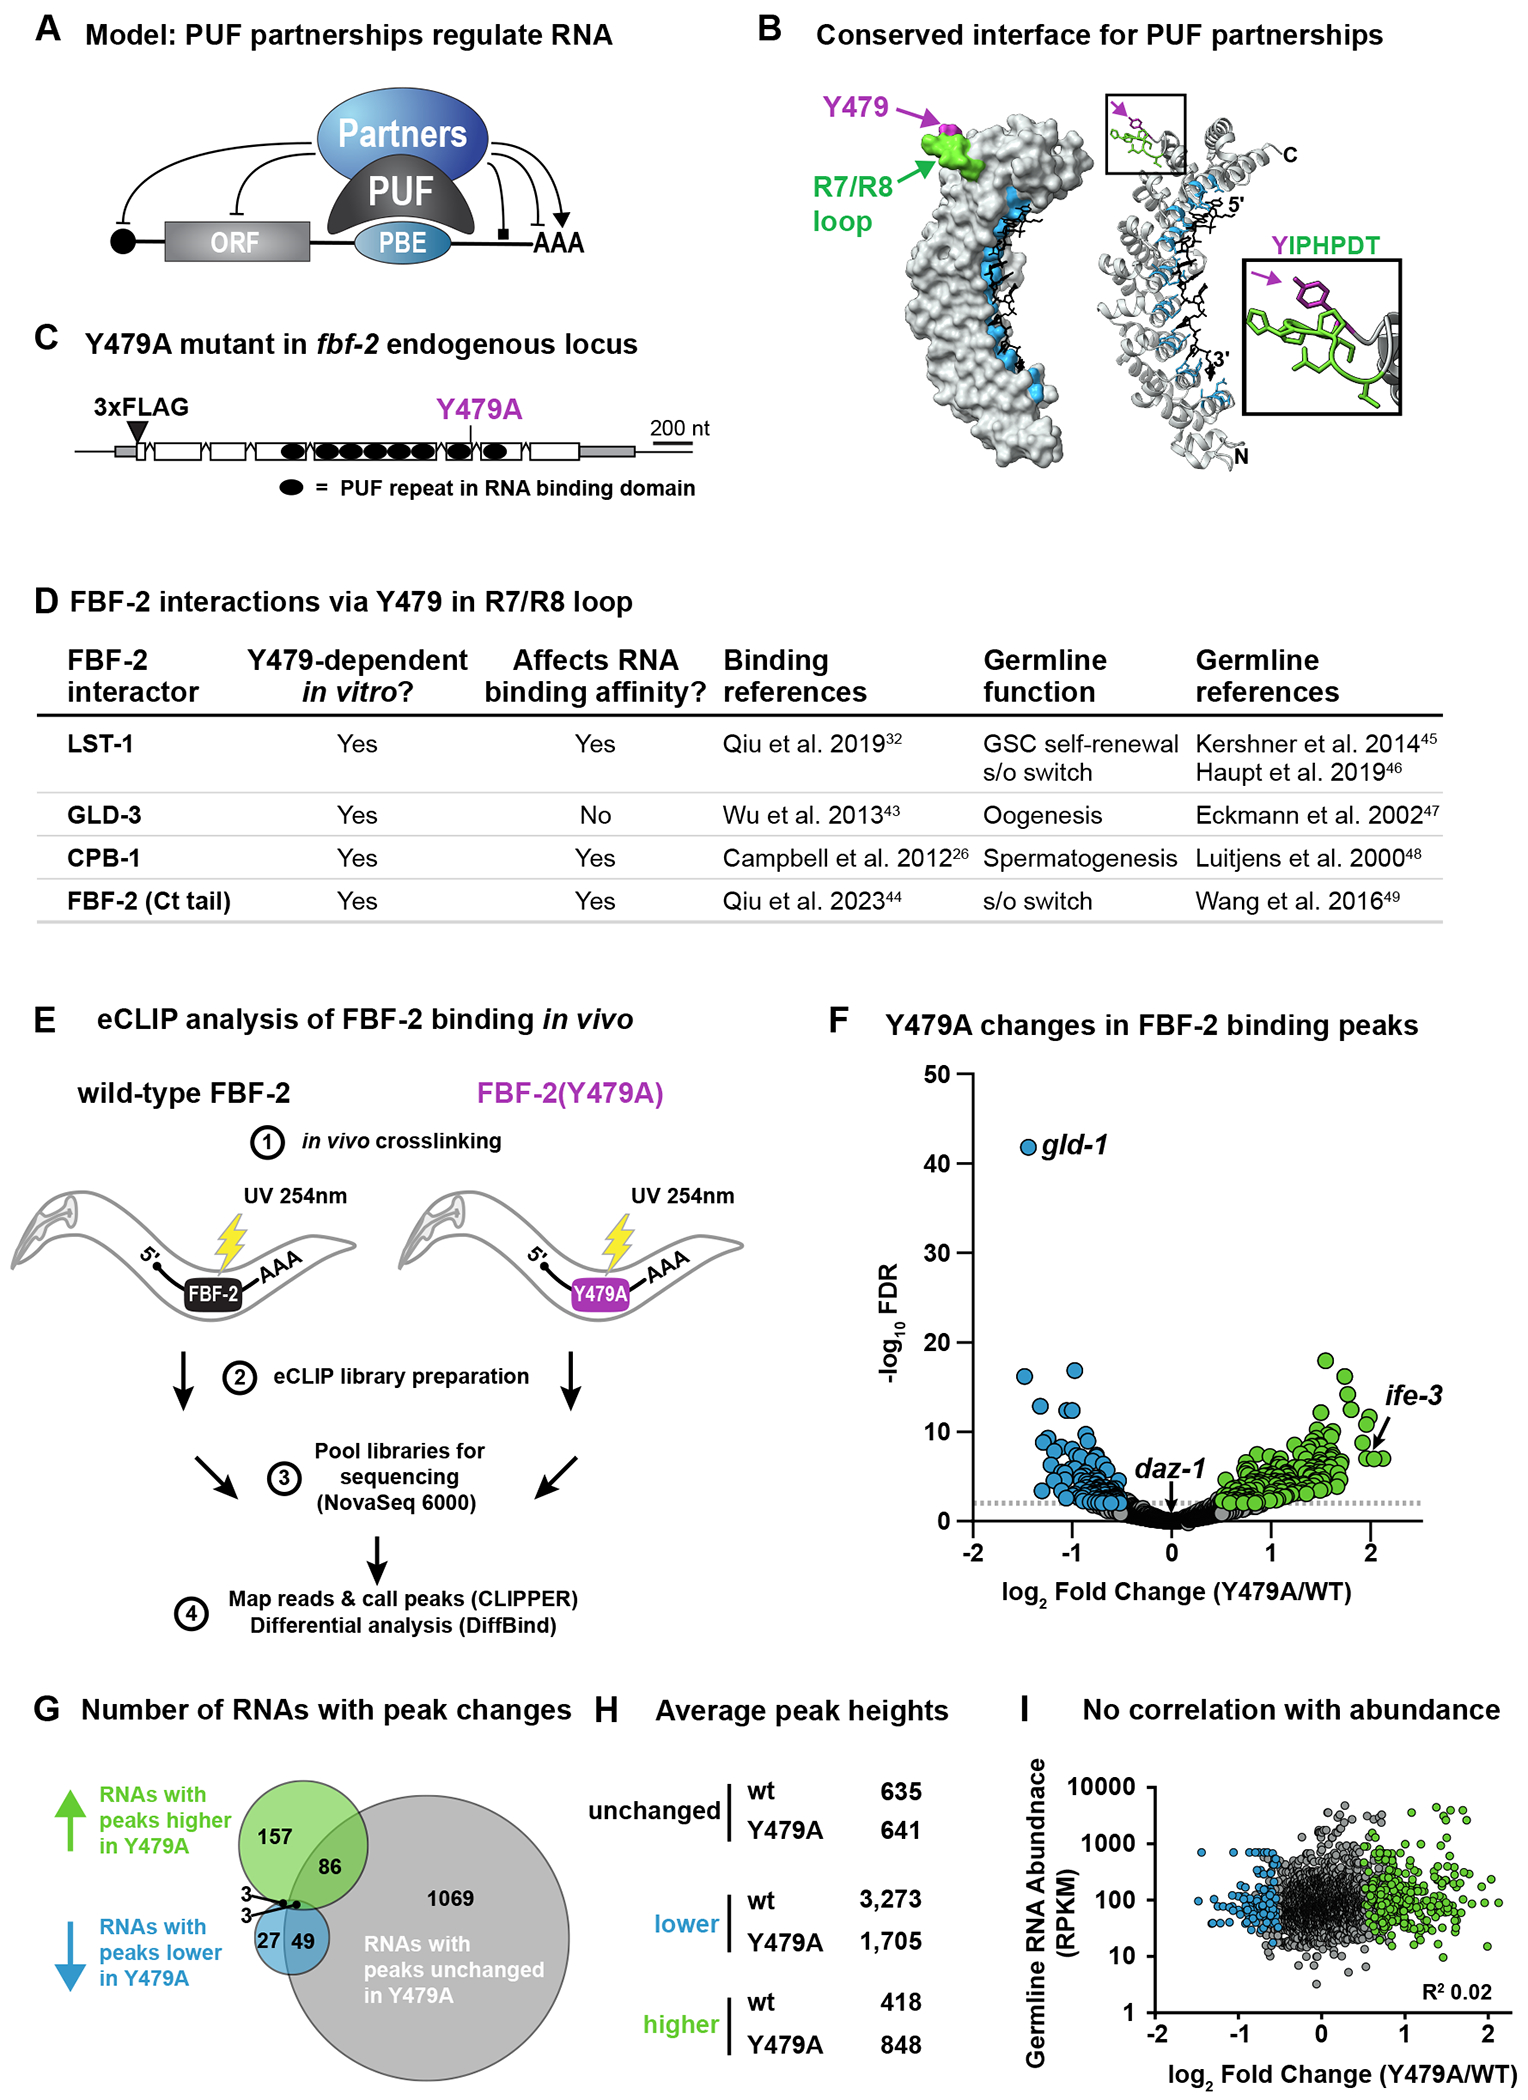
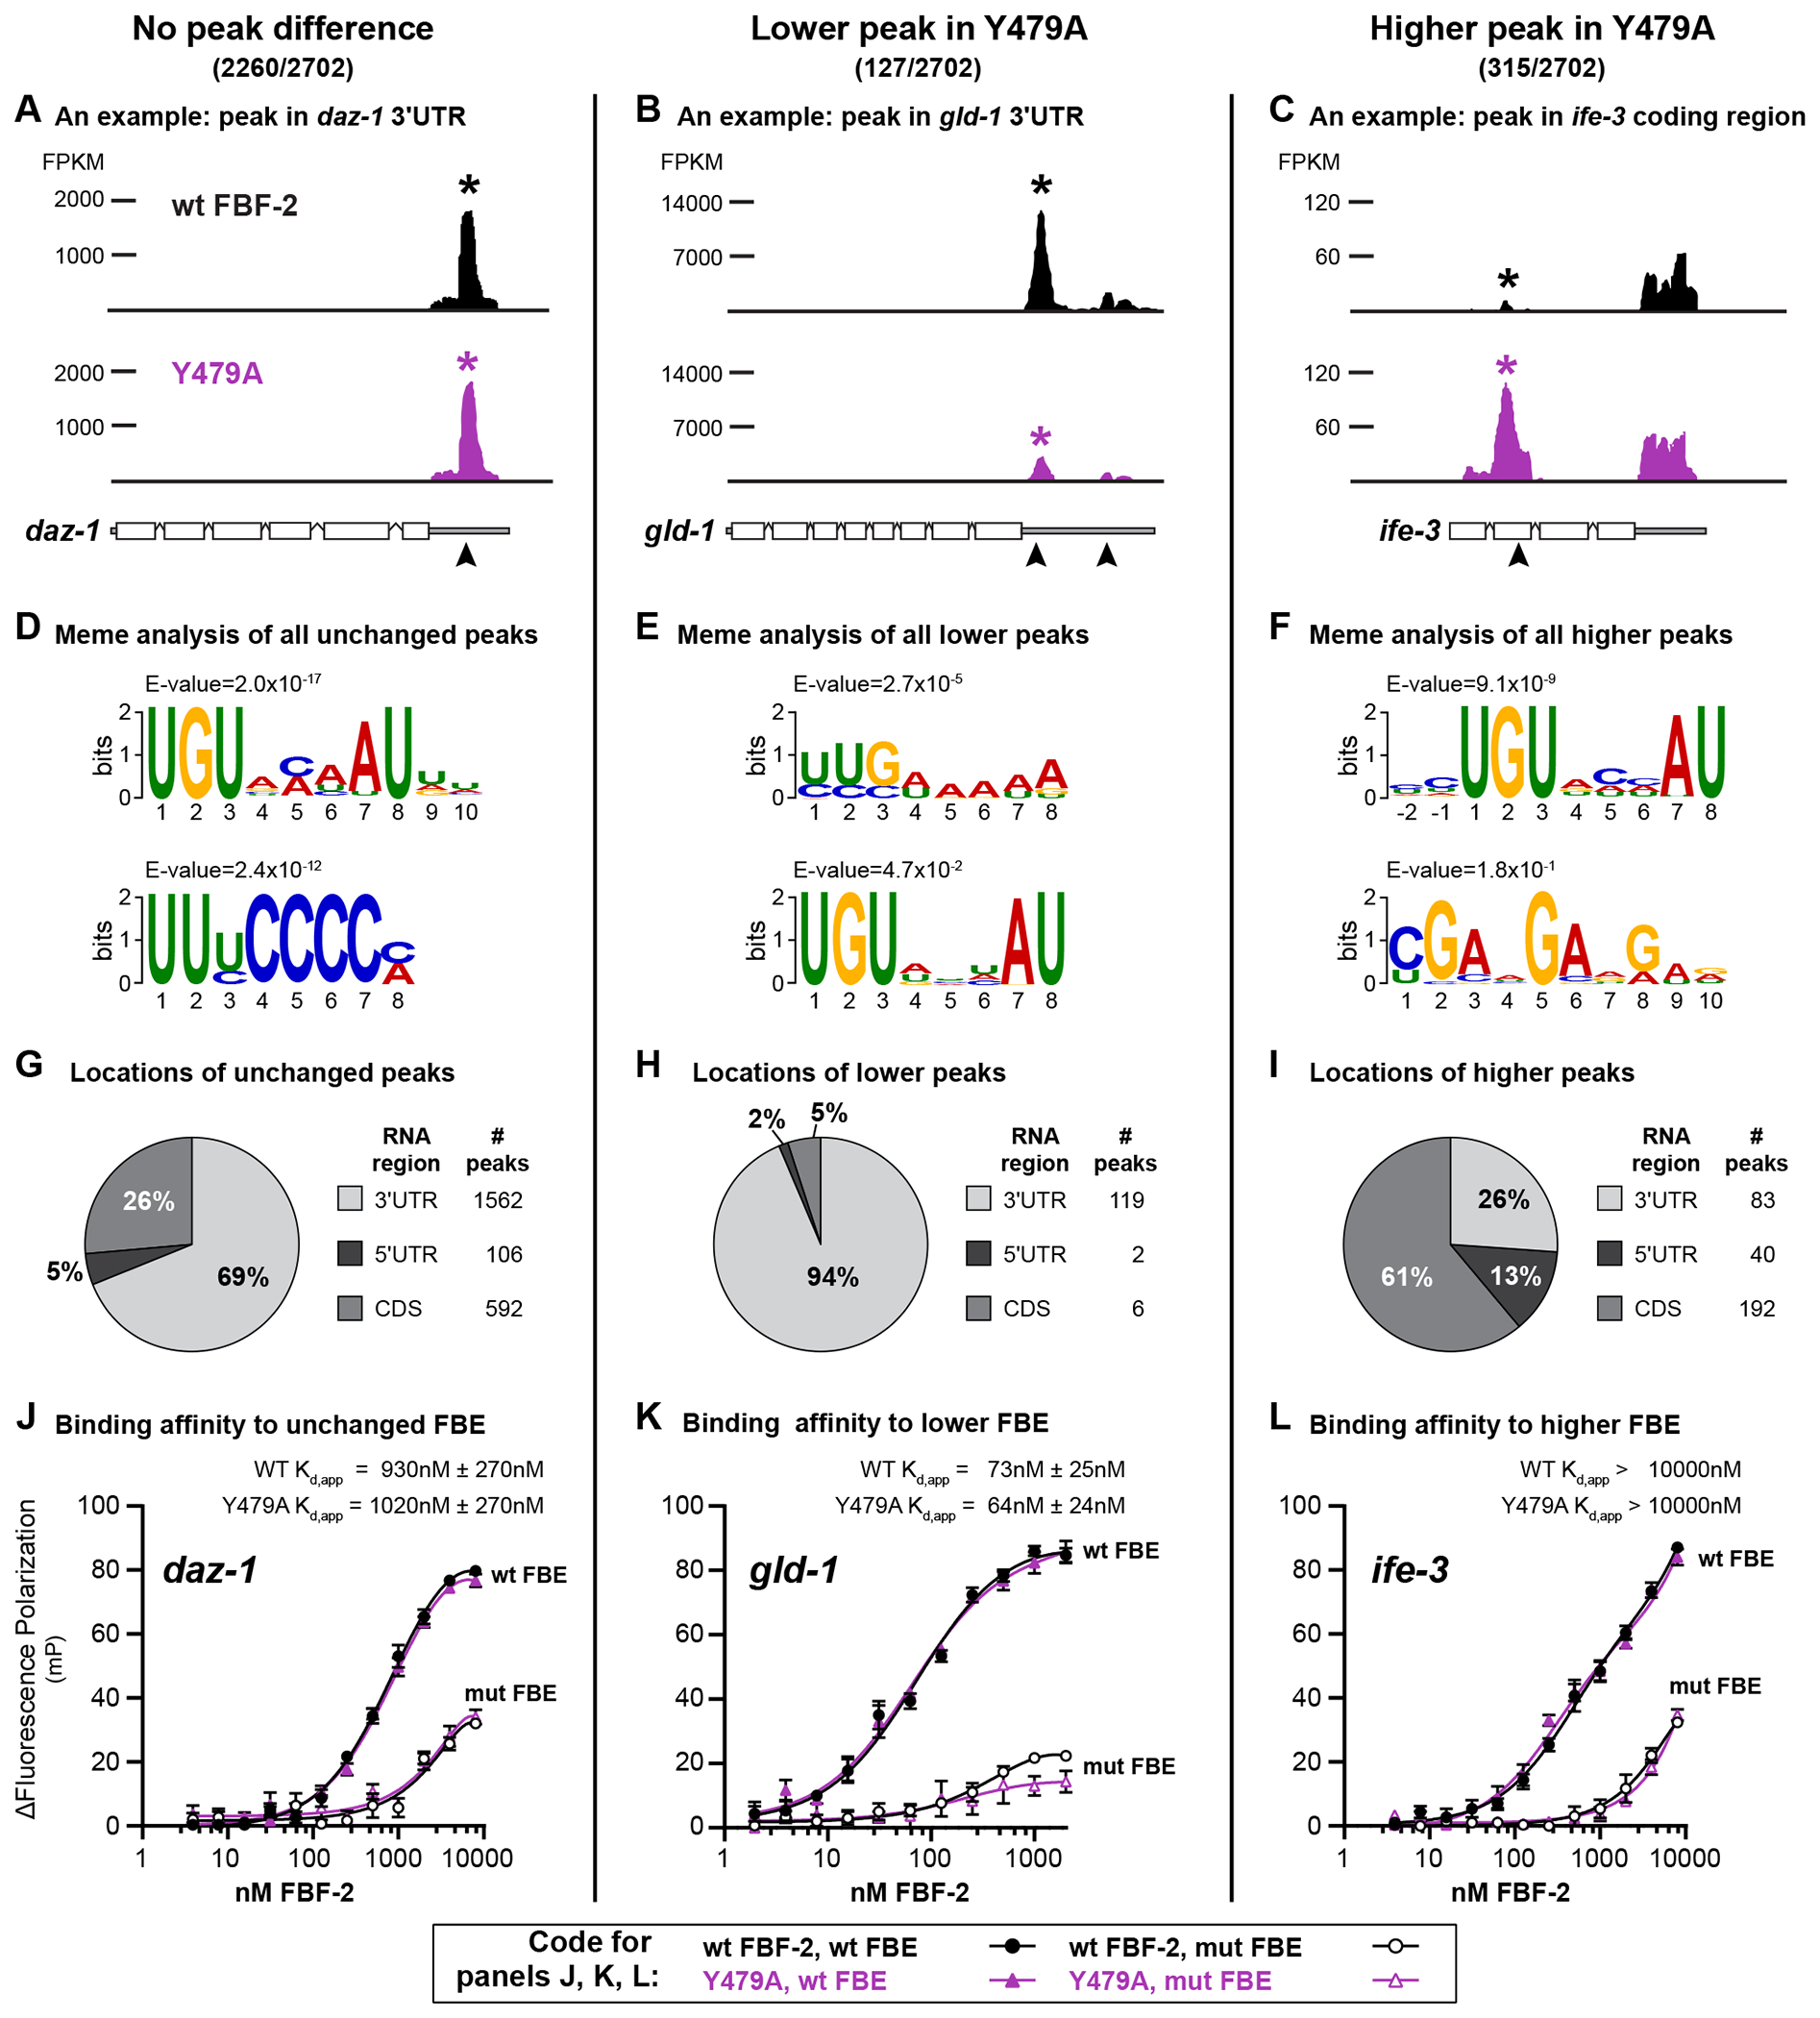
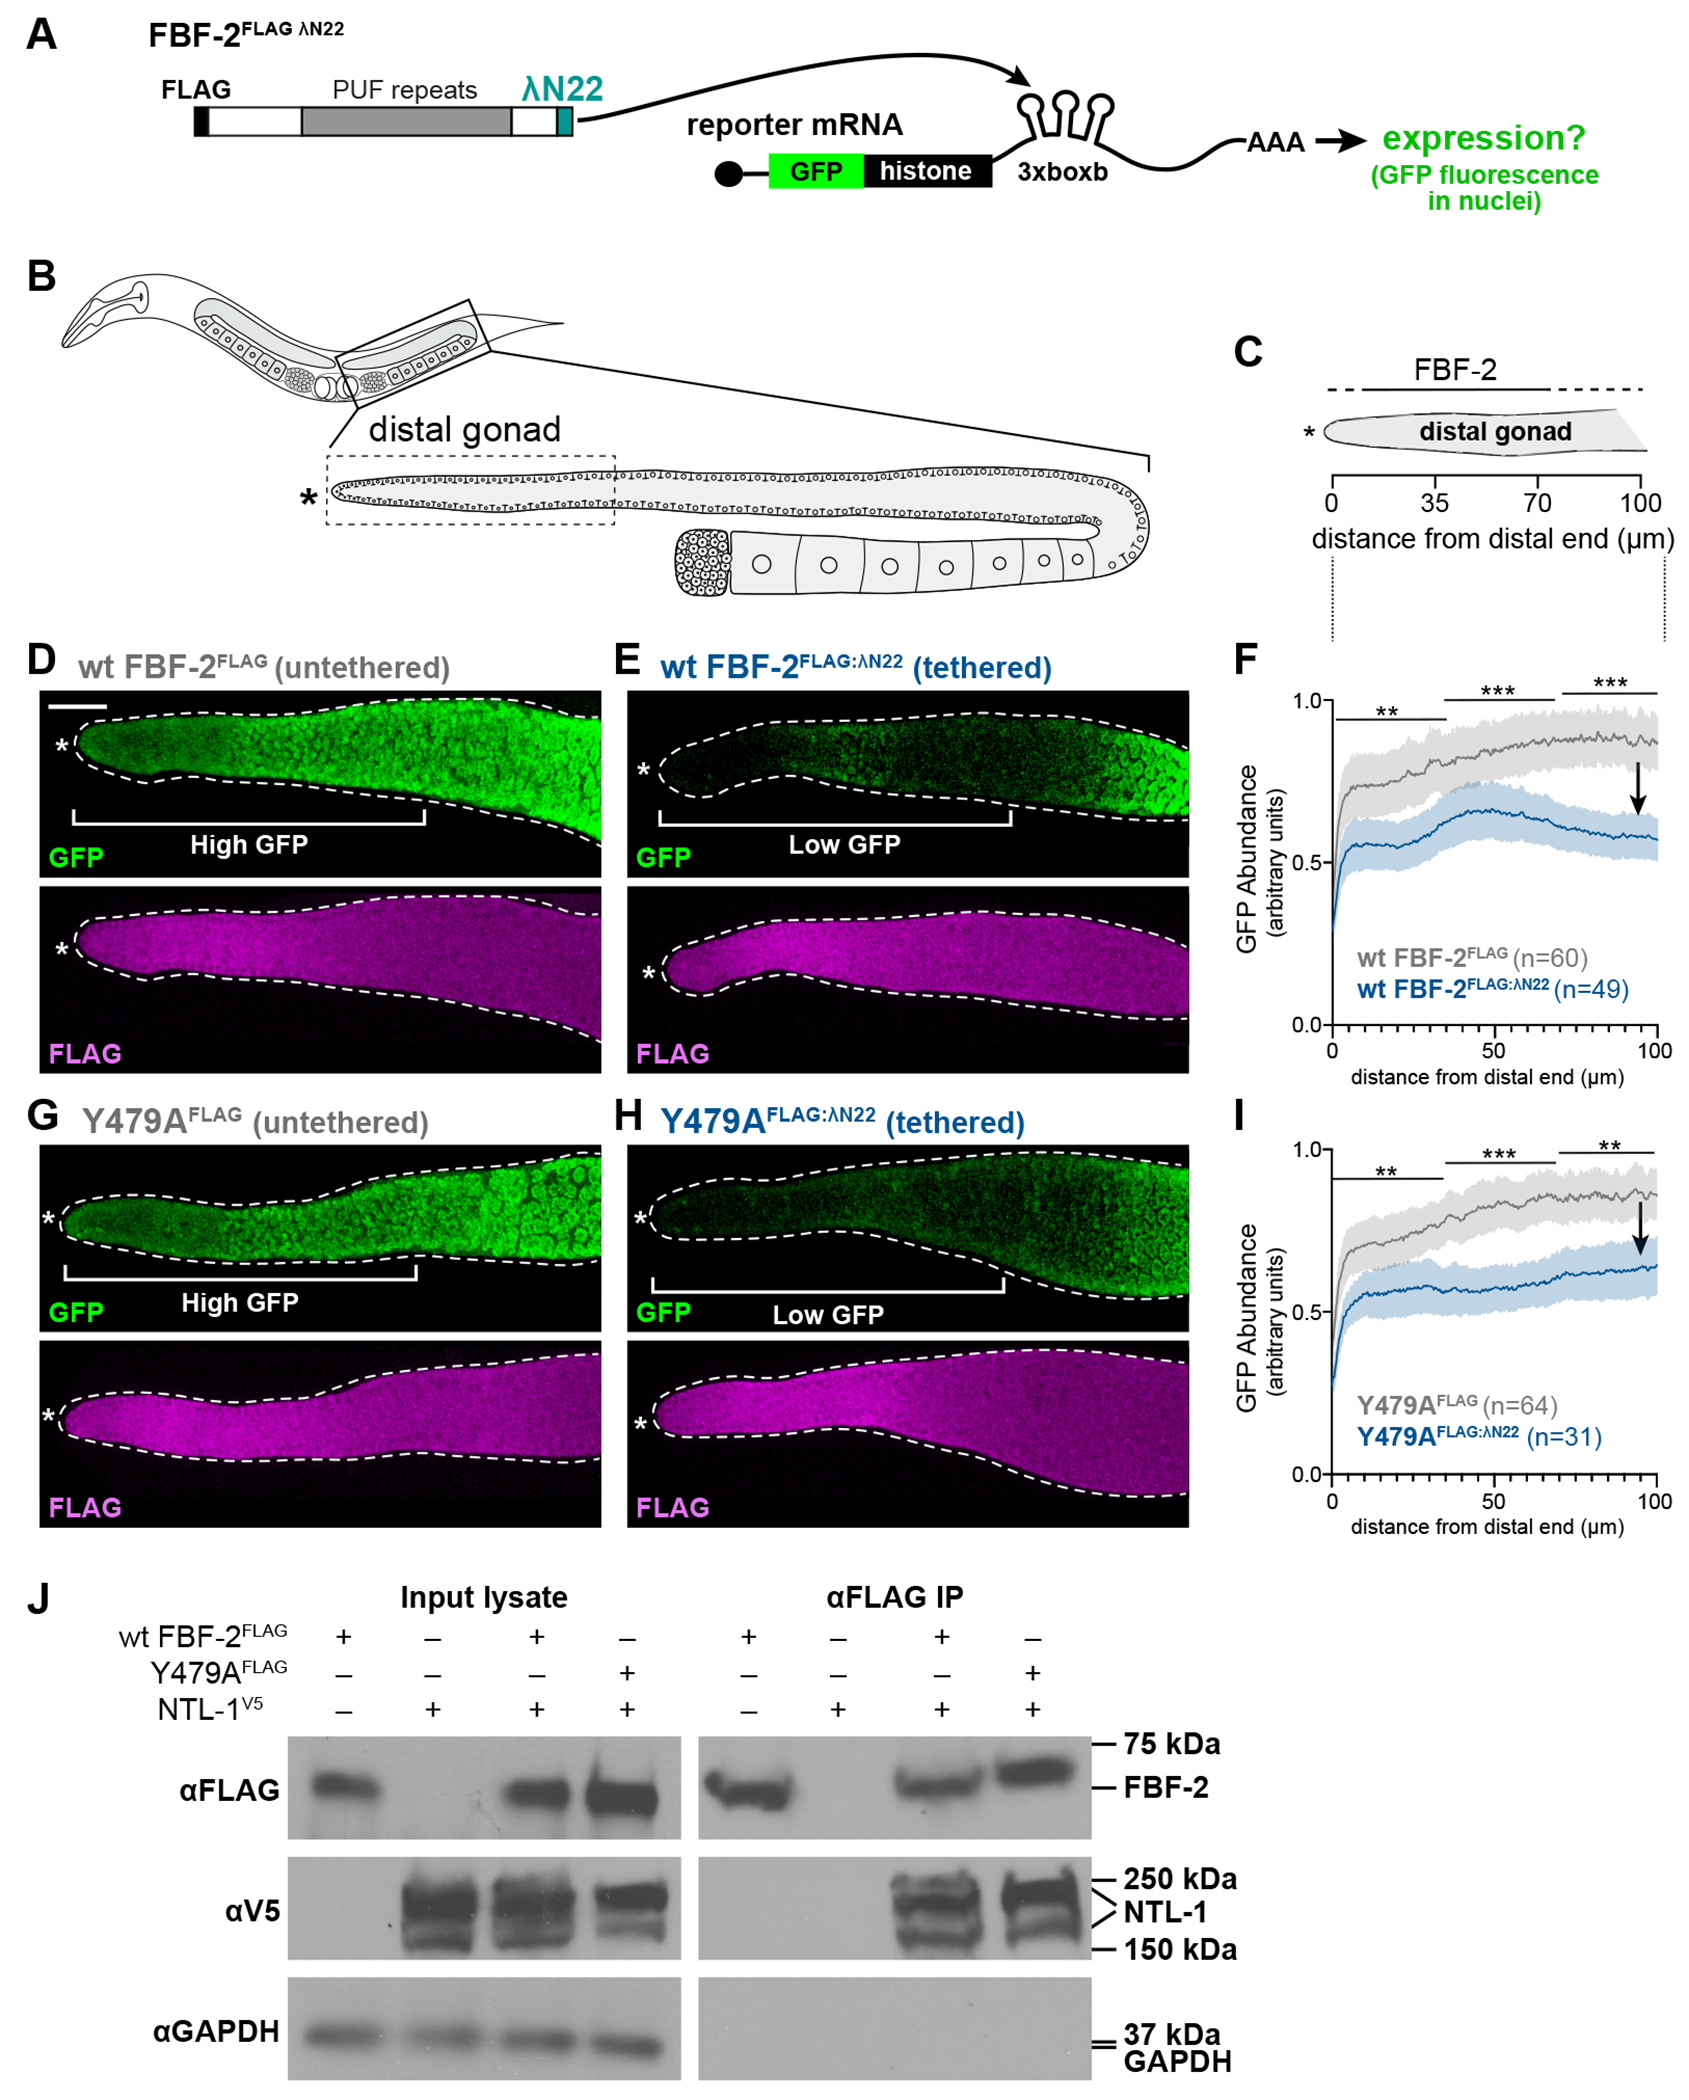
Protein-RNA regulatory networks underpin much of biology. C. elegans FBF-2, a PUF-RNA-binding protein, binds over 1,000 RNAs to govern stem cells and differentiation. FBF-2 interacts with multiple protein partners via a key tyrosine, Y479. Here, we investigate the in vivo significance of partnerships using a Y479A mutant. Occupancy of the Y479A mutant protein increases or decreases at specific sites across the transcriptome, varying with RNAs. Germline development also changes in a specific fashion: Y479A abolishes one FBF-2 function-the sperm-to-oocyte cell fate switch. Y479A's effects on the regulation of one mRNA, gld-1, are critical to this fate change, though other network changes are also important. FBF-2 switches from repression to activation of gld-1 RNA, likely by distinct FBF-2 partnerships. The role of RNA-binding protein partnerships in governing RNA regulatory networks will likely extend broadly, as such partnerships pervade RNA controls in virtually all metazoan tissues and species.

Keywords: C. elegans; FBF-2; FBF-binding elements; PUF/PUM partner proteins; PUF/PUM-RNA-binding protein; RNA binding landscape; eCLIP; germline stem cells; gld-1 RNA; sperm/oocyte fate decision.


Conflict of interest statement

Declaration of interests The authors declare no competing interests.

Figures

Figure 1.
Figure 1.. Key tyrosine modulates the FBF-2 RNA-binding landscape.
(A) PUF proteins bind PUF binding elements (PBEs) and interact with partners to control mRNA. Arrowhead, activation; blunt end, repression; square end, RNA binding. (B) Crystal structure of FBF-2 (left, surface; right, ribbon; gray) binding to RNA (black) (PDB:3K5Y). RNA binding residues, blue; R7/R8 loop, green; Y479, purple. Inset focuses on R7/R8 residues. (C) fbf-2 locus. Untranslated regions (gray boxes); coding regions (white boxes), introns (peaked lines), PUF repeats (black ovals). 3xFLAG and Y479 positions are indicated. D) Y479-dependent FBF-2 partners validated in vitro and their germline functions. Y479 dependence and effects on RNA binding affinity were determined using peptide fragments from partner proteins in vitro. (E) eCLIP workflow. (F) Comparison of wild-type FBF-2 and mutant FBF-2(Y479A) binding to individual peaks. Gray circle, RNA peak is same in wild-type and Y479A (gray becomes black with overlaps). Blue circle, RNA peak is lower in Y479A than wild-type. Green circle, RNA peak is higher in Y479A than wild-type. Dotted line marks FDR ≤0.01. Representative peak is labeled for each category. (G) Venn diagram showing overlap of RNAs harboring peaks in each category (colors as in Figure 1F). Numbers in main circles indicate number of RNAs with peaks in only one category; numbers in circle intersections indicate number of RNAs with peaks in different categories. (H) Average peak heights for wild-type and Y479A in all three categories. (I) Fold-changes in peaks of each category (x-axis, colors as in Figure 1F) are plotted as a function of germline RNA abundance (y-axis).
Figure 2.
Figure 2.. Peak features, category by category.
(A-C) Representative RNAs for each category, showing peak heights (above) and RNA positions (below). Peak heights are measured in fragments per kilobase mapped (FPKM) under the peak. Asterisks mark representative peaks. Black peak, wild-type; purple peak, Y479A. Arrowheads mark consensus FBEs under peaks. (A) daz-1 peak with no difference in occupancy; (B) gld-1 peak with lower occupancy in Y479A than wild-type; (C) ife-3 peak with higher occupancy in Y479A than wild-type. (D-F) Top enriched motifs by MEME in each category. (G-I) Peak locations in each category. (J-L) RNA binding affinities for each category, assayed by fluorescence polarization. Error bars show standard error for triplicate measurements. Code shown below (wt, wild-type). Kd,app is apparent Kd. See Figures S5A and S5B for protein and RNA info.
Figure 3.
Figure 3.. Y479A retains RNA repression activity.
(A) Tethering assay. FBF-2 is tethered by λN22 binding to boxB hairpins in the reporter RNA. Modified from Aoki et al. 2018. (B) Above, location of gonadal arm (black box) within animal. Below, location of distal region (dotted box) within gonadal arm. Asterisk marks distal end. Germline stem cells (GSCs) reside at the most distal end of germline and their daughters begin differentiation as they move proximally. (C) Diagram of distal gonad, showing distance from the distal end in microns below and extents of abundant FBF-2 (black line) and lower FBF-2 (dotted line) above. (D-E) Representative z-projections of extruded germlines. 20μm scale bar in (D) applies to all images. Dotted line marks gonad boundary; asterisk marks distal end. Top, GFP reporter expression (green); bottom, FBF-2FLAG staining (magenta). (D) Untethered wild-type FBF-2. (E) Tethered wild-type FBF-2. (F) ImageJ quantitation of reporter signal from tethered vs untethered FBF-2. GFP abundance plotted against distance from distal end. Solid line shows mean abundance and shading shows 95% confidence interval. Each plot represents three biological replicates with at least 10 gonad arms per replicate. P-values are given for pooled data in 0-35, 35-70 and 70-100 μm regions (black bars). P-values: *** p < 0.001, ** p < 0.01, * p < 0.05, ns (not significant) p > 0.05. Exact p-values in Table S4. (G-H) Representative z-projections of extruded germlines, as in (3D-E). (G) Untethered Y479A. (H) Tethered Y479A. (I) Quantitation of tethered vs untethered Y479A. P-values as in (F). (J) Western blots after FBF-2 and NTL-1 co-immunoprecipitation. Left, input lysates (1%); right, FLAG IP (10%). NTL-1:V5 co-immunoprecipitates with both wild-type and Y479A.
Figure 4.
Figure 4.. Y479A leads to RNA misregulation.
(A-F) Representative z-projections of stained extruded gonads. 20μm scale bar in (A) applies to (A-F). All images cropped at 100μm from distal end; dotted line marks gonad boundary; asterisk marks distal end. (A-C) Gonads with wild-type FBF-2; (D-F) gonads with Y479A. (G-I) Image J quantitation. Solid line shows mean abundance and shading shows 95% confidence interval. Each plot represents three biological replicates with at least 10 gonad arms per replicate. P-values are given for pooled data in 0-35, 35-70 and 70-100 μm regions (black bars). P-values: *** p < 0.001, ** p < 0.01, * p < 0.05, ns (not significant) p > 0.05. Exact p-values in Table S4. (G) DAZ-1 protein in wild-type and Y479A. (H) GLD-1 protein in wild-type and Y479A. (I) IFE-3 protein in wild-type and Y479A.
Figure 5.
Figure 5.. Key FBF-2 tyrosine is required for the sperm to oocyte cell fate switch.
(A) FBF-1 and FBF-2 are redundant for three germline roles. GSC, germline stem cell. (B) Adult gonad organization. Progenitor Zone (PZ, yellow) includes a pool of GSCs adjacent to the distal end (asterisk) and GSC daughters making the sperm to oocyte cell fate switch (s/o switch) more proximally; mature sperm (green) are in spermatheca and oocytes develop in proximal arm (magenta). The distal end is capped by the stem cell niche. (C-F) Representative z-projection images of extruded adult gonads; stained for sperm (α-SP56, green), oocytes (α-RME-2, magenta) and DNA (DAPI, cyan). Dotted line marks gonad boundary; asterisk marks distal end; yellow line marks PZ extent. 20μm scale bar in (C) applies to (C-F) (G) Gonad stained by smFISH for lst-1 RNA, a GSC marker (yellow). 20μm scale bar in (G) applies to (G-H). (H) Gonad stained with α-phospho-histone H3 (PH3) to visualize M-phase chromosomes (yellow) and DAPI (cyan). (I) Y479A-only germline phenotype. GSCs, germline stem cells maintained; s/o switch, sperm to oocyte switch occurs, n, number gonads scored. See also Figure S6.
Figure 6.
Figure 6.. Effects of individual FBEs and Y479A on GLD-1 protein expression.
(A) Schematic of gld-1 3’UTR. Two consensus FBEs, FBEa and FBEb (black boxes), reside under two wild-type (wt) FBF-2 eCLIP peaks. Wild-type FBE sequences in black; mutations in red. (B) FBE mutations affect germline phenotypes. GSCs, germline stem cells are maintained; s/o switch, sperm to oocyte switch occurs successfully. FBE effects (red). n, number gonads scored. (C) Image J quantitation of GLD-1 abundance (y-axis) scored as a function of distance from the distal end (x-axis). Graph lines (wild-type, grey; FBE mutant, blue) show mean GLD-1 abundance. Shading is the 95% confidence interval. Compared gonads were processed and quantitated together. Dotted lines above graphs mark where the GSC pool (GSC) and entry into differentiation (diff) occur in wild-type gonads. P-values are given for pooled data in 0-10, 70-80 and 90-100 μm regions (black bars). P-values: *** p < 0.001, ** p < 0.01, * p < 0.05, ns (not significant) p > 0.05. Exact p-values in Table S4. (D-E) Images and quantitation of GLD-1 abundance in gonads with wild-type FBF-2 and Y479A-only gonads (no FBF-1). (D) Representative z-projection images of GLD-1 in extruded germlines. Left, control gonad harbors no FBF-1 but has wild-type FBF-2 protein; right, Y479A-only gonad has no FBF-1 but has mutant Y479A protein. Scale bar 20μm (applies to both images). (E) Image J quantitation of GLD-1 abundance. Black line, abundance in control gonads; blue line, abundance in Y479A-only gonads. Conventions and p-values as in C. See also Figure S7.
Figure 7.
Figure 7.. Models for Y479 effects on FBF binding landscape and regulatory mode.
(A-C) Models for how Y479-dependent interactions modulate FBF-2 occupancy. Target RNAs (straight lines) with a cap (circle) at 5’ end, open reading frame (ORF) and 3’ untranslated region (3’UTR). In each case, wild-type (left) and Y479A (right) diagrams represent extremes of the likely spectrum of possibilities. Partners are color-coded according to effects on FBF-2 occupancy (grey, no change in Y479A; blue, lower in Y479A; green, higher in Y479A), and FBEs are similarly color-coded according to Y479-dependent effects (grey, no change in Y479A; blue, lower in Y479A; green, higher in Y479A). (A) Peak unchanged by Y479A (most in 3’UTR). Left: Wild-type FBF-2 binds to an FBF binding element (FBE) (grey) independently of interactions at Y479. Right: Y479A occupancy is unchanged. (B) Peaks lowered by Y479A (most in 3’UTR). Left: Wild-type FBF-2 interacts via Y479 with stabilizing partner (blue) to increase its FBE occupancy. Right: Y479A mutant protein does not interact with stabilizing partner so its FBE occupancy decreases. (C) Peaks increased by Y479A (most in coding regions). Left: Wild-type FBF-2 interacts via Y479 with destabilizing partner (green) or its own autoinhibitory C-terminal tail, either of which lowers FBE occupancy. Right: Y479A mutant protein occupies the FBE (green), due to release from its destabilizing partner or release from its autoinhibitory C-terminal tail. In addition, excess Y479A protein, released from sites that are high occupancy in wild-type, binds to sites that are low occupancy in wild-type (dotted arrow from 7B to 7C). (D) Diagram of Y479-dependent spatial regulation of gld-1 mRNA in the wild-type distal gonad. The distal to proximal axis of the gonad is oriented from left to right with an asterisk at the distal end. We propose that LST-1 stabilizes FBF-2 interactions with gld-1 FBEs in the distal-most gonad, allowing repression by the Ccr4-Not complex (low GLD-1, white fill in gonad), and that FBF-2 partnerships exchange as germ cells move proximally where the GLD-2/3 heterodimer promotes gld-1 activation (high GLD-1, dark grey fill in gonad).

References

    1. Keene JD (2007). RNA regulons: coordination of post-transcriptional events. Nature Reviews Genetics 8, 533–543. 10.1038/nrg2111. - DOI - PubMed
    1. Ule J, and Darnell RB (2006). RNA binding proteins and the regulation of neuronal synaptic plasticity. Current Opinion in Neurobiology 16, 102–110. 10.1016/j.conb.2006.01.003. - DOI - PubMed
    1. Lapointe CP, Wilinski D, Saunders HAJ, and Wickens M (2015). Protein-RNA networks revealed through covalent RNA marks. Nature Methods 12, 1163–1170. 10.1038/nmeth.3651. - DOI - PMC - PubMed
    1. Hentze MW, Castello A, Schwarzl T, and Preiss T (2018). A brave new world of RNA-binding proteins. Nat Rev Mol Cell Biol 19, 327–341. 10.1038/nrm.2017.130. - DOI - PubMed
    1. Singh G, Pratt G, Yeo GW, and Moore MJ (2015). The Clothes Make the mRNA: Past and Present Trends in mRNP Fashion. Annual Review of Biochemistry 84, 325–354. 10.1146/annurev-biochem-080111-092106. - DOI - PMC - PubMed

Publication types