. 2024 Mar;20(3):659-674.
doi: 10.1080/15548627.2024.2305063. Epub 2024 Jan 30.

ANXA2 (annexin A2) is crucial to ATG7-mediated autophagy, leading to tumor aggressiveness in triple-negative breast cancer cells

Affiliations

ANXA2 (annexin A2) is crucial to ATG7-mediated autophagy, leading to tumor aggressiveness in triple-negative breast cancer cells

Minsoo Koh et al. Autophagy. 2024 Mar.

Abstract

Triple-negative breast cancer (TNBC) is associated with a poor prognosis and metastatic growth. TNBC cells frequently undergo macroautophagy/autophagy, contributing to tumor progression and chemotherapeutic resistance. ANXA2 (annexin A2), a potential therapeutic target for TNBC, has been reported to stimulate autophagy. In this study, we investigated the role of ANXA2 in autophagic processes in TNBC cells. TNBC patients exhibited high levels of ANXA2, which correlated with poor outcomes. ANXA2 increased LC3B-II levels following bafilomycin A1 treatment and enhanced autophagic flux in TNBC cells. Notably, ANXA2 upregulated the phosphorylation of HSF1 (heat shock transcription factor 1), resulting in the transcriptional activation of ATG7 (autophagy related 7). The mechanistic target of rapamycin kinase complex 2 (MTORC2) played an important role in ANXA2-mediated ATG7 transcription by HSF1. MTORC2 did not affect the mRNA level of ANXA2, but it was involved in the protein stability of ANXA2. HSPA (heat shock protein family A (Hsp70)) was a potential interacting protein with ANXA2, which may protect ANXA2 from lysosomal proteolysis. ANXA2 knockdown significantly increased sensitivity to doxorubicin, the first-line chemotherapeutic regimen for TNBC treatment, suggesting that the inhibition of autophagy by ANXA2 knockdown may overcome doxorubicin resistance. In a TNBC xenograft mouse model, we demonstrated that ANXA2 knockdown combined with doxorubicin administration significantly inhibited tumor growth compared to doxorubicin treatment alone, offering a promising avenue to enhance the effectiveness of chemotherapy. In summary, our study elucidated the molecular mechanism by which ANXA2 modulates autophagy, suggesting a potential therapeutic approach for TNBC treatment.Abbreviation: ATG: autophagy related; ChIP: chromatin-immunoprecipitation; HBSS: Hanks' balanced salt solution; HSF1: heat shock transcription factor 1; MTOR: mechanistic target of rapamycin kinase; TNBC: triple-negative breast cancer; TFEB: transcription factor EB; TFE3: transcription factor binding to IGHM enhancer 3.

Keywords: ATG7; Annexin A2; HSF1; MTOR; autophagy; triple-negative breast cancer.


Conflict of interest statement

No potential conflict of interest was reported by the author(s).

Figures
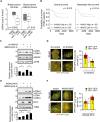
Figure 1.
Figure 1.
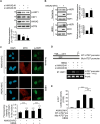
ANXA2 is a critical factor in the autophagic flux in TNBC cells. (A) ANXA2 mRNA expression in breast cancer cell lines and human breast cancer tissues from GEO dataset (GSE36693). (B) The kaplan-meier survival curves of ANXA2 for overall survival (left) and metastasis-free survival (right) in TNBC patients based on GEO dataset (GSE58812). Patients were divided into groups of low (n = 52) and high (n = 55) expression based on the median value of ANXA2 mRNA expression. (C) Hs578T cells were transfected with shRNA targeting ANXA2 (+) or scrambled shRNA (-) as a control. The cells were starved in HBSS and treated with 200 nM bafilomycin A1 for 2 h. Immunoblot analysis was conducted. The relative band intensities of LC3B-II were quantified by densitometry and normalized to ACTB. (D) Representative images of LC3 puncta. Hs578T cells expressing shRNA ANXA2 or scrambled shRNA were transfected with RFP-GFP-LC3 and starved with HBSS for 2 h. LC3 puncta were quantified by the number of RFP+ GFP (red) and RFP+ GFP+ (yellow) per cell of 40 independent images. Scale bar of images: 10 μm. (E) Hs578T cells were transfected with plasmid expressing ANXA2-MYC (+) or empty plasmid (-). The cells were starved in HBSS and treated with 200 nM bafilomycin A1 for 2 h. Immunoblot analysis was conducted. The relative band intensities of LC3B-II were quantified by densitometry and normalized to ACTB. (F) Representative images of LC3 puncta. Hs578T cells expressing ANXA2-MYC or empty vector were transfected with RFP-GFP-LC3 and starved with HBSS for 2 h. LC3 puncta were quantified by the number of RFP+ GFP (red) and RFP+ GFP+ (yellow) per cell of 40 independent images. Scale bar of images: 10 μm. Data represent mean ± S.E. (unpaired two-tailed Student’s t-test). *,** statistically significant at p < 0.05 and p < 0.01, respectively. All data were representative of the results of three independent experiments.
Figure 2.
Figure 2.
ANXA2 regulates ATG7 transcription. (A and B) Hs578T cells were stably transfected with shRNA targeting ANXA2 (+) or scrambled shRNA as a control (-). The cells were starved in HBSS for 2 h. The expressions of ATG7 and ANXA2 were detected by immunoblotting (A) and qRT-PCR (B). The relative band intensities of ATG7 were quantified by densitometry and normalized to ACTB in immunoblot analysis. (C and D) Hs578T cells were transfected with ANXA2-MYC vector (+) or empty vector (-) and then the cells were starved in HBSS for 2 h. The expressions of ATG7 and ANXA2 were detected by immunoblotting (C) and qRT-PCR (D). The relative band intensities of ATG7 were quantified by densitometry and normalized to ACTB in immunoblot analysis. Data represent mean ± S.E. (unpaired two-tailed Student’s t-test). *,**,*** statistically significant at p < 0.05, p < 0.01, and p < 0.001 respectively. All data were representative of the results of three independent experiments.
Figure 3.
Figure 3.
ANXA2 plays a key role in HSF1 (heat shock transcription factor 1)-induced transcription of ATG7. (A) Hs578T cells were transiently transfected with two siRNAs targeting ANXA2 (+) or scrambled siRNA as a control (-). Immunoblot analysis was conducted. The relative band intensities of p-HSF1 were quantified by densitometry and normalized to HSF1. (B) Hs578T cells were transfected with plasmid expressing ANXA2-MYC (+) or empty plasmid (-), and the cells were cultured in growth medium or starved in HBSS for 2 h. Immunoblot analysis was conducted. The relative band intensities of p-HSF1 were quantified by densitometry and normalized to HSF1. (C) Representative images were shown the cellular distributions of p-HSF1 in Hs578T cells expressing ANXA2-MYC or empty vector. The cells were starved in HBSS for 2 h and immunostained with anti-p-HSF1 and anti-MYC antibodies shown in green and red, respectively. DNA was stained by DAPI. The mean fluorescence intensity of p-HSF1 within the nucleus was measured and normalized to the mean fluorescence intensity of DAPI per cell from 30 independent images. Scale bar of images: 10 μm. (D) ChIP assay was performed to measure the binding degree of HSF1 to the ATG7 promoter in Hs578T cells. The schematic diagram indicates the wild type ATG7 promoter (WT-ATG7 promoter, top) and mutant ATG7 promoter (mut-ATG7-promoter, deletion of consensus HSF1 binding site at − 1602, bottom). Hs578T cells transfected with scrambled siRNA (-) or siRNA molecules #1 and #2 targeting ANXA2 (+) were starved in HBSS for 2 h. Chromatin was immunoprecipitated with specific antibodies against HSF1. DNA was amplified by PCR using primers covering the binding site for HSF1 in the ATG7 promoter (−1809 to − 1412) and separated on 1% agarose gel. The relatively increased band intensity indicates that the binding of HSF1 protein to ATG7 promoter is increased. (E) The effect of HSF1 on ATG7 promoter activity was detected by luciferase reporter assay. Hs578T cells expressing ANXA2-MYC or empty vector were transfected with WT or mut ATG7 promoter plasmid. The cells were starved with HBSS for 2 h and the firefly luciferase activity was measured and normalized to Renilla luciferase activity. Data represent mean ± S.E. (unpaired two-tailed Student’s t-test). *,**,*** statistically significant at p < 0.05, p < 0.01, and p < 0.001 respectively. All data were representative of the results of three independent experiments.
Figure 4.
Figure 4.
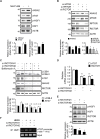
MTORC2 is important for ANXA2-mediated ATG7 transcription by HSF1. (A) Hs578T cells were treated with MHY1485 (1 μM) for 24 h. Immunoblot analysis was conducted. The relative band intensities were quantified by densitometry and normalized to ACTB or HSF1. * statistically significant at p < 0.05. (B) Hs578T cells were transfected with siRNA targeting MTOR, RPTOR, or RICTOR (+). Scrambled siRNA (-) was used as a control. The protein levels were detected by immunoblot analysis. The relative band intensities were quantified by densitometry and normalized to ACTB. * statistically significant at p < 0.05. (C) Hs578T cells were transfected with two siRNAs targeting RICTOR (+) or scrambled siRNA (-) as a control. Cells were starved in HBSS for 2 h and treated with bafilomycin A1 (200 nM) for 2 h. Immunoblot analysis was conducted. The relative band intensities were quantified by densitometry and normalized to ACTB. *,** indicated statistical significance of the relative expression of LC3B-II vs control cells treated with bafilomycin A1 (white bar) at p < 0.05 and p < 0.01, representatively. # indicated statistical significance of the relative expression of ATG7 vs control cells treated with bafilomycin A1 (black bar) at p < 0.05. (D) Hs578T cells were transfected with two siRNAs targeting RICTOR (+) or scrambled siRNA (-) as a control. The mRNA levels of ATG7 and RICTOR were determined by qRT-PCR analysis. ** statistically significant at p < 0.01. (E) Hs578T cells were transfected with siRNA targeting RICTOR (+) or scrambled siRNA (-) as a control. Immunoblot analysis was conducted. The relative band intensities of p-HSF1 were quantified by densitometry and normalized to HSF1. * statistically significant at p < 0.05. (F) ChIP assay was performed to measure the binding degree of HSF1 to the ATG7 promoter in Hs578T cells. Hs578T cells transfected with scrambled siRNA (-) or siRNA molecules #1 and #2 targeting RICTOR (+) were starved in HBSS for 2 h. Chromatin was immunoprecipitated with specific antibodies against HSF1. DNA was amplified by PCR using primers covering the binding site for HSF1 in the ATG7 promoter (−1809 to − 1412) and separated on 1% agarose gel. The relatively increased band intensity indicates that the binding of HSF1 protein to ATG7 promoter is increased. Data represent mean ± S.E. (unpaired two-tailed Student’s t-test). All data were representative of the results of three independent experiments.
Figure 5.
Figure 5.
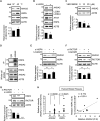
MTORC2-HSPA pathway may protect ANXA2 from lysosomal degradation. (A) Hs578T cells were heated (42°C for 3 h) and then incubated at 37°C for 24 h. Immunoblot analysis was conducted. The relative band intensities of ANXA2 were quantified by densitometry and normalized to ACTB. (B) Hs578T cells were transfected with siRNA targeting HSPA (+) or scrambled siRNA (-) as a control. Immunoblot analysis was conducted. The relative band intensities of ANXA2 were quantified by densitometry and normalized to ACTB. (C) As indicated, Hs578T cells were treated with VER155008 for 24 h. Immunoblot analysis was subjected. The relative band intensities of ANXA2 were quantified by densitometry and normalized to ACTB. (D) Whole cell lysates of Hs578T cells were immunoprecipitated with anti-ANXA2 antibody and immunoblotted with anti-HSPA antibody. (E and F) Hs578T cells were transfected with siRNA targeting HSPA (+, E), siRNA targeting RICTOR (+, F) or scrambled siRNA (-) as a control. The cells were treated with 50 μg/mL leupeptin for 24 h and subjected to immunoblot analysis. The relative band intensities of ANXA2 were quantified by densitometry and normalized to ACTB. (G) Hs578T cells were transfected with siRNA targeting RICTOR (+) or siRNA targeting HSPA (+). Scrambled siRNA (-) was used as a control. Immunoblot analysis was conducted. The relative band intensities of HSPA were quantified by densitometry and normalized to ACTB. (H) Quantification of immunoblot band densities for ANXA2 and HSPA which were normalized to ACTB in nine pairs of human breast cancer tissues (C) and adjacent normal tissues (N) from immunoblot analysis (left). Bars indicate average values (n = 9; unpaired two-tailed Student’s t-test). Pearson correlation coefficient (two-tailed Student’s t-test) between ANXA2 and HSPA protein expression (right). Data represent mean ± S.E. (unpaired two-tailed Student’s t-test). *,**,*** statistically significant at p < 0.05, p < 0.01, and p < 0.001. All data were representative of the results of three independent experiments.
Figure 6.
Figure 6.
ANXA2 knockdown increases doxorubicin sensitivity in TNBC cells. (A) Hs578T cells were transfected with siRNA targeting ANXA2 (+) or scrambled siRNA (-) as a control. The cells were treated with doxorubicin (0, 0.5, 1, 1.5, and 2 μM) for 24 h and subjected to MTT assay. (B) Hs578T cells were transfected with two siRNAs targeting ANXA2 (+) or scrambled siRNA (-) as a control. The cells were treated with 1 μM doxorubicin for 24 h and subjected to immunoblot analysis. Immunoblot analysis was conducted. The relative band intensities of cleaved PARP1 were quantified by densitometry and normalized to ACTB. (C) Flow cytometry results with ANXA5-FITC and PI staining. Hs578T cells were transfected with siRNA targeting ANXA2 or scrambled siRNA, and treated with 2 μM doxorubicin. After culture for 24 h, the cells were harvested and stained using ANXA5-FITC and PI. The apoptosis was analyzed by flow cytometry. (D) Hs578T cells were treated with A2ti-1 and doxorubicin for 24 h, as indicated concentration. MTT assay was conducted. Data represent mean ± S.E. (unpaired two-tailed Student’s t-test). *,**,*** statistically significant at p < 0.05, p < 0.01, and p < 0.001. All data were representative of the results of three independent experiments.
Figure 7.
Figure 7.
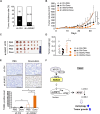
ANXA2 knockdown increases doxorubicin sensitivity and retards the tumor growth in the TNBC xenograft mouse model. (A) Hs578T cells stably transfected with shRNA targeting ANXA2 (sh ANAX2) or scrambled shRNA (sh Ctrl) were inoculated to Balb/c nude mice (n = 16 per group). The tumor incidence was calculated as the ratio of tumor-bearing mice (n) to total mice (n) for 17 days. The numbers in bars indicate the percentage of mice (black bar: the mice which developed tumors, white bar: the mice which did not develop tumors). (B-D) MDA-MB-231 cells stably transfected with shRNA targeting ANXA2 (sh ANAX2) or scrambled shRNA (sh Ctrl) were inoculated to Balb/c nude mice (n = 7 per group). Tumor‐bearing mice were randomized into four groups: control group (sh Ctrl-PBS), doxorubicin‐treated group (sh Ctrl-doxo), ANXA2 knockdown group (sh ANXA2-PBS), and combination of ANXA2 knockdown and doxorubicin‐treated group (sh ANXA2-doxo). Doxorubicin (3 mg/kg) or vehicle (PBS) was intravenously administered once a week for 33 days. Tumor volume was measured three times per a week using caliper (B). At the end of the study, animals were sacrificed. The excised tumors were obtained (C) and tumor weight was measured (D). * statistically significant at p < 0.05 (two way ANOVA followed by Tukey test). (E) TUNEL assay was performed using tumor tissues obtained from the mice in four groups. Apoptotic cells were stained as brown spots in the tissues and representative images were shown (scale bar = 100 μm). TUNEL-positive levels in the tissue were analyzed by Image J software. * statistically significant at p < 0.05 (two way ANOVA followed by Tukey test). (F) A proposed mechanism for the MTORC2-ANXA2-HSF1-ATG7 axis which plays a key role in autophagy of TNBC cells.

References

    1. Sotiriou C, Neo SY, McShane LM, et al. Breast cancer classification and prognosis based on gene expression profiles from a population-based study. Proc Natl Acad Sci USA. 2003;100(18):10393–10398. - PMC - PubMed
    1. Abramson VG, Mayer IA.. Molecular heterogeneity of triple negative breast cancer. Curr Breast Cancer Rep. 2014;6(3):154–158. - PMC - PubMed
    1. Mizushima N. Physiological functions of autophagy. Curr Top Microbiol Immunol. 2009;335:71–84. - PubMed
    1. Zoncu R, Efeyan A, Sabatini DM. mTOR: from growth signal integration to cancer, diabetes and ageing. Nat Rev Mol Cell Biol. 2011;12(1):21–35. - PMC - PubMed
    1. Zhou H, Huang S. Role of mTOR signaling in tumor cell motility, invasion and metastasis. Curr Protein Pept Sci. 2011;12(1):30–42. - PMC - PubMed

Publication types

LinkOut - more resources