Meta-Analysis
. 2024 Jan 30;15(1):888.
doi: 10.1038/s41467-024-44701-9.

Multi-trait analysis characterizes the genetics of thyroid function and identifies causal associations with clinical implications

Rosalie B T M Sterenborg #  1   2 Inga Steinbrenner #  3 Yong Li #  3 Melissa N Bujnis #  4 Tatsuhiko Naito #  5   6 Eirini Marouli #  7   8 Tessel E Galesloot  9 Oladapo Babajide  7 Laura Andreasen  10   11 Arne Astrup  12 Bjørn Olav Åsvold  13   14 Stefania Bandinelli  15 Marian Beekman  16 John P Beilby  17 Jette Bork-Jensen  18 Thibaud Boutin  19 Jennifer A Brody  20 Suzanne J Brown  21 Ben Brumpton  13   22 Purdey J Campbell  21 Anne R Cappola  23 Graziano Ceresini  24   25 Layal Chaker  26   27   28 Daniel I Chasman  29   30 Maria Pina Concas  31 Rodrigo Coutinho de Almeida  16 Simone M Cross  32 Francesco Cucca  33   34 Ian J Deary  35 Alisa Devedzic Kjaergaard  36 Justin B Echouffo Tcheugui  37 Christina Ellervik  30   38   39   40 Johan G Eriksson  41   42 Luigi Ferrucci  43 Jan Freudenberg  44 GHS DiscovEHRRegeneron Genetics CenterChristian Fuchsberger  45 Christian Gieger  46 Franco Giulianini  29 Martin Gögele  45 Sarah E Graham  47 Niels Grarup  18 Ivana Gunjača  48 Torben Hansen  18 Barbara N Harding  20   49 Sarah E Harris  35 Stig Haunsø  10   50 Caroline Hayward  19 Jennie Hui  51   52 Till Ittermann  53   54 J Wouter Jukema  55   56 Eero Kajantie  57   58   59 Jørgen K Kanters  11   60 Line L Kårhus  61 Lambertus A L M Kiemeney  9   62 Margreet Kloppenburg  63 Brigitte Kühnel  46 Jari Lahti  64 Claudia Langenberg  65   66   67 Bruno Lapauw  68 Graham Leese  69 Shuo Li  70 David C M Liewald  35 Allan Linneberg  60   71 Jesus V T Lominchar  18 Jian'an Luan  65 Nicholas G Martin  32 Antonela Matana  48 Marcel E Meima  2 Thomas Meitinger  72 Ingrid Meulenbelt  16 Braxton D Mitchell  73   74 Line T Møllehave  61 Samia Mora  29   30 Silvia Naitza  33 Matthias Nauck  54   75 Romana T Netea-Maier  1 Raymond Noordam  76 Casia Nursyifa  18 Yukinori Okada  5   6   77   78   79 Stefano Onano  33 Areti Papadopoulou  7 Colin N A Palmer  80 Cristian Pattaro  45 Oluf Pedersen  18   81 Annette Peters  82   83 Maik Pietzner  65   66   67 Ozren Polašek  84   85 Peter P Pramstaller  45 Bruce M Psaty  20   86 Ante Punda  87 Debashree Ray  88 Paul Redmond  35 J Brent Richards  89 Paul M Ridker  29   30 Tom C Russ  35   90 Kathleen A Ryan  73 Morten Salling Olesen  10   11 Ulla T Schultheiss  3   91 Elizabeth Selvin  88 Moneeza K Siddiqui  92 Carlo Sidore  33 P Eline Slagboom  16 Thorkild I A Sørensen  18   93 Enrique Soto-Pedre  80 Tim D Spector  94 Beatrice Spedicati  31   95 Sundararajan Srinivasan  80 John M Starr  90 David J Stott  96 Toshiko Tanaka  43 Vesela Torlak  87 Stella Trompet  55   76 Johanna Tuhkanen  64 André G Uitterlinden  26 Erik B van den Akker  16   97   98 Tibbert van den Eynde  67 Melanie M van der Klauw  99 Diana van Heemst  76 Charlotte Verroken  68 W Edward Visser  2 Dina Vojinovic  16   27 Henry Völzke  53   54 Melanie Waldenberger  46 John P Walsh  21   100 Nicholas J Wareham  65 Stefan Weiss  54   101 Cristen J Willer  47 Scott G Wilson  17   21   94 Bruce H R Wolffenbuttel  99 Hanneke J C M Wouters  99 Margaret J Wright  102 Qiong Yang  70 Tatijana Zemunik  48   87 Wei Zhou  103   104 Gu Zhu  32 Sebastian Zöllner  105   106 Johannes W A Smit  1 Robin P Peeters  2 Anna Köttgen  3   88   107 Alexander Teumer  108   109   110   111 Marco Medici  112   113
Affiliations
Meta-Analysis

Multi-trait analysis characterizes the genetics of thyroid function and identifies causal associations with clinical implications

Rosalie B T M Sterenborg et al. Nat Commun. .

Abstract

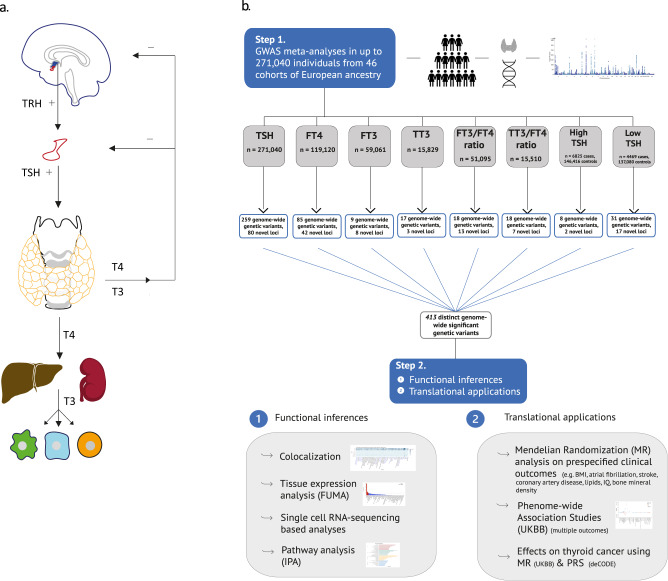
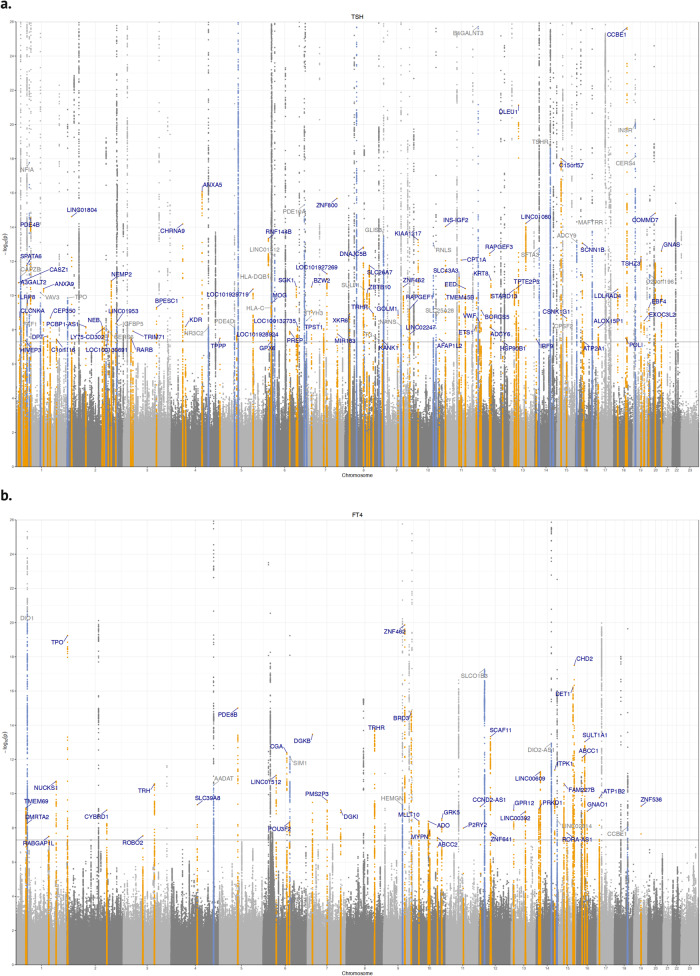
To date only a fraction of the genetic footprint of thyroid function has been clarified. We report a genome-wide association study meta-analysis of thyroid function in up to 271,040 individuals of European ancestry, including reference range thyrotropin (TSH), free thyroxine (FT4), free and total triiodothyronine (T3), proxies for metabolism (T3/FT4 ratio) as well as dichotomized high and low TSH levels. We revealed 259 independent significant associations for TSH (61% novel), 85 for FT4 (67% novel), and 62 novel signals for the T3 related traits. The loci explained 14.1%, 6.0%, 9.5% and 1.1% of the total variation in TSH, FT4, total T3 and free T3 concentrations, respectively. Genetic correlations indicate that TSH associated loci reflect the thyroid function determined by free T3, whereas the FT4 associations represent the thyroid hormone metabolism. Polygenic risk score and Mendelian randomization analyses showed the effects of genetically determined variation in thyroid function on various clinical outcomes, including cardiovascular risk factors and diseases, autoimmune diseases, and cancer. In conclusion, our results improve the understanding of thyroid hormone physiology and highlight the pleiotropic effects of thyroid function on various diseases.


Conflict of interest statement

B.M.P. serves on the Steering Committee of the Yale Open Data Access Project funded by Johnson & Johnson not directly related to this project. The remaining authors declare no competing interests.

Figures

Fig. 1
Fig. 1. Schematic design of the project and analyses.
a The hypothalamic-pituitary-thyroid axis is characterized by a negative feedback loop. The hypothalamus produces thyrotropin releasing hormone (TRH), which stimulates the pituitary to produce thyroxine-stimulating hormone (TSH). TSH stimulates the thyroid to produce thyroxine (T4) and triiodothyronine (T3), the active thyroid hormone affecting transcription in target cells. The majority of circulating T3 is produced by the liver and kidney by T4 to T3 conversion. b Step 1 represents the meta-analysis of 46 different European ancestry cohorts for eight thyroid function traits: TSH, FT4, FT3, TT3, FT3/FT4 ratio, TT3/FT4 ratio, high and low TSH. Step 2 shows the different secondary analyses performed using the meta-analyses results to identify the underlying mechanisms of the specific genome-wide variants and the translation to clinical diagnoses.
Fig. 2
Fig. 2. Genome wide association results for TSH, FT4, FT3 and FT3/FT4 ratio.
The circos plot depicts the association results for TSH, FT4, FT3 and the FT3/FT4 ratio combined: red band: –log10(p) for association in the meta-analysis of TSH, ordered by chromosomal position. The blue line indicates genome-wide significance (p = 5 × 10⁻⁸). Blue band: –log10(p) for association with FT4, ordered by chromosomal position. The red line indicates genome-wide significance (p = 5 × 10⁻⁸). Purple band: –log10(p) for association with FT3, ordered by chromosomal position. The blue line indicates genome-wide significance (p = 5 × 10⁻⁸). Green band: –log10(p) for association with the FT3/FT4 ratio, ordered by chromosomal position. The red line indicates genome-wide significance (p = 5 × 10⁻⁸). The outer band indicates the positions of the associated loci as defined in Methods. Adjacent loci for a trait with the same gene names are merged. The color follows the same pattern as the association plots of the four traits. All p-values were obtained from two-sided association tests (z-statistics), where correction for multiple testing is indicated by the level of genome-wide significance.
Fig. 3
Fig. 3. Zoomed Manhattan plot for TSH and FT4.
Zoomed Manhattan plot of the GWAS meta-analysis results for TSH (panel a) and FT4 (panel b). Variants are plotted on the x-axis according to their position on each chromosome with the -log10(p-value) of the association test on the y-axis. The horizontal line indicates the threshold for genome-wide significance, (p = 5 × 10⁻⁸). All p-values were obtained from two-sided association tests (z-statistics), where correction for multiple testing is indicated by the level of genome-wide significance. Novel loci are colored in orange, and novel independent associations within known loci are colored in light blue. Genetic variants were assigned to the nearest gene. Variants were considered known when they are in linkage disequilibrium with a previously identified variant (see Methods).
Fig. 4
Fig. 4. Genetic correlations of thyroid hormone parameters.
Pairwise genetic correlations were estimated via bivariate LD score regression. In the upper part, positive genetic correlations are shown in blue, and negative correlations are depicted in red as indicated by the legend. The lower part shows the genetic correlation values. FDR was calculated via the Benjamini–Hochberg method to correct for multiple testing of all 15 correlations. Larger squares correspond to stronger genetic correlation. Significant correlations are indicated by asterisks (FDR: * <0.05, ** <0.001, *** <0.0001).
Fig. 5
Fig. 5. Colocalization of associations for thyroid function parameters and gene expression.
In panel a, the different thyroid function traits are shown on the y-axis and the tested tissues (n = 49) derived from the GTEx database are shown on the x-axis. The number of significant colocalizations between thyroid function genome-wide significant variants and gene expression in the different tissues are shown in each box using a probability (P12) > 0.85 to confirm the H4 hypothesis (same shared causal variant). Tissue names are similarly colored when present in the same organ or belonging to the same group of tissues (blue or black). Detailed results of the colocalizations of TSH (panel b) and FT4 (panel c) are shown in the tissues of the hypothalamus-pituitary-thyroid axis.
Fig. 6
Fig. 6. Effects of genetic variants on different thyroid-related outcomes using Mendelian Randomization.
Twenty-four clinical outcomes were tested against the thyroid-related parameters. Significance thresholds are depicted either with a closed bubble (Bonferroni corrected) or an open bubble (nominal significance at p < 0.05). The direction of effect is depicted in color: blue shows a negative beta and red is a positive beta. The size of the bubble indicates the degree of the association in terms of -log10(p-value). All p-values were obtained from two-sided weighted median Mendelian Randomization tests. Clinical outcomes with at least one association with thyroid function parameters are depicted. Bone mineral density, anxiety, and major depressive disorder with zero associations are therefore not shown.
Fig. 7
Fig. 7. Polygenic risk score association results.
Significant associations between thyroid function parameter polygenic scores (PGSs) and diseases in the UKBB. The data points are color-coded by trait (legend) by phenotype groups (x-axis) and -log10(p-value) obtained from two-sided association tests (z-statistics) together with the direction of the effect (y-axis). All results shown passed the Bonferroni significance threshold (p < 0.05/1460).
Fig. 8
Fig. 8. Thyroid function polygenic risk scores and the risk of thyroid cancer.
Plots of the associations between thyroid parameter polygenic scores TSH (panel a) and FT3 (panel b) and thyroid cancer in deCODE (a; Ncase = 620, Ncontrol = 106,168, b; Ncase = 686, Ncontrol = 119,187). The y-axis shows the probability of thyroid cancer. The x-axis shows the percentage of risk alleles carried out based on a weighted polygenic score. The histogram shows the distribution of the polygenic score in the study sample per trait. Ncase: sample size of cases. Ncontrol: sample size of controls.

References

    1. Taylor PN, et al. Global epidemiology of hyperthyroidism and hypothyroidism. Nat. Rev. Endocrinol. 2018;14:301–316. doi: 10.1038/nrendo.2018.18. - DOI - PubMed
    1. Maenhaut, C. et al. Ontogeny, anatomy, metabolism and physiology of the thyroid. in Endotext (eds. Feingold, K. R. et al.) (South Dartmouth (MA), 2015). - PubMed
    1. Walsh JP. Thyroid function across the lifespan: do age-related changes matter? Endocrinol. Metab. (Seoul.) 2022;37:208–219. doi: 10.3803/EnM.2022.1463. - DOI - PMC - PubMed
    1. Fliers E, Kalsbeek A, Boelen A. Beyond the fixed setpoint of the hypothalamus-pituitary-thyroid axis. Eur. J. Endocrinol. 2014;171:R197–R208. doi: 10.1530/EJE-14-0285. - DOI - PubMed
    1. Fitzgerald SP, Bean NG. The Relationship between Population T4/TSH Set Point Data and T4/TSH Physiology. J. Thyroid Res. 2016;2016:6351473. doi: 10.1155/2016/6351473. - DOI - PMC - PubMed

Publication types