. 2024 Jan 30;15(1):910.
doi: 10.1038/s41467-024-44811-4.

VEXAS syndrome is characterized by inflammasome activation and monocyte dysregulation

Affiliations

VEXAS syndrome is characterized by inflammasome activation and monocyte dysregulation

Olivier Kosmider et al. Nat Commun. .

Abstract

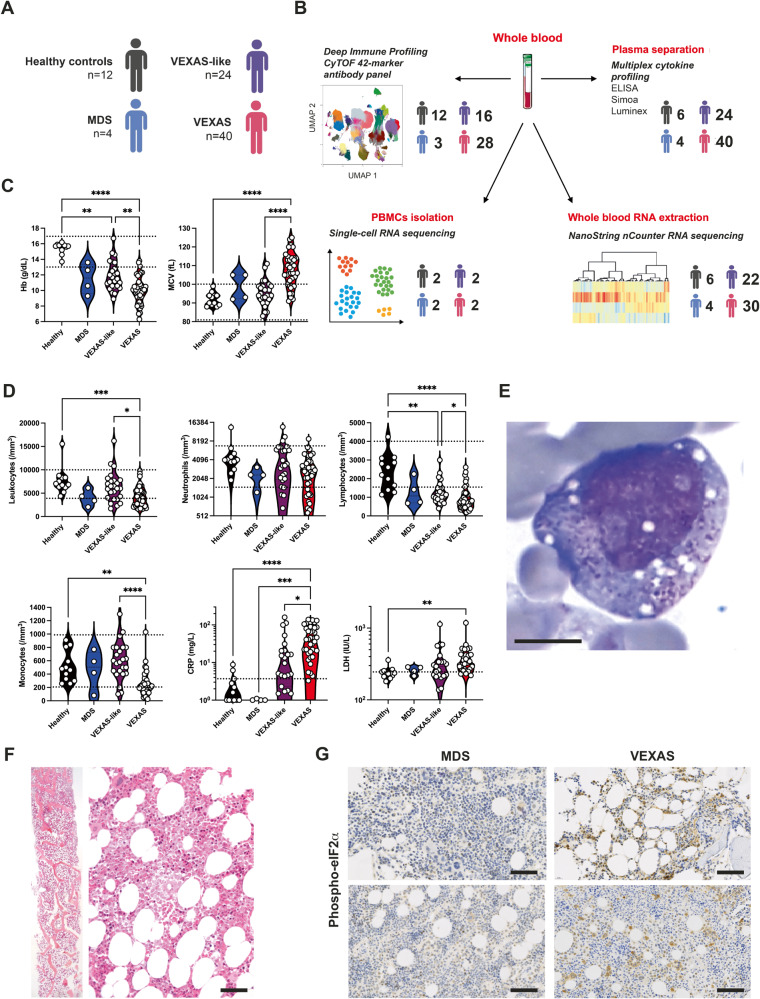
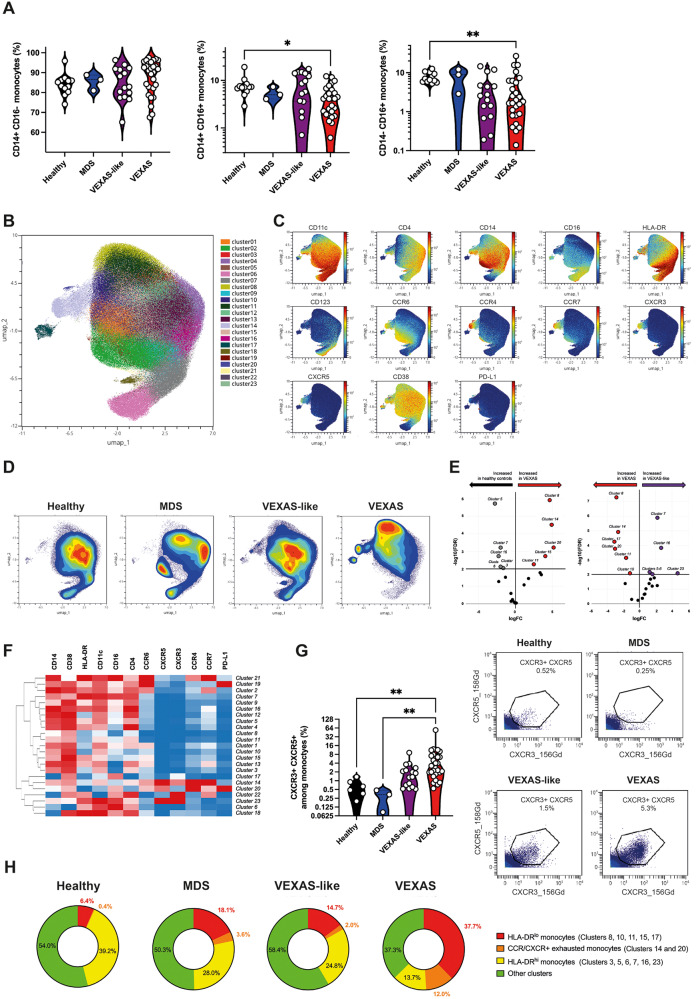
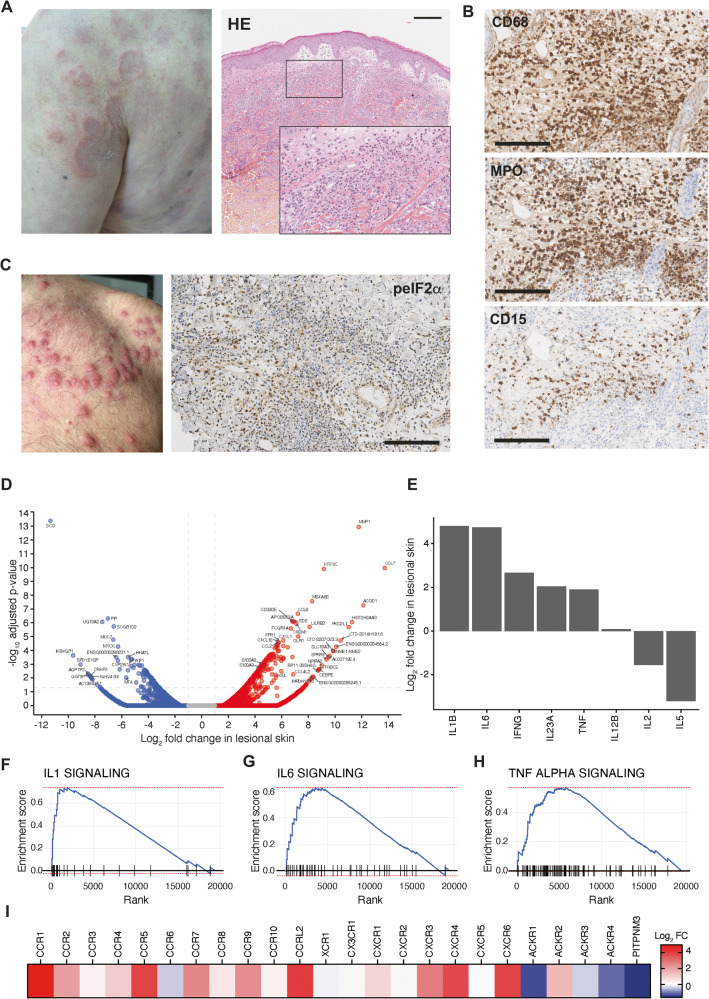
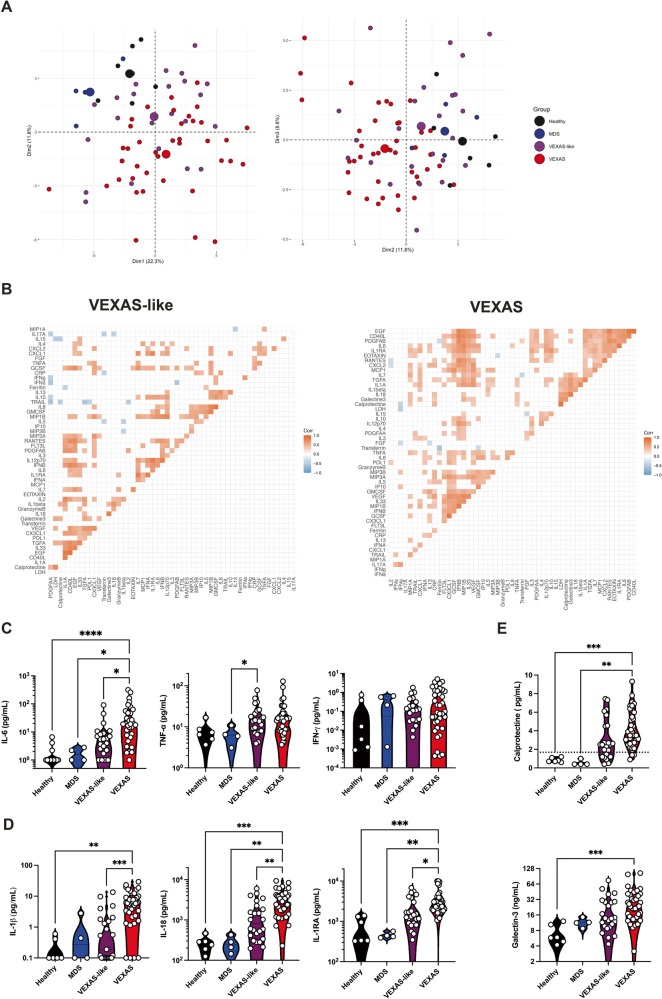
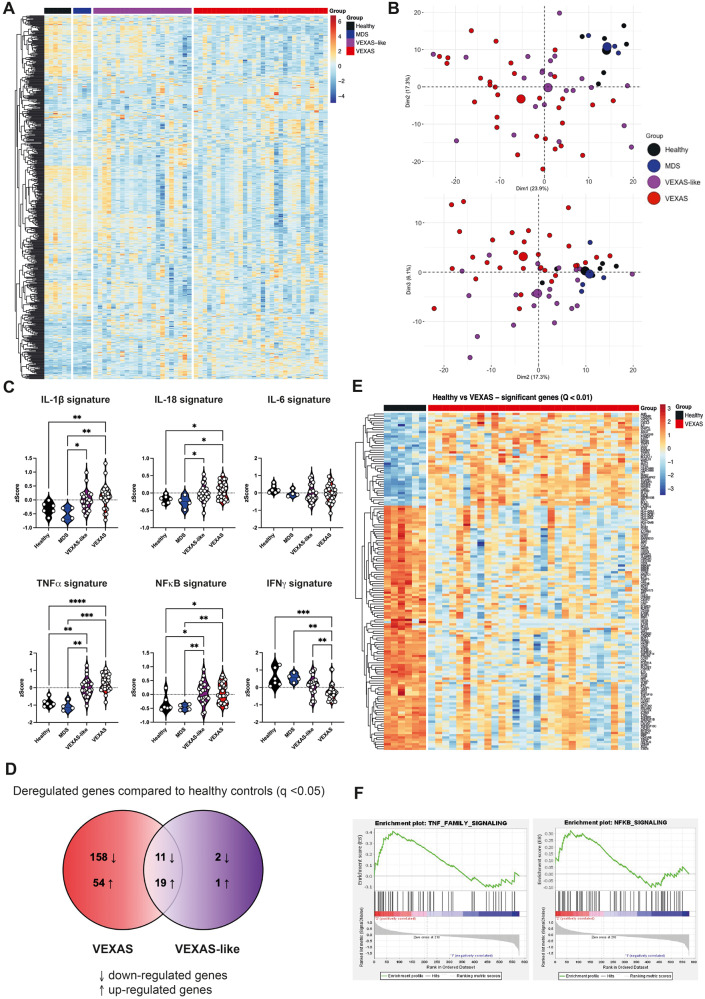
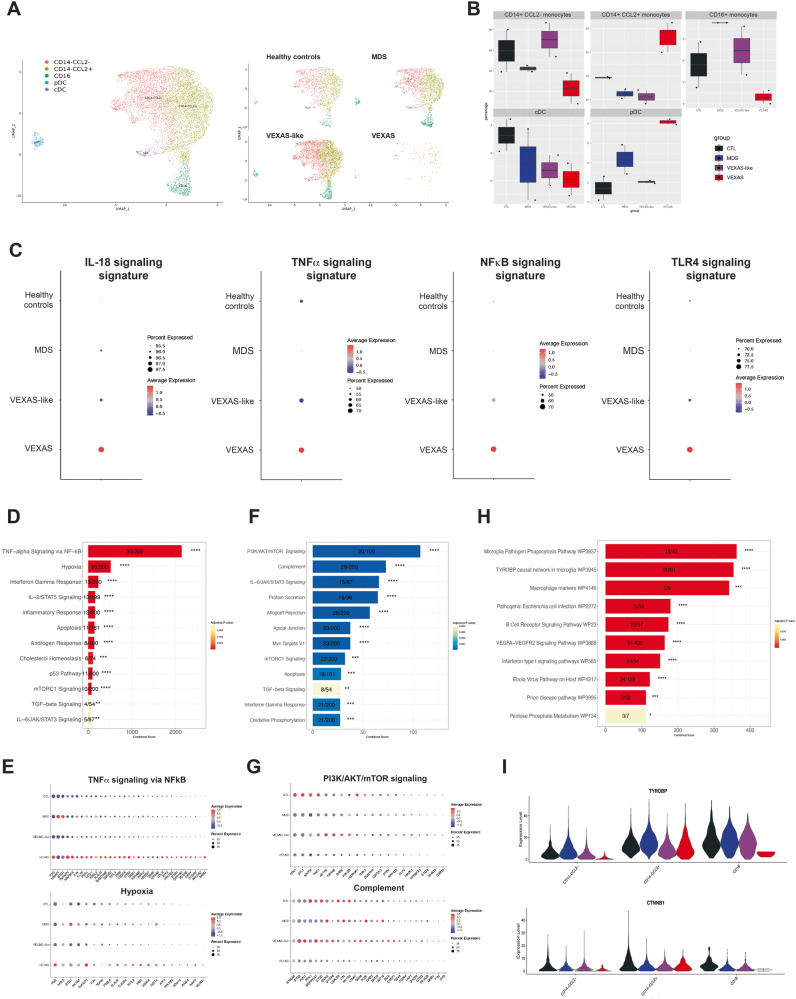
Acquired mutations in the UBA1 gene were recently identified in patients with severe adult-onset auto-inflammatory syndrome called VEXAS (vacuoles, E1 enzyme, X-linked, autoinflammatory, somatic). However, the precise physiological and clinical impact of these mutations remains poorly defined. Here we study a unique prospective cohort of VEXAS patients. We show that monocytes from VEXAS are quantitatively and qualitatively impaired and display features of exhaustion with aberrant expression of chemokine receptors. In peripheral blood from VEXAS patients, we identify an increase in circulating levels of many proinflammatory cytokines, including IL-1β and IL-18 which reflect inflammasome activation and markers of myeloid cells dysregulation. Gene expression analysis of whole blood confirms these findings and also reveals a significant enrichment of TNF-α and NFκB signaling pathways that can mediate cell death and inflammation. This study suggests that the control of the nflammasome activation and inflammatory cell death could be therapeutic targets in VEXAS syndrome.


Conflict of interest statement

The authors declare no competing interests.

Figures

Fig. 1
Fig. 1. Clinical and laboratory findings in patients with VEXAS syndrome, VEXAS-like, MDS and healthy controls.
A, B 40 individuals with VEXAS syndrome, 26 individuals with VEXAS-like, 4 with MDS and 12 aged gender-matched healthy controls were included, and samples were assessed using deep immune profiling, plasma multiplex cytokine profiling, whole blood RNA extraction and single-cell RNA sequencing. C Hemoglobin (Hb) and mean corpuscular volume (MCV) from patients with VEXAS syndrome, VEXAS-like, MDS and healthy controls (Hb, ****P  <  0.0001, **P  =  0.0068 and **P = 0.0048; MCV, ****P < 0.0001). Each dot represents a single patient. D Leukocytes, neutrophils, lymphocytes and monocytes count, C-reactive protein (CRP) and lactate dehydrogenase (LDH) from patients with VEXAS, VEXAS-like, MDS and healthy controls (leukocytes, ***P  =  0.0008 and *P  =  0.0202; lymphocytes, ****P  <  0.0001, **P  =  0.0049 and *P  =  0.0163; monocytes, ****P  <  0.0001 and **P  =  0.0039; CRP, ****P  <  0.0001, ***P  =  0.0006 and *P = 0.0139; LDH, **P = 0.0017). Each dot represents a single patient. E Bone marrow aspiration showing vacuoles restricted to myeloid and erythroid precursor cells in a VEXAS patient (MGG staining, ×100, scale bar 10 μm). F Bone marrow biopsy from a VEXAS patient showing overrepresentation of the myeloid cell lineage with mature and immature forms (Magnification ×20, scale bar 100 μm). G Immunohistochemical staining of phosphorylated eIF2α on bone marrow biopsy from MDS and VEXAS patients, showing expression of p‑EIF2α only in VEXAS (Magnification ×20, scale bar 100 μm). P values were determined by the two-sided Kruskal-Wallis test, followed by Dunn’s post test for multiple group comparisons. *P < 0.05; **P < 0.01; ***P < 0.001, ****P < 0.0001.
Fig. 2
Fig. 2. Phenotyping of peripheral blood monocytes in VEXAS syndrome.
A Proportions (frequencies) of classical (CD14+, CD16), intermediate (CD14+, CD16+), and nonclassical (CD14lo, CD16+) monocytes among blood monocytes from VEXAS patients, VEXAS-like patients, MDS and healthy controls, were analyzed (CD14+, CD16+, *P  =  0.00379; CD14lo, CD16+, **P  =  0.0084). Each dot represents a single patient. B Non-supervised Uniform Manifold Approximation and Projection (UMAP) of blood monocytes. Cells are automatically separated into spatially distinct subsets according to the combination of markers that they express. C UMAP of blood monocytes stained with 13 markers and measured with mass cytometry. D UMAP colored according to cell density across patients’ groups. Red indicates the highest density of cells. E Volcan plots of differentially represented monocyte subsets showing clusters increased or decreased in VEXAS patients compared to healthy controls, and VEXAS patients compared to VEXAS-like. F Heatmap representation of all monocyte clusters, ordered by hierarchical clustering and expression of the cell surface markers. G Proportion (frequencies) of CXCR3 + CXCR5+ expressing monocytes. Each dot represents a single patient. Gating strategy for the analysis of expression of CXCR3 and CXCR5 on blood monocytes, Illustrative dot plots are shown and enumeration of percentages of CXCR3 + CXCR5+ cells (**P  =  0.0012 and **P  =  0.0048). H Pie chart showing the proportion of HLA-DRlo dysfunctional monocytes, exhausted monocytes expressing chemokine receptors, HLA-DRhi functional monocytes, and other clusters not significantly different between groups. Numbers on the pie charts indicate the median proportion of each monocytes subsets in each group. P values were determined by the two-sided Kruskal-Wallis test, followed by Dunn’s post test for multiple group comparisons. *P < 0.05; **P < 0.01; ***P < 0.001, ****P < 0.0001.
Fig. 3
Fig. 3. Characterization and anatomical localization of myeloid cells within skin lesion from VEXAS patients.
A Picture of neutrophilic dermatosis and hematoxylin-eosin staining of skin biopsy of a VEXAS patient. Illustrative picture is shown (Magnification × 10 and × 20, scale bar 100 μm). B Immunohistochemical staining of CD68, myeloperoxidase (MPO) and CD15 of the same skin biopsy. Illustrative picture is shown (Magnification × 40, scale bar 50 μm). C Picture of neutrophilic dermatosis of another VEXAS patient and immunohistochemical staining of phosphorylated eIF2α on skin biopsy from a VEXAS patient, showing expression of p‑EIF2α in skin lesions. Illustrative picture is shown (Magnification ×40, scale bar 50 μm). D Ratio average (RA) plot showing the log ratio in lesional skin versus the average log abundance for each gene. E Expression of IFN-γ, IL-12B, IL-1β, IL-2, IL-23A, IL-5, IL-6 and TNF in TPM in lesional and non lesional skin from a VEXAS patient. F, G, H Gene set enrichment analysis of IL-1, IL-6 and TNF-a pathways enriched in VEXAS lesional skin versus non lesional skin. I Expression of chemokine receptors in VEXAS lesional skin.
Fig. 4
Fig. 4. Inflammatory cytokine and chemokines profiling of VEXAS syndrome.
A Principal component analysis of the cytokine and chemokine data according to dimensions 1, 2 and 3. Median values for each patients’ group are plotted with the large colored circle. Each dot represents a single patient. B Correlation matrices across all values of cytokines and chemokines from patient blood, comparing patients with VEXAS and VEXAS-like. Only significant correlations (<0.05) are represented as squares. Pearson’s correlation coefficients from comparisons of cytokine and chemokine measurements within the same patients are visualized by color intensity. C IL-6, TNF-α and IFN-γ from patients with VEXAS, VEXAS-like, MDS and healthy controls (IL-6, ****P  <  0.0001, *P  =  0.0156 and *P  =  0.0267; TNF-α, *P  =  0.0377). Each dot represents a single patient. D IL-1β, IL-18 and IL-1RA from patients with VEXAS, VEXAS-like, MDS and healthy controls (IL-1β, ***P  =  0.0002 and **P  =  0.0016; IL-18, ***P  =  0.0002, **P  =  0.0022 and **P  =  0.0050; IL-1RA, ***P  =  0.0006, **P  =  0.0016 and *P  =  0.0164). Each dot represents a single patient. E Calprotectin and galectin-3 from patients with VEXAS, VEXAS-like, MDS and healthy controls (calprotectin, ***P  =  0.0006 and **P  =  0.0012; galectin-3, ***P  =  0.0009). Each dot represents a single patient. P values were determined by the two-sided Kruskal-Wallis test, followed by Dunn’s post test for multiple group comparisons. *P < 0.05; **P < 0.01; ***P < 0.001, ****P < 0.0001.
Fig. 5
Fig. 5. Immunological transcriptional signatures in VEXAS syndrome.
A Heatmap representation of 579 immunological genes measured by Nanostring approach, ordered by hierarchical clustering in healthy controls (n = 6), MDS (n = 4), VEXAS-like (n = 23), and VEXAS (n = 29). B Principal component analysis of the transcriptional data according to the 4 groups of patients. Median values for each patients’ group are plotted with the large colored circle. C Comparison of IL-1β, IL-18, IL-6, TNF-α, NFκB and type II IFN gene signatures expression in healthy controls, MDS, VEXAS-like and VEXAS patients (IL-1β, **P  =  0.007, **P  =  0.0032 and *P  =  0.0387; IL-18, *P  =  0.0189, *P  =  0.0107 and *P  =  0.0491; TNF-α, ****P  <  0.0001, ***P  =  0.0002, **P  =  0.0071 and **P  =  0.0092; NFκB, **P  =  0.0039, **P  =  0.0058, *P  =  0.0117 and *P  =  0.0180; IFN-γ, ***P  =  0.0010; **P  =  0.0029 and **P  =  0.0096). Each dot represents a single patient. D Venn diagram representation showing significant differential gene expression in VEXAS or VEXAS-like patients versus healthy controls. E Heatmap representation of differentially expressed genes (q-value < 0.01) in healthy controls (n = 6) and VEXAS (n = 29) patients, ordered by hierarchical clustering. F Gene set enrichment analysis of pathways enriched in VEXAS versus healthy controls, i.e., TNF-α signaling and NFκB signaling. P values were determined by the two-sided Kruskal-Wallis test, followed by Dunn’s post test for multiple group comparisons. *P < 0.05; **P < 0.01; ***P < 0.001, ****P < 0.0001.
Fig. 6
Fig. 6. Visual representation of single-cell transcriptomic data of monocytes in VEXAS syndrome.
A UMAP plots showing the projection of single myeloid cells from PBMCs from patients with VEXAS (n = 2), VEXAS-like (n = 2), MDS (n = 2) and healthy controls (n = 2). B Proportion (frequencies) of the myeloid cell subsets, i.e. CD14 + CCL2+ monocytes, CD14 + CCL2- monocytes, CD16+ monocytes, cDC and pDC from each patients’ group. Box plots indicate here the minimum value, the first quartile, the median, the third quartile, and the maximum value. C IL-18, TNF-α, NFκB and TLR4 signaling Gene expression signatures in monocytes from each patients’ group. The size of the dot represents the percentage of cells in the clusters expressing the gene expression signature and the color intensity represents the average expression of the signature in that cluster. D Enriched GO functions of up-regulated pathways in monocytes from VEXAS versus healthy controls. E Detailed analysis of the two most up-regulated pathways in monocytes from VEXAS, i.e. TNF-α signaling via NF∣B pathway and hypoxia. F Enriched GO functions of up-regulated and down-regulated pathways in monocytes from VEXAS versus healthy controls. G Detailed analysis of the two most down-regulated pathways in monocytes from VEXAS, i.e. PI3K/AKT/mTOR signaling and complement pathways. H Top pathways enriched for pathway analysis through Wikipathways in dysregulated genes in monocytes from VEXAS versus healthy controls. I Expression levels in each monocyte subsets of TYROBP, encoding for DAP12, and CTNNB1, encoding catenin beta-1,in each patients’ group.

References

    1. Beck DB, et al. Somatic mutations in UBA1 and severe adult-onset autoinflammatory disease. N. Engl. J. Med. 2020;383:2628–2638. doi: 10.1056/NEJMoa2026834. - DOI - PMC - PubMed
    1. Templé M, et al. Atypical splice-site mutations causing VEXAS syndrome. Rheumatol. (Oxf.) 2021;60:e435–e437. doi: 10.1093/rheumatology/keab524. - DOI - PubMed
    1. Groen EJN, Gillingwater TH. UBA1: at the crossroads of ubiquitin homeostasis and neurodegeneration. Trends Mol. Med. 2015;21:622–632. doi: 10.1016/j.molmed.2015.08.003. - DOI - PMC - PubMed
    1. Arlet J-B, Terrier B, Kosmider O. Mutant UBA1 and severe adult-onset autoinflammatory disease. N. Engl. J. Med. 2021;384:2163. doi: 10.1056/NEJMc2102124. - DOI - PubMed
    1. Ferrada MA, et al. Somatic mutations in UBA1 define a distinct subset of relapsing polychondritis patients with VEXAS. Arthritis Rheumatol. 2021;73:1886–1895. doi: 10.1002/art.41743. - DOI - PubMed

Supplementary concepts