

Cost-efficient management of peatland to enhance biodiversity in Finland
- PMID: 38291097
- PMCID: PMC10827728
- DOI: 10.1038/s41598-024-52964-x
Cost-efficient management of peatland to enhance biodiversity in Finland
Abstract
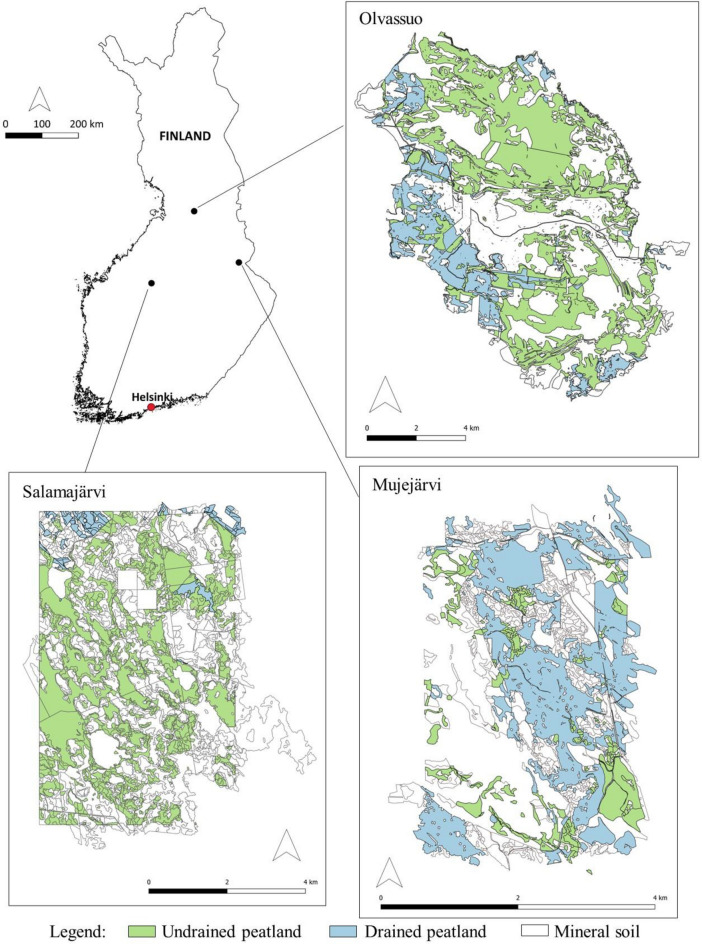
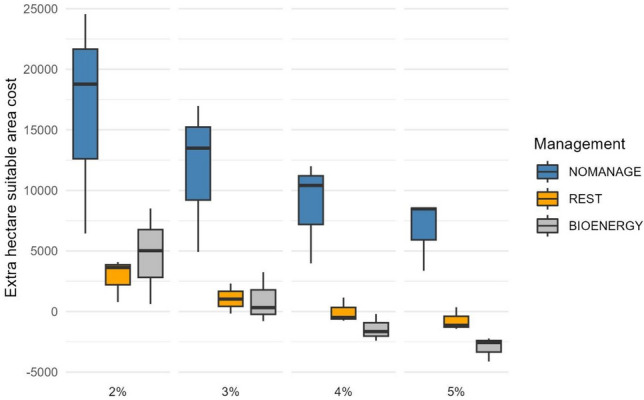
Peatlands provide a variety of ecosystem services besides being important ecosystems for biodiversity. Sustainable peatland management requires that its impacts are identified, and all management is allocated in a cost-efficient manner. In this study, we assessed how peatland management influences the habitat suitability of red-listed plant species and the financial performance of management measured as net present value (NPV). The study was done in three landscapes in Finland. We considered four peatland management scenarios i.e., no management activity (NOMANAGE), hydrological restoration (REST), wood harvesting for bioenergy (BIOENERGY), and timber production (TIMBER). The NPVs of different management scenarios were compared to the habitat suitability of red-listed peatland plant species. A cost-impact analysis was used, with TIMBER as a baseline scenario, to find out which alternative scenario would be the most cost-efficient in contributing to habitat suitability. Our study shows that potential habitat areas were significantly different between the scenarios. REST provided the largest potential habitat areas, followed by BIOENERGY, NOMANAGE, and TIMBER. TIMBER provided the best financial performance when low interest rates were used. REST and BIOENERGY were more cost-efficient in enhancing potential habitat areas than NOMANAGE. REST would improve suitable habitats and provide financial benefits when a higher interest rate was used. In conclusion, even a win-win condition could be achieved in some cases (33%), in which higher NPV was achieved simultaneously with improved potential habitat areas. The study provides information for alleviating the economic barriers of restoration and targeting land use and management options cost-efficiently.
© 2024. The Author(s).
Conflict of interest statement
The authors declare no competing interests.
Figures


References
-
- Yu ZC. Northern peatland carbon stocks and dynamics: A review. Biogeosciences. 2012;9:4071–4085. doi: 10.5194/bg-9-4071-2012. - DOI
-
- Zedler JB, Kercher S. Wetland resources: Status, trends, ecosystem services, and restorability. Ann. Rev. Environ. Resour. 2005;30:39–74. doi: 10.1146/annurev.energy.30.050504.144248. - DOI
-
- Nuutinen S, et al. The role of peatlands in finnish wood production the role of peatlands in Finnish wood production-an analysis based on large-scale forest scenario modelling. Silva Fennica. 2000;34:131–153. doi: 10.14214/sf.636. - DOI
-
- Tanneberger F, et al. The power of nature-based solutions: How peatlands can help us to achieve key EU sustainability objectives. Adv. Sustain. Syst. 2021;5:2000146. doi: 10.1002/adsu.202000146. - DOI
-
- Paavilainen E, Päivänen J. Peatland Forestry. Springer; 1995.
MeSH terms
LinkOut - more resources
Full Text Sources
Miscellaneous
