Establishment of a synchronized tyrosinase transport system revealed a role of Tyrp1 in efficient melanogenesis by promoting tyrosinase targeting to melanosomes
- PMID: 38291221
- PMCID: PMC10827793
- DOI: 10.1038/s41598-024-53072-6
Establishment of a synchronized tyrosinase transport system revealed a role of Tyrp1 in efficient melanogenesis by promoting tyrosinase targeting to melanosomes
Abstract
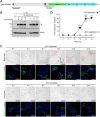
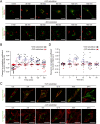
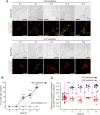
Tyrosinase (Tyr) is a key enzyme in the process of melanin synthesis that occurs exclusively within specialized organelles called melanosomes in melanocytes. Tyr is synthesized and post-translationally modified independently of the formation of melanosome precursors and then transported to immature melanosomes by a series of membrane trafficking events that includes endoplasmic reticulum (ER)-to-Golgi transport, post-Golgi trafficking, and endosomal transport. Although several important regulators of Tyr transport have been identified, their precise role in each Tyr transport event is not fully understood, because Tyr is present in several melanocyte organelles under steady-state conditions, thereby precluding the possibility of determining where Tyr is being transported at any given moment. In this study, we established a novel synchronized Tyr transport system in Tyr-knockout B16-F1 cells by using Tyr tagged with an artificial oligomerization domain FM4 (named Tyr-EGFP-FM4). Tyr-EGFP-FM4 was initially trapped at the ER under oligomerized conditions, but at 30 min after chemical dissociation into monomers, it was transported to the Golgi and at 9 h reached immature melanosomes. Melanin was then detected at 12 h after the ER exit of Tyr-EGFP-FM4. By using this synchronized Tyr transport system, we were able to demonstrate that Tyr-related protein 1 (Tyrp1), another melanogenic enzyme, is a positive regulator of efficient Tyr targeting to immature melanosomes. Thus, the synchronized Tyr transport system should serve as a useful tool for analyzing the molecular mechanism of each Tyr transport event in melanocytes as well as in the search for new drugs or cosmetics that artificially regulate Tyr transport.
© 2024. The Author(s).
Conflict of interest statement
The authors declare no competing interests.
Figures


Similar articles
-
Rab32/38-Dependent and -Independent Transport of Tyrosinase to Melanosomes in B16-F1 Melanoma Cells.Int J Mol Sci. 2022 Nov 16;23(22):14144. doi: 10.3390/ijms232214144. Int J Mol Sci. 2022. PMID: 36430618 Free PMC article.
-
Regulation of tyrosinase processing and trafficking by organellar pH and by proteasome activity.J Biol Chem. 2004 Feb 27;279(9):7971-81. doi: 10.1074/jbc.M309714200. Epub 2003 Nov 21. J Biol Chem. 2004. PMID: 14634018
-
Melanosomal pH controls rate of melanogenesis, eumelanin/phaeomelanin ratio and melanosome maturation in melanocytes and melanoma cells.Exp Cell Res. 2001 Aug 1;268(1):26-35. doi: 10.1006/excr.2001.5251. Exp Cell Res. 2001. PMID: 11461115
-
Membrane transport proteins in melanosomes: Regulation of ions for pigmentation.Biochim Biophys Acta Biomembr. 2020 Dec 1;1862(12):183318. doi: 10.1016/j.bbamem.2020.183318. Epub 2020 Apr 22. Biochim Biophys Acta Biomembr. 2020. PMID: 32333855 Free PMC article. Review.
-
Assembly, target-signaling and intracellular transport of tyrosinase gene family proteins in the initial stage of melanosome biogenesis.Pigment Cell Res. 2000 Aug;13(4):222-9. doi: 10.1034/j.1600-0749.2000.130403.x. Pigment Cell Res. 2000. PMID: 10952389 Review.
Cited by
-
Genetic mutations disrupt the coordinated mode of tyrosinase's intra-melanosomal domain.Protein Sci. 2025 Aug;34(8):e70209. doi: 10.1002/pro.70209. Protein Sci. 2025. PMID: 40671279 Free PMC article.
-
Drug Repurposing of Voglibose, a Diabetes Medication for Skin Health.Pharmaceuticals (Basel). 2025 Feb 7;18(2):224. doi: 10.3390/ph18020224. Pharmaceuticals (Basel). 2025. PMID: 40006038 Free PMC article.
-
Genetic mutations disrupt the coordinated mode of tyrosinase intra-melanosomal domain.bioRxiv [Preprint]. 2025 Apr 25:2025.04.21.649833. doi: 10.1101/2025.04.21.649833. bioRxiv. 2025. Update in: Protein Sci. 2025 Aug;34(8):e70209. doi: 10.1002/pro.70209. PMID: 40568124 Free PMC article. Updated. Preprint.
-
Genomic Features and Tissue Expression Profiles of the Tyrosinase Gene Family in the Chinese Soft-Shelled Turtle (Pelodiscus sinensis).Genes (Basel). 2025 Jul 17;16(7):834. doi: 10.3390/genes16070834. Genes (Basel). 2025. PMID: 40725490 Free PMC article.
References
-
- Fitzpatrick TB, Breathnach AS. The epidermal melanin unit system. Dermatol. Wochenschr. 1963;147:481–489. - PubMed
-
- Byers H, et al. Melanosome processing in keratinocytes. In: Nordlund JJ, et al., editors. The Pigmentary System: Physiology and Pathophysiology. 2. Wiley; 2007. pp. 181–190.
MeSH terms
Substances
Grants and funding
LinkOut - more resources
Full Text Sources
Research Materials

