. 2024 Jan 30;8(1):24.
doi: 10.1038/s41698-024-00509-w.

Multi-omics analysis reveals NNMT as a master metabolic regulator of metastasis in esophageal squamous cell carcinoma

Affiliations

Multi-omics analysis reveals NNMT as a master metabolic regulator of metastasis in esophageal squamous cell carcinoma

Qi Huang et al. NPJ Precis Oncol. .

Abstract

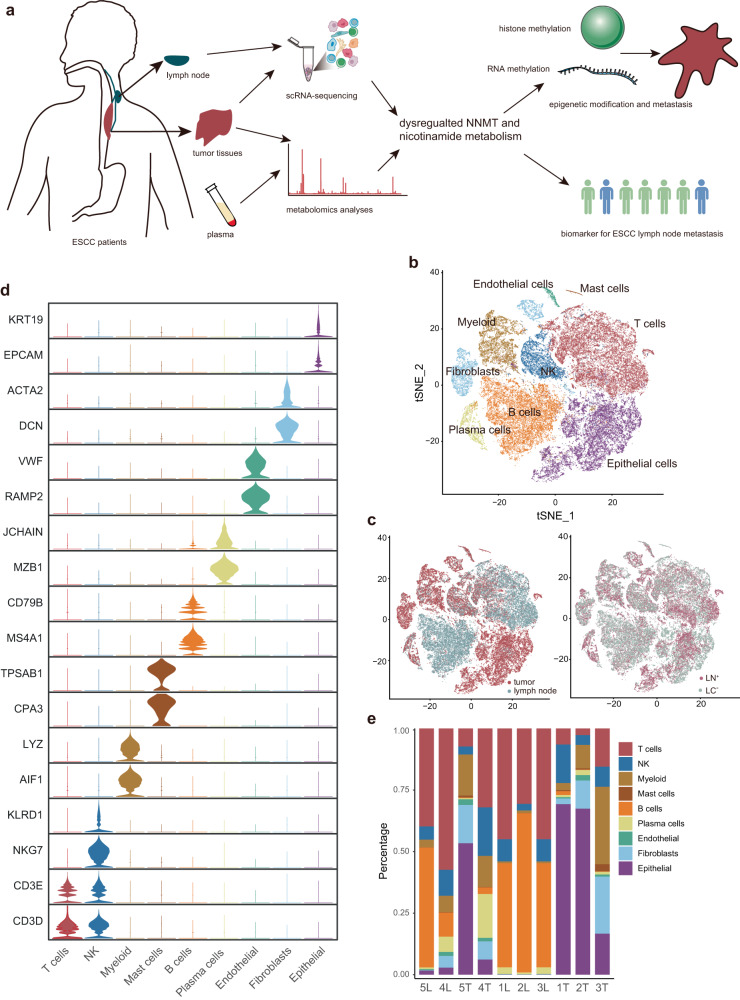
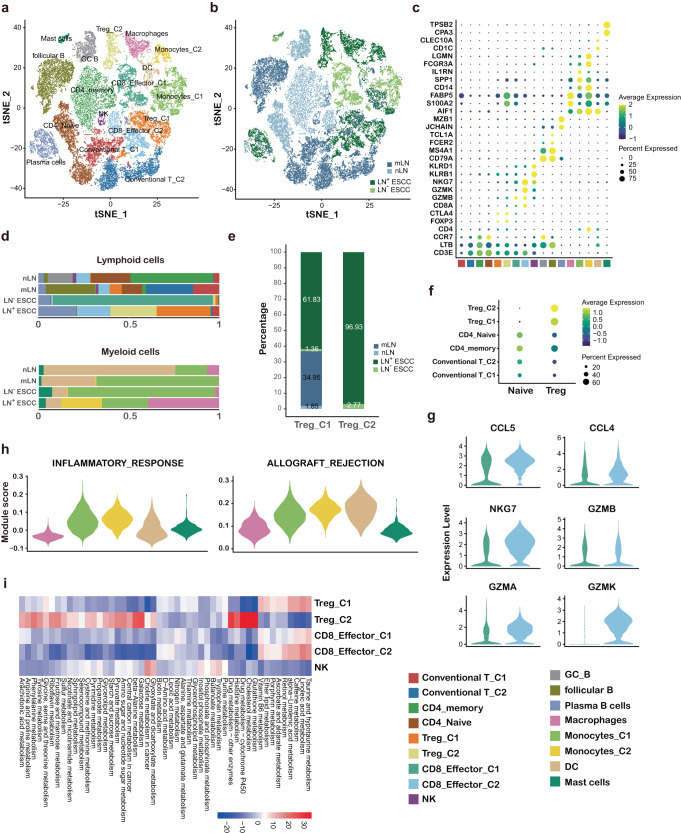
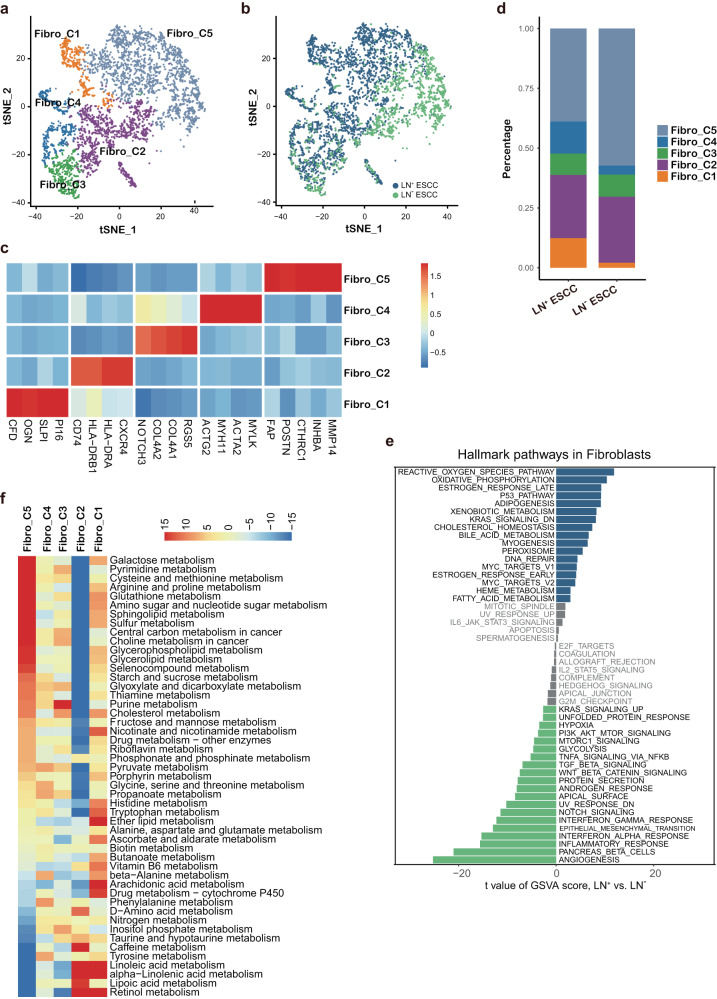
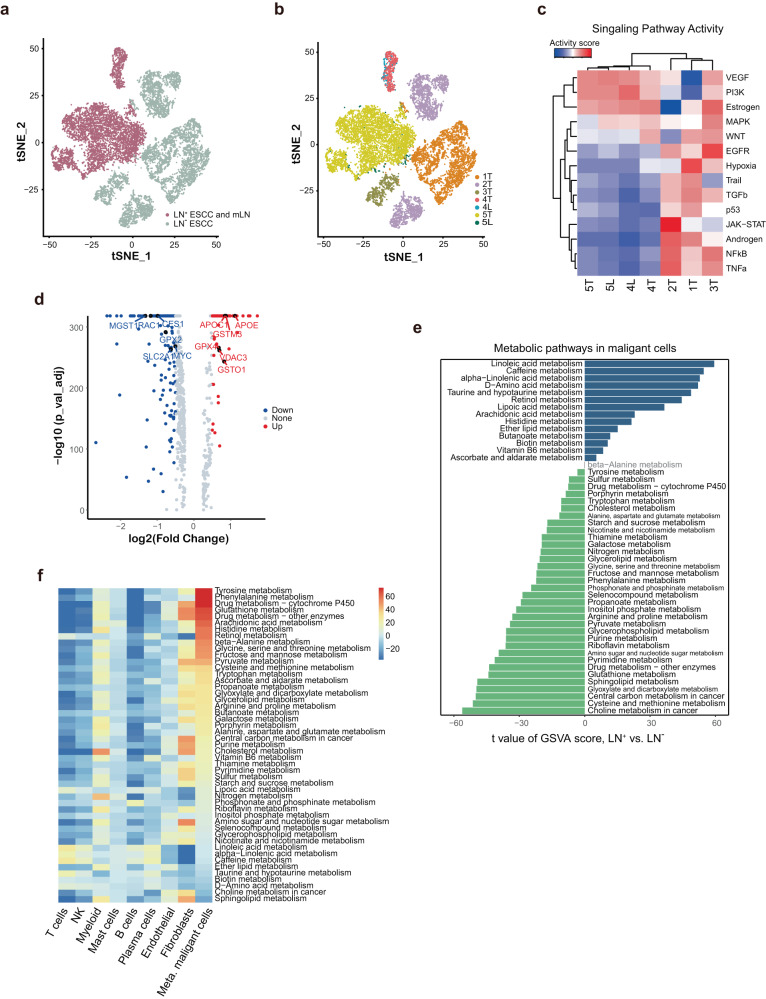
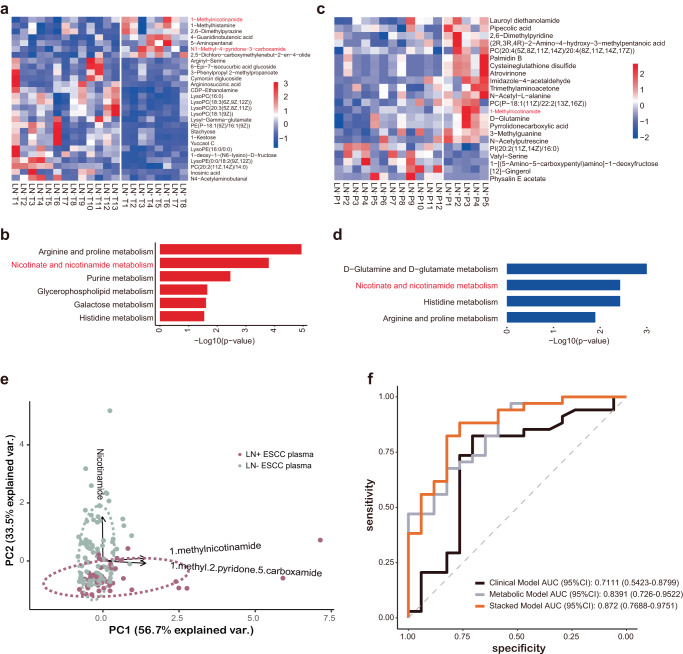
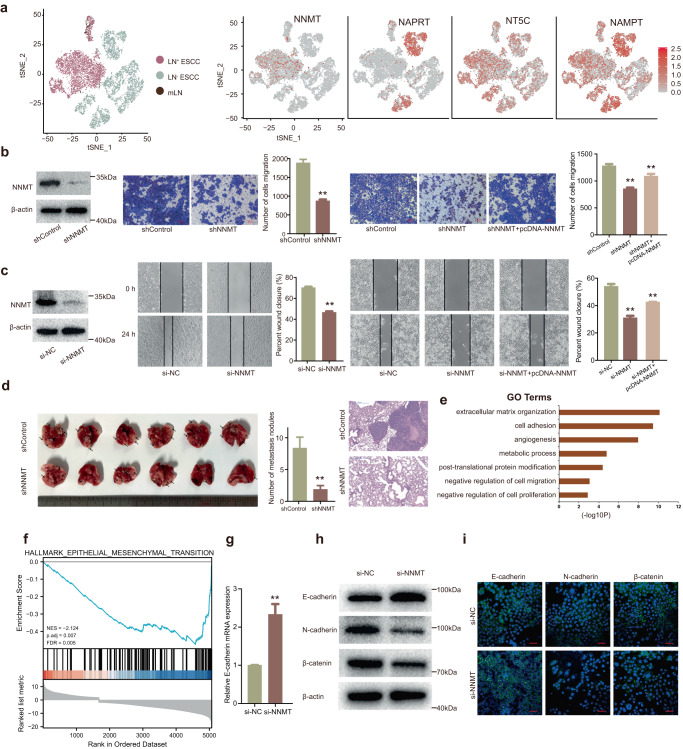
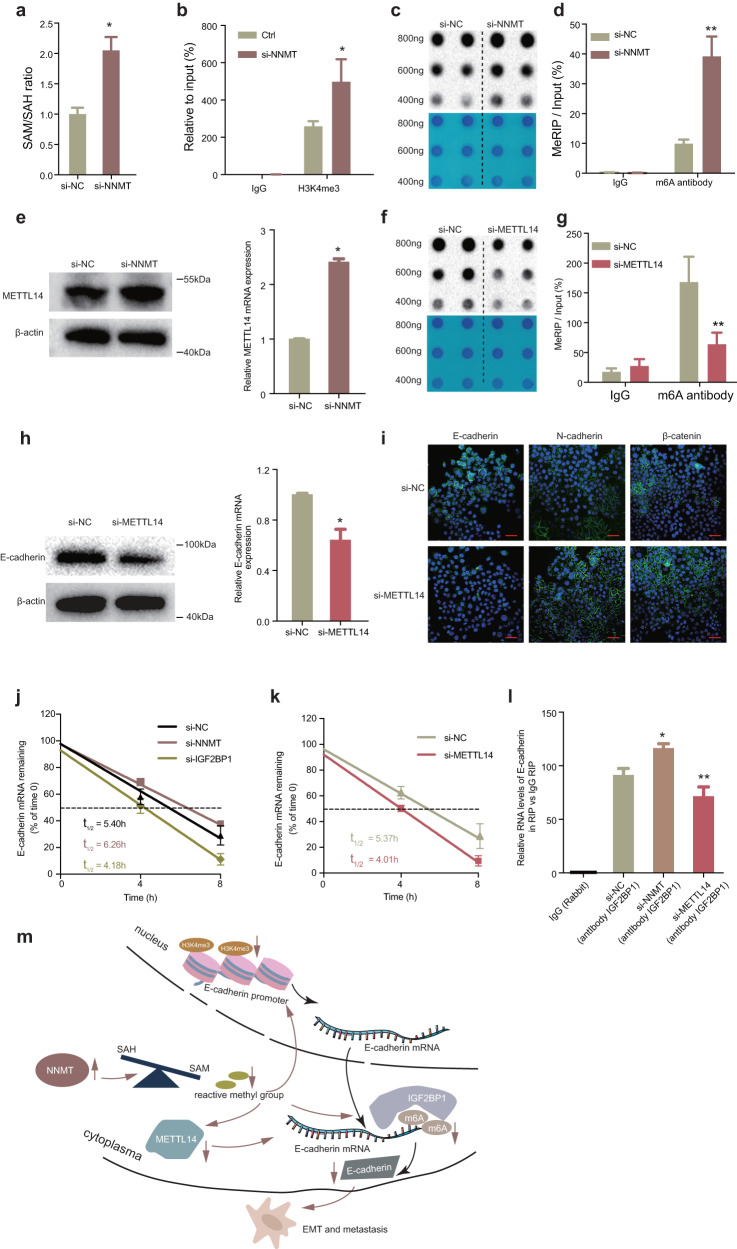
Metabolic reprogramming has been observed in cancer metastasis, whereas metabolic changes required for malignant cells during lymph node metastasis of esophageal squamous cell carcinoma (ESCC) are still poorly understood. Here, we performed single-cell RNA sequencing (scRNA-seq) of paired ESCC tumor tissues and lymph nodes to uncover the reprogramming of tumor microenvironment (TME) and metabolic pathways. By integrating analyses of scRNA-seq data with metabolomics of ESCC tumor tissues and plasma samples, we found nicotinate and nicotinamide metabolism pathway was dysregulated in ESCC patients with lymph node metastasis (LN+), exhibiting as significantly increased 1-methylnicotinamide (MNA) in both tumors and plasma. Further data indicated high expression of N-methyltransferase (NNMT), which converts active methyl groups from the universal methyl donor, S-adenosylmethionine (SAM), to stable MNA, contributed to the increased MNA in LN+ ESCC. NNMT promotes epithelial-mesenchymal transition (EMT) and metastasis of ESCC in vitro and in vivo by inhibiting E-cadherin expression. Mechanically, high NNMT expression consumed too much active methyl group and decreased H3K4me3 modification at E-cadherin promoter and inhibited m6A modification of E-cadherin mRNA, therefore inhibiting E-cadherin expression at both transcriptional and post-transcriptional level. Finally, a detection method of lymph node metastasis was build based on the dysregulated metabolites, which showed good performance among ESCC patients. For lymph node metastasis of ESCC, this work supports NNMT is a master regulator of the cross-talk between cellular metabolism and epigenetic modifications, which may be a therapeutic target.


Conflict of interest statement

The authors declare no competing interests.

Figures

Fig. 1
Fig. 1. Cellular atlas of ESCC tumor tissues and paired lymph nodes.
a Schematic illustration of scRNA-seq analyses and metabolomics. b Cell populations identified in ESCC tumor tissues and paired lymph node samples. The t Stochastic neighbour Embedding (tSNE) plots for 66,864 high-quality cells from tumor tissues (n = 5) and lymph node samples (n = 5), and nine major cell clusters identified are labeled. Each dot corresponds to a single cell and is colored based on its cell type. c TSNE plots colored by sample origin (left), and lymph node metastatic groups (right). d Violin plots showing expression distribution of marker genes in nine cell types. e The proportion of each cell type in 10 samples. Among all samples, 5 L and 4 L represent mLN; 1 L, 2 L, and 3 L represent nLN; 5 T and 4 T represent LN+ ESCC; 1 T, 2 T and 3 T represent LN ESCC.
Fig. 2
Fig. 2. Composition of the immune microenvironment of ESCC.
a TSNE plot of all immune cells colored by cell subtypes. b TSNE plot of immune cells colored by tissue types. c Average gene expression of selected marker genes for immune cell subtypes, for cell subtype color code see (a). d The relative quantification of lymphoid and myeloid cell subtypes in each tissue type. e The relative quantification of Treg cells in each tissue type, color code for tissue type is consistent with (b). f Dot plot of representative naïve and Treg signatures in conventional and CD4 T cell subtypes. g Violin plot showing the CCL5, CCL4, NKG7, GZMB, GZMA, and GZMK in CD8-effector-C1 and CD8-effector-C2 cells. h Module scores of gene signatures related to inflammation of different macrophage subtypes, for cell cluster color code see (a). i Heatmap showing differences in metabolic pathways scored per cell by GSVA among Treg, CD8 T and NK cells.
Fig. 3
Fig. 3. Fibroblasts in the TME of ESCC.
a TSNE plot of fibroblasts, showing the composition of five main subtypes. b TSNE plot showing fibroblast from LN+ and LN groups. c Heatmap of marker genes expression in fibroblasts. d Average proportion of each fibroblast subtype between LN+ and LN groups. e Differences in pathway activities scored per cell by GSVA between LN+ and LN group. f Metabolic pathways are scored per cell by GSVA among five fibroblast subtypes. The relative activity scores were obtained from a linear model by limma and sorted by pathway activity in Fibro_C5 cells.
Fig. 4
Fig. 4. Metabolic pathways were broadly altered in LN+ESCC.
a, b The TSNE projection of cells from five ESCC patients, showing LN+ group and LN group. a Cancer cell identification was inferred by CNV sub-clusters and was highly patient-specific. b Each dot corresponds to a single cell, with each sample represented by a different color. c Mean pathway activity scores of tumor epithelial cells grouped by sample. d The volcano plot shows DEGs between LN+ ESCC and LN ESCC maligant cells. The genes related to metabolic pathways are labeled with their gene names. The red and blue points indicate up and down-regulated DEGs in maligant cells, respectively. e Differences in pathway activities scored per cell by GSVA between LN+ and non-metastasis groups. f Metabolic pathway expression profiles in the LN+ group. For each pathway, the fold change in malignant cells was calculated by comparing to other cell types and corrected for sample of origin. Pathways were ordered by log-fold change in malignant cells, respectively.
Fig. 5
Fig. 5. Increased nicotinate and nicotinamide metabolism in LN+ ESCC.
a Heatmap of normalized metabolite abundance in LN+ and LN ESCC tissues. b The enriched pathway of differentiated metabolites in tissue samples of ESCC. c Heatmap of normalized metabolite abundance in plasma from LN+ and LN ESCC patients. d The enriched pathway of differentiated metabolites in plasma samples from LN+ and LN ESCC patients. e Principal component analysis showed stratification of plasma samples based on abundance 3 metabolites. PC1 and PC2 values represent the top two principal coordinates. Different sample types were denoted by color code. f Performance of various predictive models in forms of receiver operating characteristic (ROC) curves and area under curve (AUC) scores, based on the 51-patient test set. The performance of various predictive models based on different feature sets, namely clinical, metabolic, and integrated model, respectively. The ROC curves of models are shown as lines of different colors. AUC and the 95% CI of each model are shown in the legend.
Fig. 6
Fig. 6. NNMT promotes ESCC cell metastasis in vitro and in vivo.
a The tSNE plot of tumor cells, colored by tissues (left) and expression of four key enzymes of nicotinate and nicotinamide metabolism pathway (right). b NNMT was analyzed by western blotting after knockdown of NNMT in Eca-109 cells. Then transwell was used to investigate the cell migration ability after corresponding transfection. c After corresponding transfection, wound healing assays were used to analyze the migration ability of Eca-109 cells. d Eca-109 cells with NNMT knockdown were injected into mice through the tail vein to analyze animal models of tumor metastasis. e GO analysis for all genes with altered expression after knockdown of NNMT in Eca-109 cells. f GSEA showed that genes in response to NNMT knockdown were enriched for gene sets significantly related to the epithelial mesenchymal transition. g The mRNA level of E-cadherin was confirmed by qRT-PCR in Eca-109 cells with NNMT knockdown. h The protein levels of E-cadherin, N-cadherin and β-catenin were detected by western blot in Eca-109 cells. i Immunofluorescence staining of E-cadherin, N-cadherin, and β-catenin (green) in the Eca-109 cells after treatment. The blue signal represents the nuclear DNA staining by 4′,6-diamidino-2-phenylindole.
Fig. 7
Fig. 7. NNMT promotes EMT in ESCC by inhibiting E-cadherin expression transcriptionally and post-transcriptionally.
a The SAM/SAH ratio significantly increased after silencing NNMT in Eca-109 cells. b ChIP-qPCR of H3K4me3 of the promoter region of the E-cadherin locus after siRNA treatment targeting si-NNMT in Eca-109 cells. Antibody enrichment was quantified relative to the amount of input DNA. An antibody directed against IgG was used as a negative control. c The m6A dot blot assay was used to investigate the global m6A abundance after knockdown of NNMT compared with the control group in Eca-109 cells. d MeRIP-qPCR was performed to quantify the relative m6A modification level of E-cadherin upon NNMT knockdown in Eca-109 cells. e qRT-PCR assays and western blot assays detected the mRNA and protein levels of METTL14 after knockdown of NNMT expression in Eca-109 cells. f The m6A dot blot assay was used to investigate the global m6A abundance after silencing METTL14 compared with the control group in Eca-109 cells. g MeRIP-qPCR was performed to quantify the relative m6A modification level of E-cadherin after knockdown of METTL14 in Eca-109 cells. h qRT-PCR and western blot assays detected the mRNA and protein levels of E-cadherin after siRNA treatment of METTL14 in Eca-109 cells. i Immunofluorescence staining of E-cadherin, N-cadherin, and β-catenin (green) in the Eca-109 cells expressing after knockdown of METTL14. j Lifetime of E-cadherin mRNA levels in Eca-109 cells with NNMT and IGF2BP1 knockdown. k Lifetime of E-cadherin mRNA levels after silencing METTL14 in Eca-109 cells. l A RIP experiment for IGF2BP1 was performed in Eca-109 cells, and the coprecipitated RNA was subjected to qRT-PCR for E-cadherin after transfection of si-NC, si-NNMT and si-METTL14. The fold enrichment of E-cadherin in RIP is relative to its matching IgG control RIP. *P < 0.05, **P < 0.01. m Schematic map showing that NNMT promotes EMT of ESCC via decreasing H3K4me3 in E-cadherin promoter region at transcriptional level and inhibiting m6A modification of E-cadherin in an m6A-dependent manner at post-transcriptional level.

References

    1. Siegel RL, Miller KD, Fuchs HE, Jemal A. Cancer statistics, 2022. CA Cancer J. Clin. 2022;72:7–33. doi: 10.3322/caac.21708. - DOI - PubMed
    1. Chen W, et al. Cancer incidence and mortality in China, 2013. Cancer Lett. 2017;401:63–71. doi: 10.1016/j.canlet.2017.04.024. - DOI - PubMed
    1. Hou X, et al. The positive lymph node ratio predicts long-term survival in patients with operable thoracic esophageal squamous cell carcinoma in China. Ann. Surg. Oncol. 2013;20:1653–1659. doi: 10.1245/s10434-012-2794-4. - DOI - PubMed
    1. Hanahan D, Weinberg RA. Hallmarks of cancer: the next generation. Cell. 2011;144:646–674. doi: 10.1016/j.cell.2011.02.013. - DOI - PubMed
    1. Tasdogan A, et al. Metabolic heterogeneity confers differences in melanoma metastatic potential. Nature. 2020;577:115–120. doi: 10.1038/s41586-019-1847-2. - DOI - PMC - PubMed