. 2024 Mar;132(3):142-155.
doi: 10.1038/s41437-024-00669-2. Epub 2024 Jan 30.

Genetic constraints in genes exhibiting splicing plasticity in facultative diapause

Affiliations

Genetic constraints in genes exhibiting splicing plasticity in facultative diapause

Rachel A Steward et al. Heredity (Edinb). 2024 Mar.

Abstract

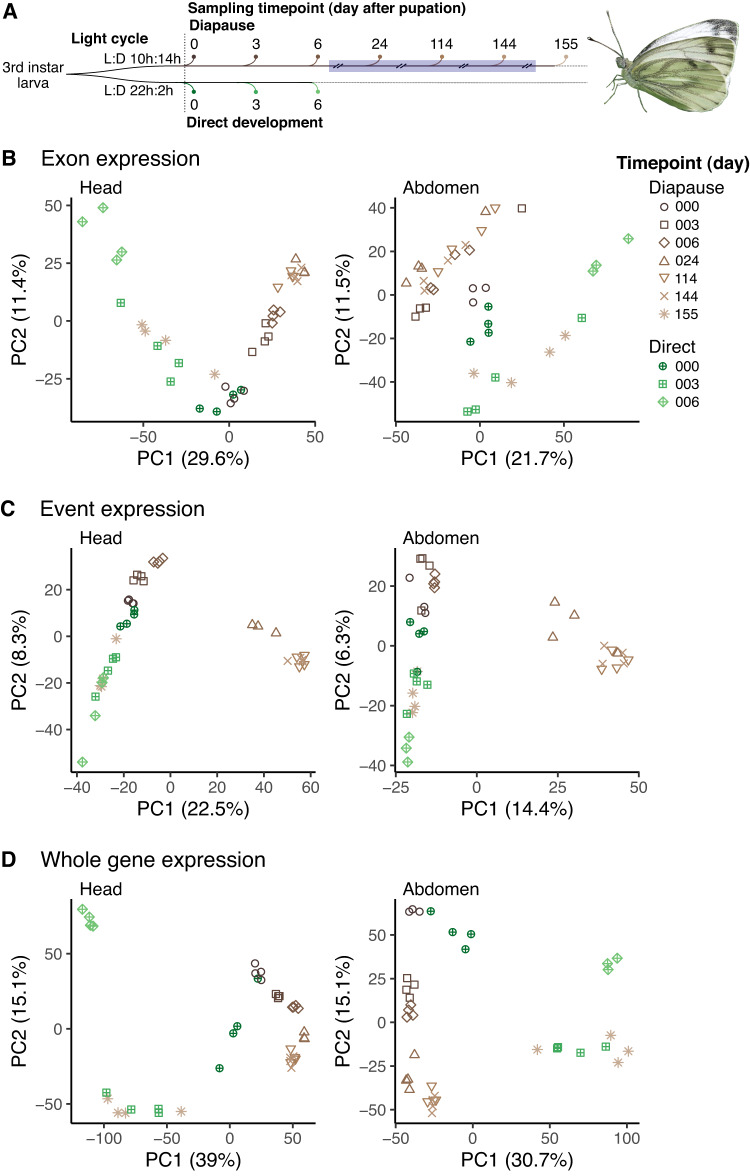
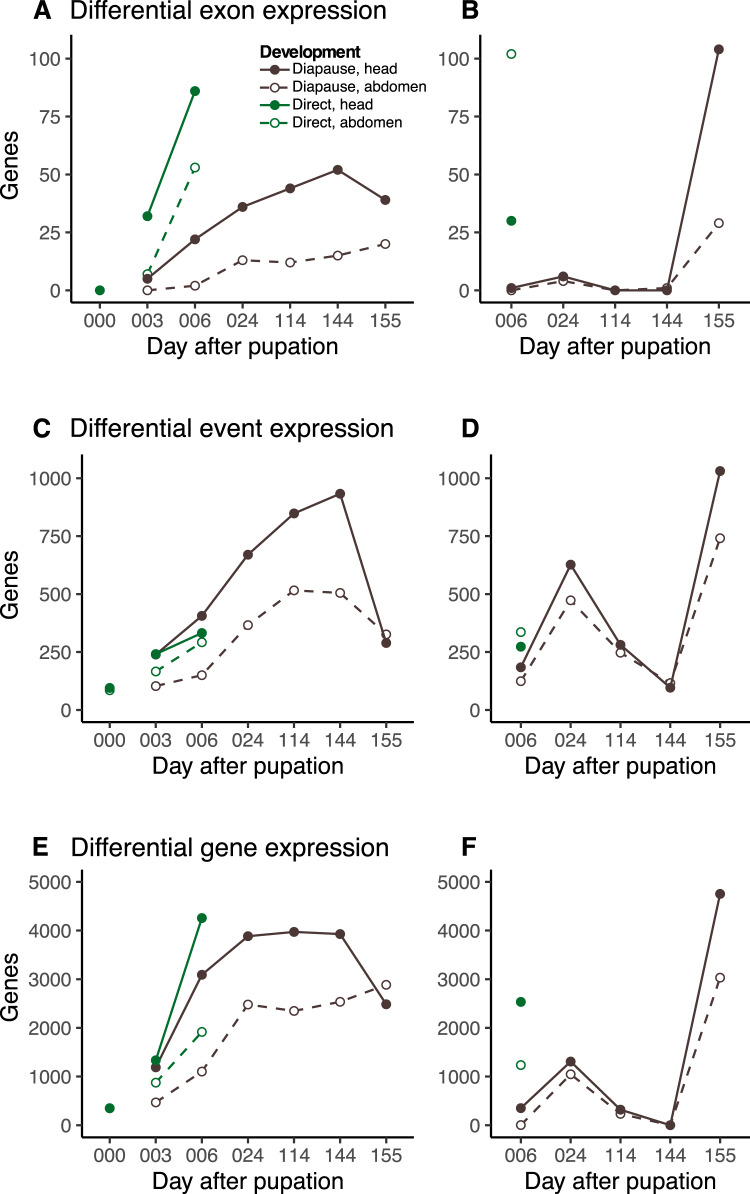
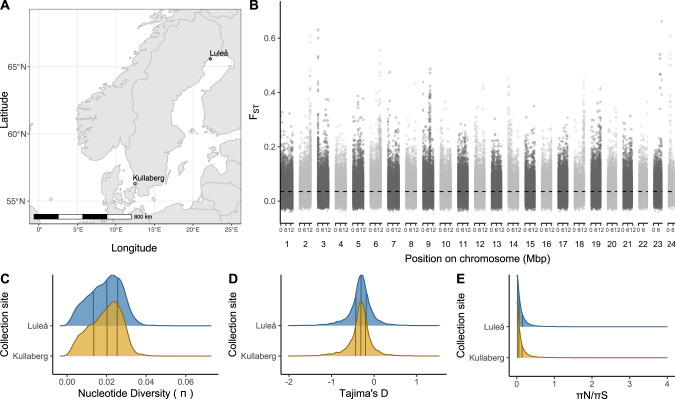
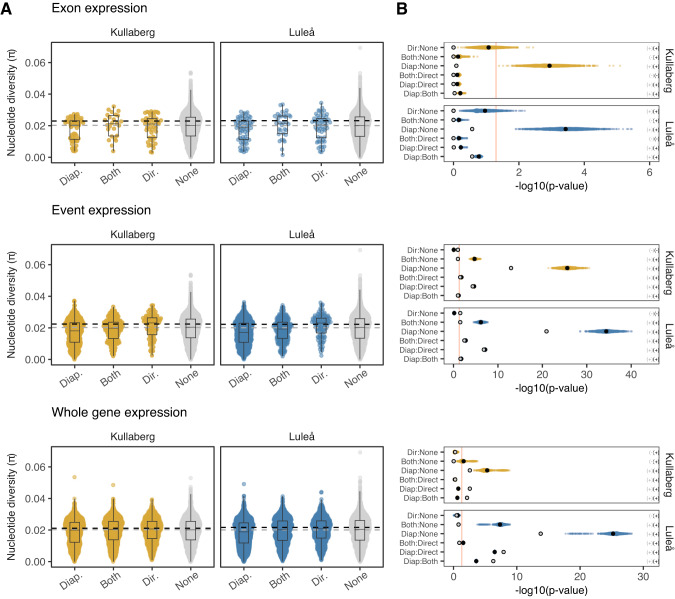
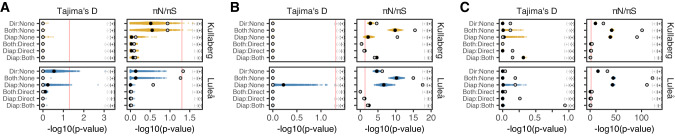
Phenotypic plasticity is produced and maintained by processes regulating the transcriptome. While differential gene expression is among the most important of these processes, relatively little is known about other sources of transcriptional variation. Previous work suggests that alternative splicing plays an extensive and functionally unique role in transcriptional plasticity, though plastically spliced genes may be more constrained than the remainder of expressed genes. In this study, we explore the relationship between expression and splicing plasticity, along with the genetic diversity in those genes, in an ecologically consequential polyphenism: facultative diapause. Using 96 samples spread over two tissues and 10 timepoints, we compare the extent of differential splicing and expression between diapausing and direct developing pupae of the butterfly Pieris napi. Splicing differs strongly between diapausing and direct developing trajectories but alters a smaller and functionally unique set of genes compared to differential expression. We further test the hypothesis that among these expressed loci, plastically spliced genes are likely to experience the strongest purifying selection to maintain seasonally plastic phenotypes. Genes with unique transcriptional changes through diapause consistently had the lowest nucleotide diversity, and this effect was consistently stronger among genes that were differentially spliced compared to those with just differential expression through diapause. Further, the strength of negative selection was higher in the population expressing diapause every generation. Our results suggest that maintenance of the molecular mechanisms involved in diapause progression, including post-transcriptional modifications, are highly conserved and likely to experience genetic constraints, especially in northern populations of P. napi.


Conflict of interest statement

The authors declare no competing interests.

Figures

Fig. 1
Fig. 1. Transcriptomic changes through the development of diapausing and directly developing pupae.
A Sampling time points (days after pupation) from the two developmental trajectories. Diapause or direct development was induced by exposing larvae to different photoperiods (Light:Dark cycles). To bring pupae out of diapause, diapausing pupae were exposed to cold temperatures between day 10 and 151 (blue rectangle) and kept in constant darkness between day 17 and 144. Diapausing larvae diverge from direct developing larvae at multiple levels of transcriptional variation: B exon expression, C event expression, and D whole gene expression.
Fig. 2
Fig. 2. Total differentially spliced and differentially expressed genes across diapause and direct development.
Reference analysis of differential (A) exon, (C) event and (E) gene expression through diapause and direct development, with the number of significant genes at each timepoint compared to day 0. Note that the results at day 0 (000) represent the number of genes differentially spliced or expressed between direct and diapause pupae on day 0. The remaining points connected by lines represent the comparison of indicated day (e.g., 003) vs. day 0. Stepwise analysis of differential (B) exon, (D) event and (F) gene expression through diapause and direct development, with the number of significant genes compared between adjacent timepoints, and labeled by the later developmental date (e.g. 006 shows results from 003 vs. 006).
Fig. 3
Fig. 3. Pieris napi populations used to test genetic constraints.
A Butterflies were collected from Kullaberg (yellow) and Luleå (blue) in Sweden. B Genome-wide genetic differentiation (Fst) between populations. Black and gray alternation delineates chromosomes. Distribution of (C) nucleotide diversity (π), (D) Tajima’s D and (E) πN/πS within populations. Vertical lines represent 25th, 50th and 75th quantiles. Genes mapping to the Z chromosome were excluded due to unknown composition of sexes in the Luleå pool.
Fig. 4
Fig. 4. Nucleotide diversity (π) of genes with differential exon expression, event expression, and gene expression in the head.
A π was compared among genes that were differentially spliced or expressed in diapausing timepoints only (Diap.), both diapausing and direct time points (Diap. & Dir), among direct timepoints only (Dir.) and in genes without transcriptional variation (None). Horizontal dashed lines represent median π for all ‘None’ genes (gray) and for matched gene sets (black). Matching the distribution of gene lengths, location along the chromosome (recombination rate proxy), and sample size with DS sets consistently increased the median nucleotide diversity in genes that were not DS (None). B Groups were compared with Kruskal–Wallis tests (Supplementary Table S9) with Dunn’s post-hoc pairwise comparisons corrected for multiple tests within each set (6 tests; Supplementary Table S10). Gray points show p-values (-log10 transformed) of Dunn’s multiple comparisons among full data, while yellow and blue points show p-values when comparing matched gene sets (n = 1000) for each population. Black points summarize means of these comparisons. The direction of the effect is shown in parentheses (gray = full data, black = matched ranges). Red lines represent significance thresholds of 0.05.
Fig. 5
Fig. 5. Differences in Tajima’s D and πN/πS among groups of differentially spliced and differentially expressed genes in the head.
Genes with A differential exon expression, B differential event expression, and C differential gene expression were grouped according to whether they were differentially spliced or expressed among diapausing timepoints only, both diapausing and direct time points, among direct timepoints only and in genes without transcription variation. Groups were compared with Kruskal–Wallis tests (Supplementary Table S9) with Dunn’s post-hoc pairwise comparisons corrected for multiple tests within each set (Supplementary Table S10). Gray points show p values (−log10 transformed) of Dunn’s multiple comparisons among full data, while yellow and blue points show p values when comparing matched gene sets (n = 1000) for each population. Black points summarize means of these comparisons. The direction of the effect is shown in parentheses (gray = full data, black = matched ranges). Red lines represent significance thresholds of 0.05.

References

    1. Aamodt RM. The caste- and age-specific expression signature of honeybee heat shock genes shows an alternative splicing-dependent regulation of Hsp90. Mech Ageing Dev. 2008;129:632–637. doi: 10.1016/j.mad.2008.07.002. - DOI - PubMed
    1. Abrieux A, Xue Y, Cai Y, Lewald KM, Nguyen HN, Zhang Y, et al. EYES ABSENT and TIMELESS integrate photoperiodic and temperature cues to regulate seasonal physiology in Drosophila. Proc Natl Acad Sci. 2020;117:15293–15304. doi: 10.1073/pnas.2004262117. - DOI - PMC - PubMed
    1. Alexa A, Rahnenfuhrer J (2022) topGO: Enrichment Analysis for Gene Ontology. R package version 2.54.0, https://bioconductor.org/packages/topGO
    1. Aris-Brosou S, Excoffier L. The impact of population expansion and mutation rate heterogeneity on DNA sequence polymorphism. Mol Biol Evol. 1996;13:494–504. doi: 10.1093/oxfordjournals.molbev.a025610. - DOI - PubMed
    1. Barberà M, Collantes-Alegre JM, Martínez-Torres D. Characterisation, analysis of expression and localisation of circadian clock genes from the perspective of photoperiodism in the aphid Acyrthosiphon pisum. Insect Biochem Mol Biol. 2017;83:54–67. doi: 10.1016/j.ibmb.2017.02.006. - DOI - PubMed

Publication types

Substances