. 2024 Mar;56(3):383-394.
doi: 10.1038/s41588-024-01653-6. Epub 2024 Jan 30.

Cell-type-specific CAG repeat expansions and toxicity of mutant Huntingtin in human striatum and cerebellum

Affiliations

Cell-type-specific CAG repeat expansions and toxicity of mutant Huntingtin in human striatum and cerebellum

Kert Mätlik et al. Nat Genet. 2024 Mar.

Abstract

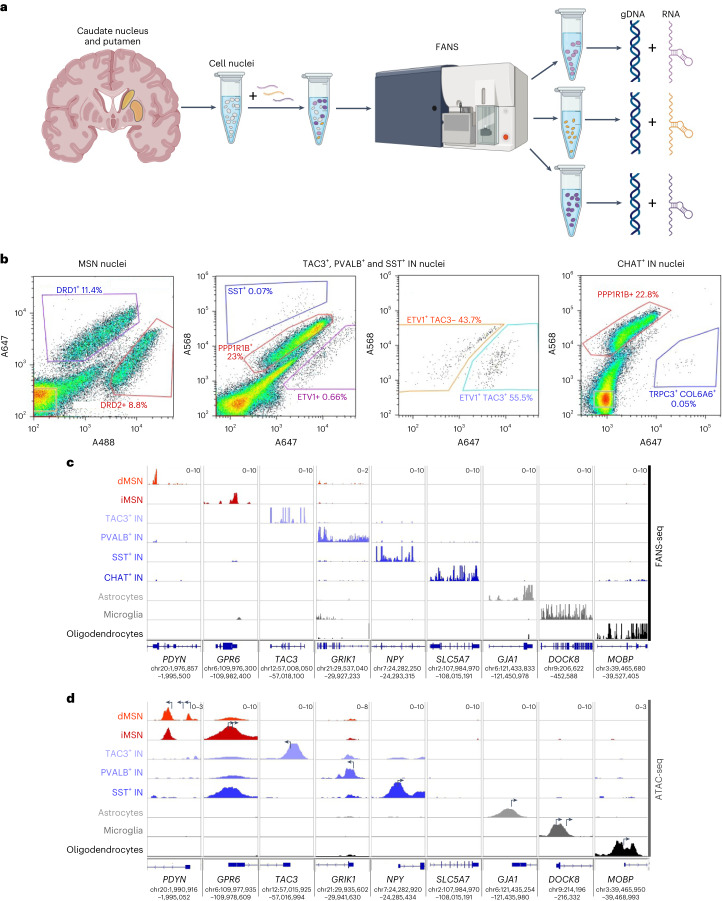
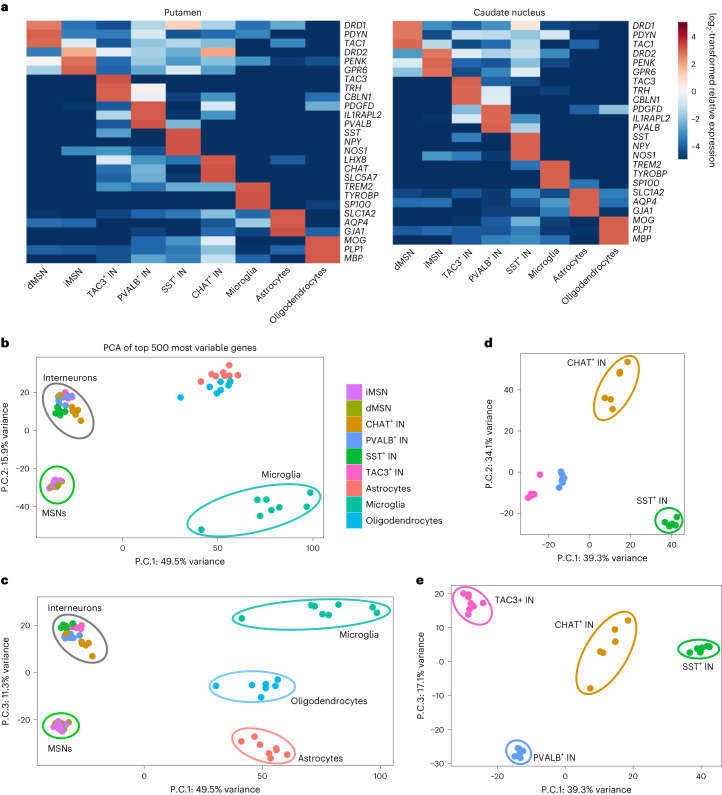
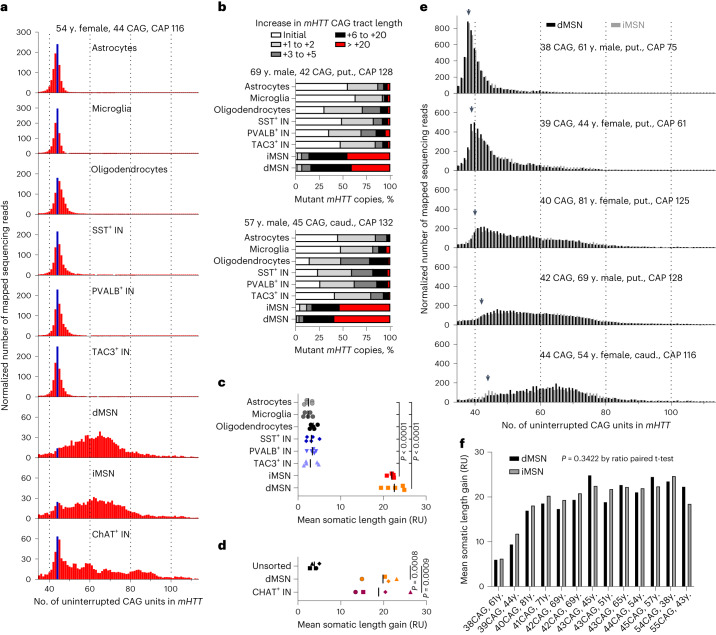
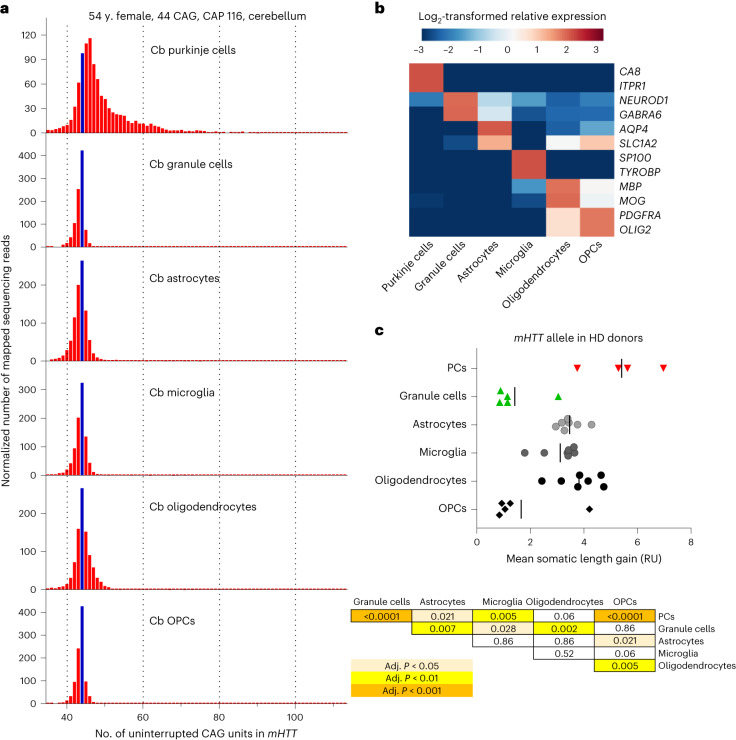
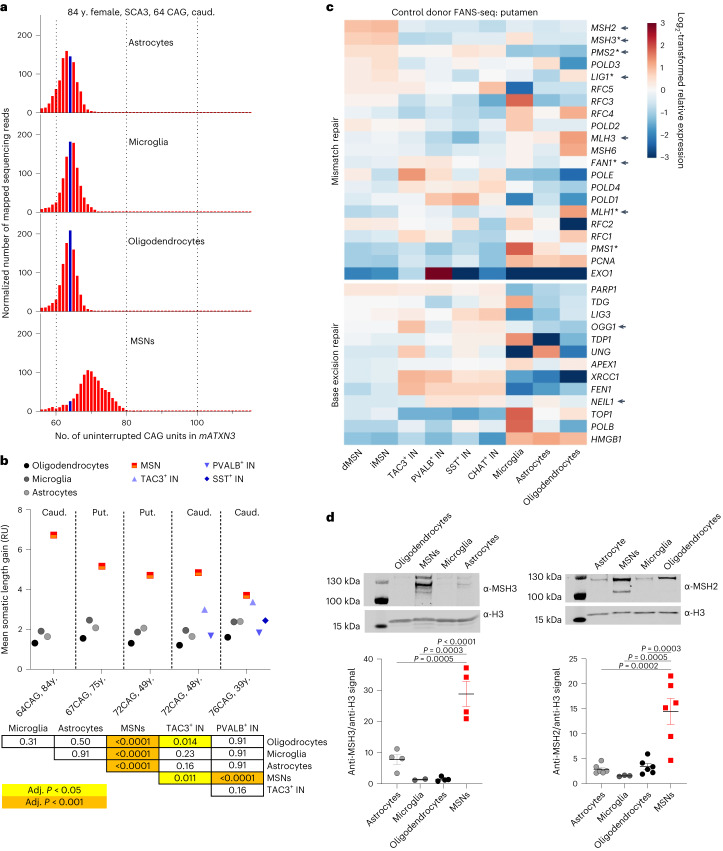
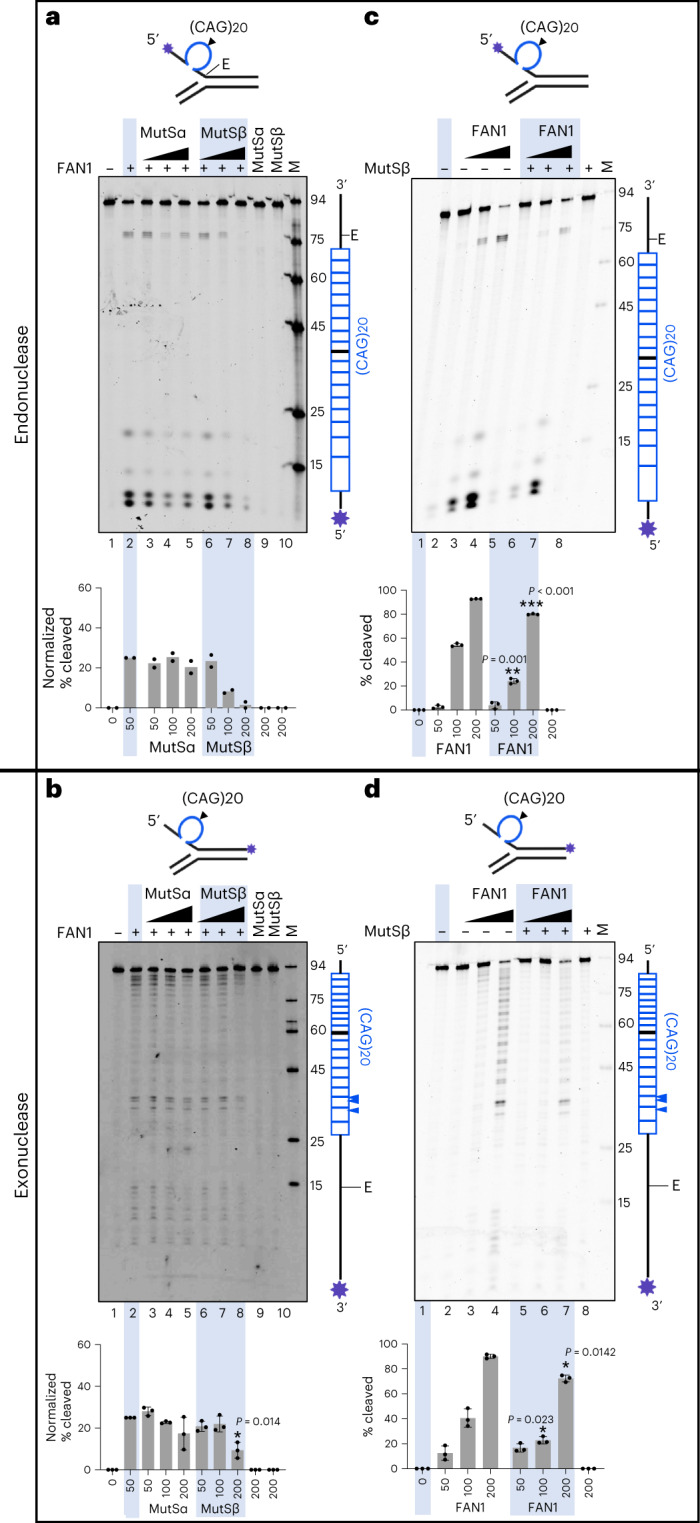
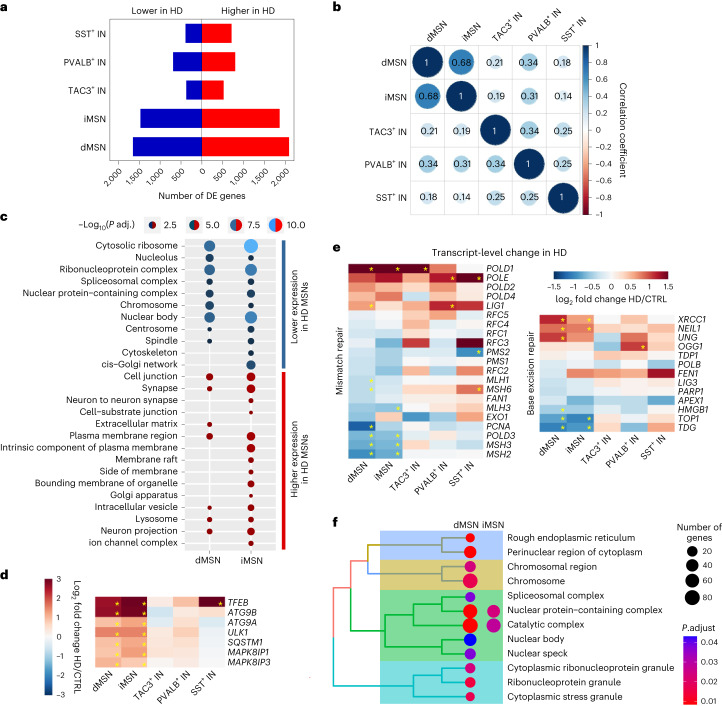
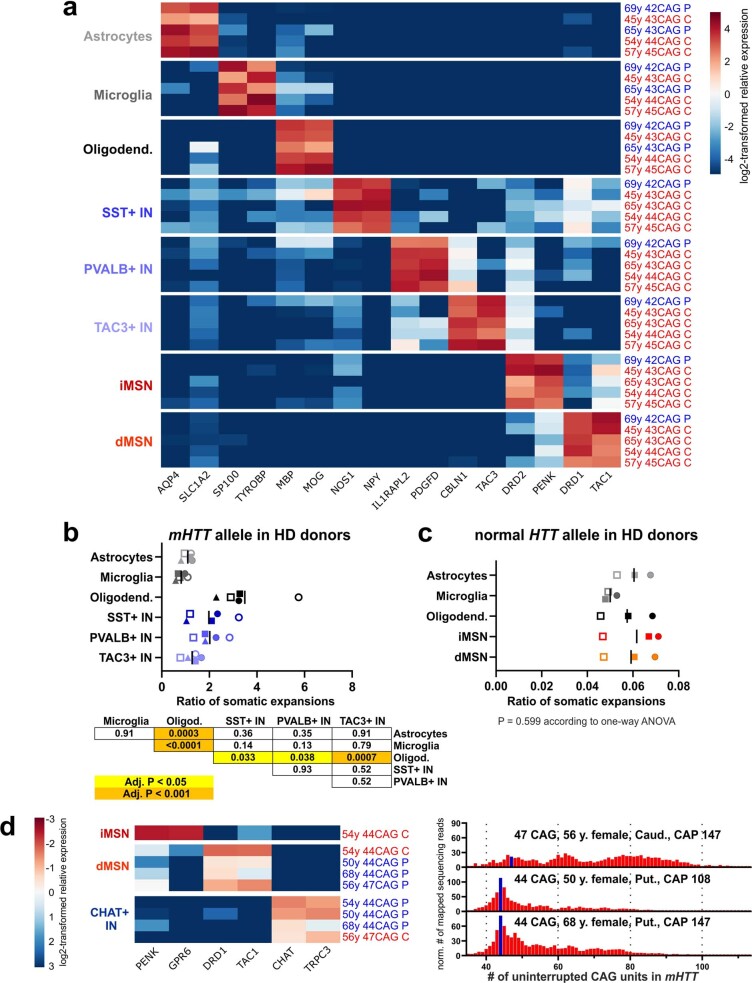
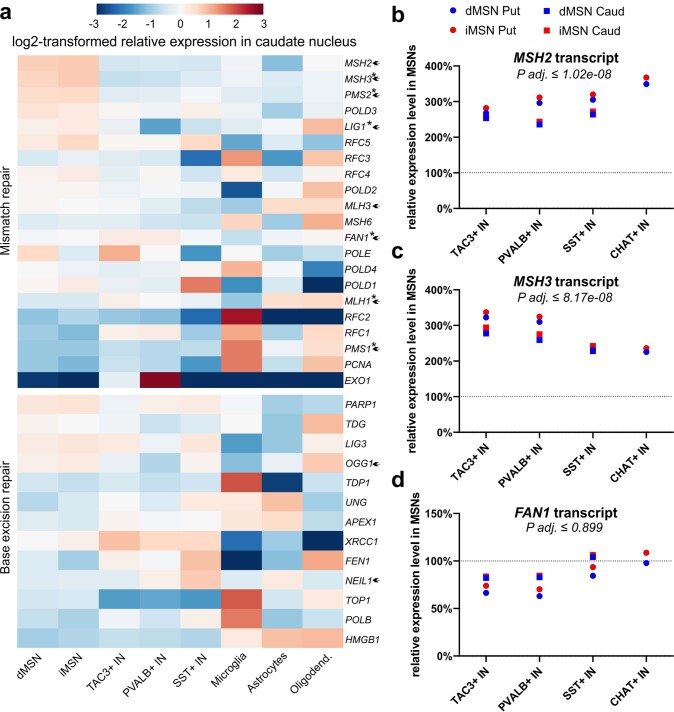
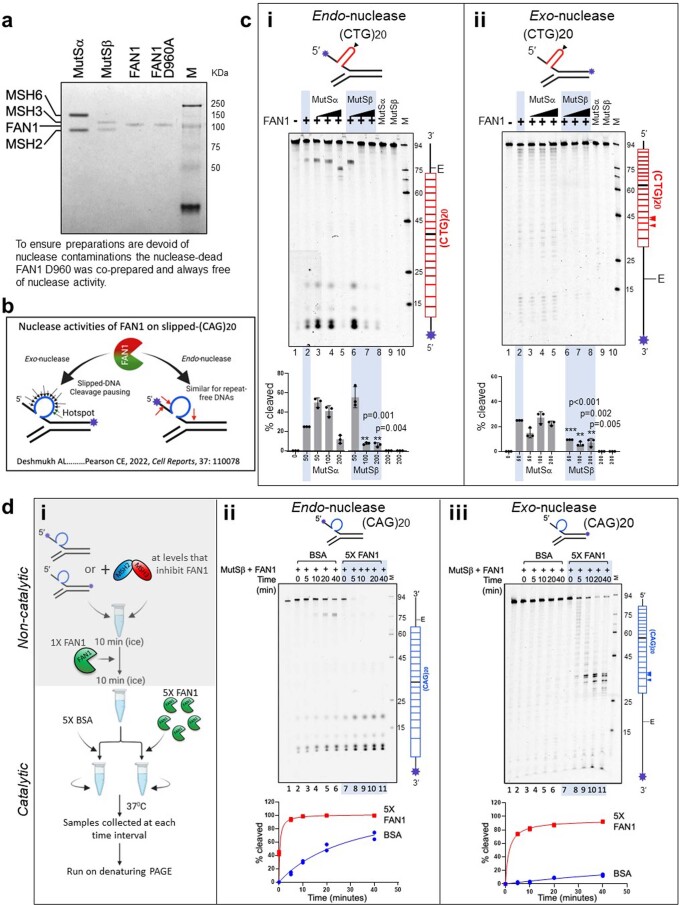
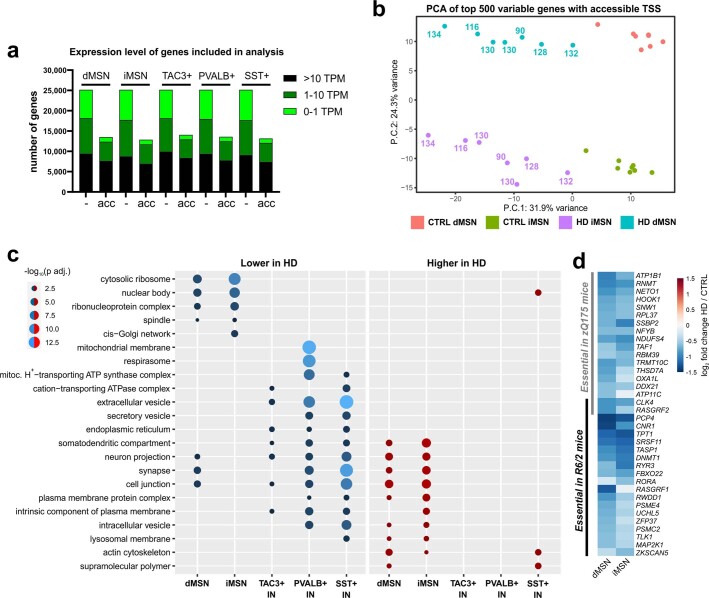
Brain region-specific degeneration and somatic expansions of the mutant Huntingtin (mHTT) CAG tract are key features of Huntington's disease (HD). However, the relationships among CAG expansions, death of specific cell types and molecular events associated with these processes are not established. Here, we used fluorescence-activated nuclear sorting (FANS) and deep molecular profiling to gain insight into the properties of cell types of the human striatum and cerebellum in HD and control donors. CAG expansions arise at mHTT in striatal medium spiny neurons (MSNs), cholinergic interneurons and cerebellar Purkinje neurons, and at mutant ATXN3 in MSNs from SCA3 donors. CAG expansions in MSNs are associated with higher levels of MSH2 and MSH3 (forming MutSβ), which can inhibit nucleolytic excision of CAG slip-outs by FAN1. Our data support a model in which CAG expansions are necessary but may not be sufficient for cell death and identify transcriptional changes associated with somatic CAG expansions and striatal toxicity.


Conflict of interest statement

The authors declare no competing interests.

Figures

Fig. 1
Fig. 1. FANS-based isolation of nuclei of striatal cell types from human post-mortem caudate nucleus and putamen.
a, Schematic representation of the procedure used to extract cell-type-specific genomic DNA and nuclear RNA from cell nuclei labeled with cell-type-specific probes. Created with BioRender.com. b, Representative FANS plots showing the labeling of striatal cell nuclei with PrimeFlow probes specific for dopamine receptor D1-expressing (DRD1+) medium spiny projection neurons of the direct pathway (dMSNs), dopamine receptor D2-expressing (DRD2+) medium spiny projection neurons of the indirect pathway (iMSNs), somatostatin-expressing interneurons (SST+ INs, SST+ nuclei), fast-spiking interneurons expressing parvalbumin (PVALB+ INs, ETV1+ TAC3 nuclei), primate-specific tachykinin precursor 3-expressing interneurons (TAC3+ INs, ETV1+ TAC3+ nuclei) and cholinergic interneurons expressing choline acetyltransferase (CHAT+ INs, TRPC3+ COL6A6+ nuclei). The probe against PPP1R1B labels all MSN nuclei. The detailed strategy used for sorting is described in Methods. c,d, Representative distribution of human FANS-seq (c) and ATAC-seq (d) reads mapped to genes expressed specifically in each of the striatal cell types studied. In panel d, arrows mark the position of annotated transcriptional start sites. The data are from a 41-year-old male control donor.
Fig. 2
Fig. 2. Purity and reproducibility of the isolation of striatal cell-type nuclei across the two striatal brain regions studied.
a, Heatmaps depict log2-transformed relative expression level of cell-type-specific marker genes in each cell type, calculated based on the mean of DESeq2-normalized counts from six to eight control donors. be, Principal-component analysis (PCA) of control donor (n = 6–8 individuals) FANS-seq datasets from all putamen cell types (b,c) indicated that the first three principal components (P.C.) separated neuronal datasets from glial ones (P.C. 1), MSN datasets from those of interneurons (P.C. 2) and datasets of different glial cell types from each other (P.C. 3). For FANS-seq datasets from putamen interneurons (d,e), the major principal components separated the datasets according to interneuron subtype.
Fig. 3
Fig. 3. mHTT CAG tract undergoes somatic expansion in selected striatal neuron types.
a, Length distribution of mHTT CAG tract in studied cell types of caudate nucleus and putamen of a 54-year-old female donor that carried a tract of 44 uninterrupted CAG units. Blue bar marks sequencing reads derived from the initial unexpanded CAG tract. y axes denote normalized number of sequencing reads mapped to reference sequences with different CAG tract lengths (normalized by scaling to 1,000 reads). Reads derived from the normal HTT allele are not shown. b, Frequency distribution of mHTT copies with different CAG tract length increases. Data are shown for striatal cell types of two donors that carried the most common HD-causing CAG tract lengths. c,d, Comparison of mean somatic length gain (measured in repeat units (RUs)). c, Although the mean somatic length gain of mHTT CAG tract was not different between dMSN and iMSN, comparison of each of these to any other striatal cell type showed a statistically significant difference (n = 5 individuals, P < 0.0001 by one-way analysis of variance (ANOVA), adjusted P < 0.0001 in Holm–Sidak’s multiple comparisons test). d, The mean somatic length gain of mHTT CAG tract was not different between dMSNs and CHAT+ interneurons, but comparison of each of these to unsorted nuclei showed a statistically significant difference (n = 4 individuals, P = 0.0004 by one-way ANOVA, adjusted P < 0.001 in Holm–Sidak’s multiple comparisons test). Different symbols are used for each of the four donors. e, Length distribution of mHTT CAG tract in MSNs of caudate nucleus and putamen in donors carrying mHTT alleles of reduced and full penetrance. Arrowhead indicates the initial unexpanded size of the CAG tract. f, Comparison of the mean somatic length gain of mHTT CAG tract. n = 13 individuals, P = 0.3422 between cell types, in ratio paired t-test (two sided). caud., caudate nucleus; put., putamen; y., year-old.
Fig. 4
Fig. 4. Expansion of mHTT CAG tract in cerebellar PCs.
a,b, Length distribution of mHTT CAG tract (a) and cell-type marker gene expression (b) in cerebellar (Cb) cell nuclei isolated from a 54-year-old female donor that carried a tract of 44 uninterrupted CAG units. Blue bar marks sequencing reads derived from the initial, unexpanded CAG tract. Reads derived from the shorter normal HTT allele are not shown. b, Heatmap depicts log2-transformed relative expression in each sample (calculated based on DESeq2-normalized counts). c, Comparison of the mean somatic length gain of mHTT CAG tract in cerebellar cell types from four to seven HD donors (n = 4 individuals for PCs, n = 5 for granule cells, n = 7 for astrocytes, microglia and oligodendrocytes, and n = 5 for oligodendrocyte progenitor cells (OPCs)). The table presents adjusted P values as calculated by Holm–Sidak’s multiple comparisons test following one-way ANOVA (P < 0.0001). The variability in somatic CAG expansion observed for PC samples from different donors can most likely be attributed to the rarity of this cell type (<0.01% of all nuclei), which made it extremely difficult to collect samples entirely free of contamination with nuclei of ‘non-expanding’ cell types. Alternatively, the extent of somatic CAG expansion in PCs could be variable in the donors we analyzed, given the reported variability of PC loss between HD patients.
Fig. 5
Fig. 5. MSNs are prone to somatic expansion of mATXN3 CAG tract and have elevated expression of nuclear MSH2 and MSH3 proteins.
a, Length distribution of mATXN3 CAG tract in cell types of caudate nucleus of an 84-year-old female donor that carried a tract of 64 uninterrupted CAG units. Size of the initial unexpanded CAG tract is marked with a blue bar. Reads derived from the normal ATXN3 allele are not shown. b, Comparison of the mean somatic length gain of mATXN3 CAG tract in striatal cell types from SCA3 donors (n = 5 individuals for MSNs, astrocytes, microglia and oligodendrocytes, n = 2 TAC3+ INs and PVALB+ INs, and n = 1 for SST+ INs). The table presents adjusted P values as calculated by Holm–Sidak’s multiple comparisons test following one-way ANOVA (P < 0.0001). c, Heatmaps depict log2-transformed relative expression of MMR and BER genes in cell types of putamen, calculated based on DESeq2-normalized counts from six to eight control donors. Genes identified as HD age at onset-modifying candidates or known to influence CAG tract instability in HD mouse models are marked with an asterisk or arrowhead, respectively. d, Representative immunoblots and quantification of anti-MSH3/anti-H3 (left) and anti-MSH2/anti-H3 signal ratio (right) in unfixed nuclei isolated from the putamen of control donors. These ratios were higher for MSNs compared to other cell types analyzed (P < 0.0001 by one-way ANOVA, adjusted P ≤ 0.0005 in Tukey’s multiple comparisons test). For anti-MSH3, n = 4 individuals for MSNs, astrocytes, and oligodendrocytes, and n = 2 individuals for microglia. For anti-MSH2, n = 6 individuals for MSNs, astrocytes and oligodendrocytes and n = 3 individuals for microglia. Data are presented as mean ± standard error of the mean (s.e.m.). Full-length blots are provided as Source Data. Source data
Fig. 6
Fig. 6. MutSβ and FAN1 levels competitively affect FAN1’s nuclease excision of excess slipped-CAG DNAs.
(CAG)20-slip-out DNA substrates (schematics) mimic putative intermediates of expansion mutations. Endo- and exonucleolytic activities can be distinguished by fluorescein amidite (FAM)-labeling at 5′ or 3′ ends of the (CAG)20 strand, respectively (indicated by an asterisk); in this manner, only the labeled strand and its digestion products are tracked. ‘E’ is elbow at the dsDNA-ssDNA junction. a,b, MutSβ not MutSα inhibits FAN1. Protein-free undigested slip-out DNA substrate (100 nM), lane 1. Slip-outs were preincubated with buffer, lane 2, or increasing concentrations of purified human MutSα (50, 100 or 200 nM), lanes 3–5; or MutSβ (50, 100 or 200 nM), lanes 6–8. Nuclease digestions were initiated by addition purified human FAN1 (50 nM). Lanes 9 and 10 have slip-out DNA and only MutSα (50 nM) or only MutSβ (50 nM), ensuring these purified proteins are nuclease-free. c,d, Increasing FAN1 concentration can overcome MutSβ-mediated inhibition of cleavage. Protein-free undigested slip-out (100 nM), lane 1. Slip-outs were preincubated with buffer, lanes 1–4 or with MutSβ (200 nM), lanes 5–7. Nuclease digestions were initiated by adding increasing amounts of FAN1 (50, 100 or 200 nM), lanes 2–4 and 5–7. Lane 8 has slip-out and only MutSβ (50 nM). For gels in panels a and b, the percentage cleavage for each reaction was normalized to cleavage levels with FAN1 alone (lane 2), and these levels were graphed (GraphPad prism 9.1). For gels in panels c and d, the percentage cleavage for each reaction were graphed. The vertical schematic to the right of each gel indicates the location of cleavage sites along the FAM-labeled DNA strand. ‘E’ is elbow at the dsDNA-ssDNA junction, blue arrowheads represent cleavage hotspots. Results of two-sided unpaired t-test are indicated (versus FAN1 alone in panel b, or versus ‘no FAN1’ in panels c and d). n = 2 experiments for panel a, n = 3 experiments for the other panels and mean ± standard deviation (s.d.) are plotted.
Fig. 7
Fig. 7. Disease-associated gene expression changes in striatal neuron types.
a, Number of differentially expressed (DE) genes (Padj < 0.05 by DESeq2, adjusted for multiple comparisons) in the comparison of HD (n = 7 individuals for dMSNs and iMSNs, n = 6 individuals for all interneuron types) and control donor (n = 8 individuals) FANS-seq datasets from putamen or caudate nucleus. b, Correlation analysis of disease-associated expression changes of genes expressed in all striatal neuronal types studied. c, Selected nonredundant GOCC terms from enrichment analysis of genes with disease-associated expression changes in iMSN or dMSN (Padj < 0.05 by DESeq2), but not in any interneuron type (Padj > 0.05 in all HD versus control interneuron comparisons). d,e, Heatmaps depicting disease-associated changes in transcript levels of selected genes regulating autophagosome formation and transport (d), and transcript levels of MMR and BER genes (e). Statistically significant differences are marked with an asterisk (Padj < 0.05 by DESeq2, adjusted for multiple comparisons). CTRL, control. f, GOCC terms enriched for genes that were identified as essential for MSN viability in wild-type mice and are also downregulated in HD dMSNs (440 genes) or iMSNs (365 genes). GOCC terms enriched with less than 10 downregulated genes are omitted from the plot. For panels c and f, the significance threshold for enrichment analysis was: q value < 0.05, Padj < 0.05, adjusted for multiple comparisons after hypergeometric test with clusterProfiler.
Extended Data Fig. 1
Extended Data Fig. 1. Comparison of interneuron populations collected using FANS to cell types defined from single-nucleus RNA sequencing of human striatum.
Relative expression in each cell type was calculated based on DESeq2-normalized counts from 6-8 control donors, and was log2-transformed for visualization (see Methods). The marker genes specific for each interneuron subtype were selected based on single-nucleus RNA sequencing (snRNA-seq) data. The FANS-isolated ETV1 + TAC3- population of Parvalbumin-expressing interneuron nuclei most likely captured both the major PVALB+ interneuron population and the related smaller PVALB + TH+ interneuron population defined as a separate subtype in snRNA-seq analysis.
Extended Data Fig. 2
Extended Data Fig. 2. Characterization of FANS-seq datasets from control donors.
a, Principal-component analysis of FANS-seq data from MSNs of caudate nucleus and putamen from 8 control donors. The main principal components separated datasets according to MSN subtype (P.C.1) and donor sex (P.C.2). Notably, none of the top principal components related to the brain region of origin (that is caudate nucleus or putamen). b, Number of genes with expression level above an arbitrary cutoff value of 5 transcripts per million (TPM) in individual FANS-seq datasets from control donors (mean is plotted). c, The number of genes with accessible transcriptional start sites (acc.), defined as having a consensus ATAC-seq peak at the transcriptional start sites (TSS), in striatal cell types from control donors. ATAC-seq datasets could not be produced from CHAT+ INs due to their low abundance in striatal tissue. Genes have been grouped according to average expression level in FANS-seq datasets from the specified cell type in control donors (n = 6-8 individuals). Excluding genes with inaccessible promoters removed a large proportion of genes with very low expression levels (<1 TPM) while affecting fewer genes with moderate to high expression (>10 TPM). See also Supplementary Note 1.
Extended Data Fig. 3
Extended Data Fig. 3. Further characterization of samples used for mHTT CAG repeat tract stability analysis.
a, Relative expression level of marker genes of striatal cell types in the nuclear transcriptome of nuclei collected for mHTT CAG repeat tract analysis. Heatmap depicts log2-transformed relative expression in each sample (calculated based on DESeq2-normalized counts). The striatal region of origin is indicated by colored letters (blue P, putamen; red C, caudate nucleus). b, Comparison of the calculated ratio of somatic expansions of mHTT CAG tract in striatal cell types other than MSNs (n = 5 individual donors). The table presents adjusted P-values as calculated by Holm–Sidak’s multiple comparisons test post one-way ANOVA (P < 0.0001). See also Supplementary Note 2. c, Ratio of somatic expansions of normal HTT allele CAG tract in striatal cell types isolated from n = 3 HD donors with 21-25 uninterrupted repeats in normal HTT allele. P = 0.599 according to one-way ANOVA. A different symbol is used for each donor. d, (Left) Relative expression level of MSN and CHAT + IN marker genes in the nuclear transcriptome of nuclei collected for mHTT CAG repeat tract analysis (for description see a). (Right) Length distribution of mHTT CAG tract in CHAT + IN samples. Blue bar marks sequencing reads derived from the initial unexpanded CAG tract. y axes denote normalized number of sequencing reads mapped to reference sequences with different CAG tract lengths (normalized by scaling to 1,000 reads). Reads derived from the normal HTT allele are not shown.
Extended Data Fig. 4
Extended Data Fig. 4. Relative expression level of MMR and BER genes in cell types of caudate nucleus.
a, Heatmaps depict log2-transformed relative expression in each cell type, calculated based on the mean of DESeq2-normalized counts from 7-8 control donors. Genes identified as HD age at onset-modifying candidates are marked with an asterisk. Genes known to influence CAG tract instability in HD mouse models are marked with an arrowhead. b-d, Relative levels of MSH2 (b), MSH3 (c) and FAN1 (d) transcripts in MSNs compared to interneurons, calculated with DESeq2 using cell type-specific FANS-seq data from control donors. The largest P adj. value of all MSN vs. interneuron comparisons (by DESeq2, P adjusted for multiple comparisons) is indicated for each gene. For caudate nucleus samples: n = 8 individuals for dMSNs, iMSNs, TAC3 + IN, PVALB + IN and SST + IN. For putamen samples: n = 8 individuals for dMSNs, iMSNs, TAC3 + IN, n = 7 individuals for PVALB + IN and n = 6 individuals for SST + IN.
Extended Data Fig. 5
Extended Data Fig. 5. MSH2, MSH3, MSH6, and FAN1 proteins, nuclease assay, (CTG)20 digestion.
a, A representative Coomassie brilliant blue-stained SDS-PAGE of purified human MutSα (MSH2-MSH6), MutSβ (MSH2-MSH3), FAN1 and nuclease-dead FAN1p.D960A (purified in parallel to ensure an absence of contaminating nuclease activity in preparations), expressed in Sf9 cells using baculoviral overexpression. Both MutSα and MutSβ preparations were free of nuclease contamination (see c panels i and ii, lanes 9 and 10). Purity and activity were assessed for ~10 preparations, with consistent results. b, Schematic of FAN1 exo-nucleolytic and endo-nucleolytic cleavage sites on slipped-(CAG)20 DNA substrates labeled at the 3’ or 5’ ends, respectively. FAN1’s exo-nucleolytic ‘nibbling’ of excess repeats parallels the ‘inchworm’ expansions in patient brains, suggesting a role for FAN1 in regulating repeat instability. Endo- and exo-nucleolytic activities can be distinguished by fluorescein amidite (FAM)-labeling at 5’ or 3’ ends of the (CAG)20 strand, respectively (asterisk); in this manner, only the labeled strand and its digestion products are tracked. c, Slipped-(CTG)20 DNAs are digested by endo- and exo-nucleolytic activities of FAN1, which can be inhibited by MutSβ, but not by MutSα. FAM-labelled CTG slip-out oligonucleotides (schematic, arrowhead indicated center of repeat tract) mimic putative intermediates of expansion mutations. Exo- and endo-nuclease activities were determined by labeling either 3′- or 5′-end of (CTG)20 strand, respectively (asterisk). ‘E’ is elbow at the dsDNA-ssDNA junction. Slip-out DNA substrates (100 nM) were preincubated with increasing amounts of purified human MutSα or MutSβ (0-200 nM), and nuclease digestion was initiated by addition purified human FAN1 (50 nM). Vertical schematic to the right of each gel indicates location of cleavage sites along the FAM-labeled DNA strand. Percentage cleavage (densitometry) for each reaction was then normalized to cleavage levels for FAN1 alone, and these levels were graphed (n = 3 experiments, mean ± s.d. plotted). Results of two-sided unpaired t-test are indicated (vs. ‘FAN1 alone’ in panels i and ii). d, Excess FAN1 overcomes MutSβ-mediated inhibition. (i) Flowchart outlining the competition experiment. Human MutSβ (200 nM), FAN1 (50 nM) and (ii) 5’- or (iii) 3′-FAM-labeled CAG slip-outs (100 nM), that is conditions established to be completely inhibited by MutSβ, were preincubated in non-catalytic conditions (on ice). Reactions were split at the 10-min time point and challenged with 5× BSA, to control for macromolecular crowding (lanes 2–6) or an excess (5×) of FAN1 (lanes 7–11). Aliquots were taken for analysis at different timepoints (0, 5, 10, 20 and 40 minutes) and cleavage products were quantified (n = 2 experiments).
Extended Data Fig. 6
Extended Data Fig. 6. Further characterization of HD-associated gene expression changes in striatal neurons.
a, The number of genes with accessible transcriptional start sites (acc.), defined based on the overlap of TSS and consensus peaks in ATAC-seq data from HD and control donor MSNs, and control donor interneurons. Genes have been grouped according to their average expression level in FANS-seq datasets from HD donors (TPM, transcripts per million). More than 98% of genes with accessible promoters in HD MSNs had accessible promoters also in MSNs from control donors. Due to the low abundance of striatal interneurons and limited amounts of striatal tissue available from HD donors, ATAC-seq datasets could not be produced from the interneurons of HD donors. Therefore, striatal interneuron FANS-seq datasets were filtered to include only those genes that had accessible promoters in control donors. b, Principal-component analysis of FANS-seq data from putamen and caudate nucleus MSNs from HD and control donors, performed after the exclusion of genes with inaccessible TSSs. The calculated CAP100 scores are shown for each HD donor. Note that disease status (P.C.1) and MSN subtype (P.C.2) were the main sources of variance in these datasets. c, Selected nonredundant Gene Ontology Cellular Component terms from enrichment analysis of genes with disease-associated expression changes (Padj < 0.05 by DESeq2 after adjusting for multiple comparisons) in each striatal neuron type HD (n = 7 individuals for HD dMSNs and HD iMSNs, n = 6 individuals for HD interneurons, n = 8 individuals for all cell types from control donors). Significance threshold for enrichment analysis: q value < 0.05, Padj < 0.05, adjusted for multiple comparisons after hypergeometric test with clusterProfiler. d, Genes essential for MSN viability in the zQ175 and R6/2 mouse models of HD that are also downregulated in HD iMSNs or dMSNs by more than a third (log2FC < −0.6, Padj < 0.01 by DESeq2, adjusted for multiple comparisons). See also Supplementary Note 5.

Update of

References

    1. Gusella JF, Lee JM, MacDonald ME. Huntington’s disease: nearly four decades of human molecular genetics. Hum. Mol. Genet. 2021;30:R254–R263. doi: 10.1093/hmg/ddab170. - DOI - PMC - PubMed
    1. Heinsen H, et al. Cortical and striatal neurone number in Huntington’s disease. Acta Neuropathol. 1994;88:320–333. doi: 10.1007/BF00310376. - DOI - PubMed
    1. Ferrante RJ, et al. Morphologic and histochemical characteristics of a spared subset of striatal neurons in Huntington’s disease. J. Neuropathol. Exp. Neurol. 1987;46:12–27. doi: 10.1097/00005072-198701000-00002. - DOI - PubMed
    1. Massouh M, Wallman MJ, Pourcher E, Parent A. The fate of the large striatal interneurons expressing calretinin in Huntington’s disease. Neurosci. Res. 2008;62:216–224. doi: 10.1016/j.neures.2008.08.007. - DOI - PubMed
    1. Cicchetti F, Prensa L, Wu Y, Parent A. Chemical anatomy of striatal interneurons in normal individuals and in patients with Huntington’s disease. Brain Res Brain Res Rev. 2000;34:80–101. doi: 10.1016/S0165-0173(00)00039-4. - DOI - PubMed